Journal of Clinical and Experimental Ophthalmology
Open Access
ISSN: 2155-9570
ISSN: 2155-9570
Research - (2021)Volume 12, Issue 5
This research work determined the distribution of refractive errors among school children aged 5 to 15 years in Mgbidi, Awgu Local Government Area of Enugu state, Nigeria. A total of 416 school children from 4 schools; 2 primary schools and 2 secondary schools were assessed. School children with cognitive problems were not included in the study. Visual acuities were taken using Snellen’s distance visual acuity chart and Jaeger’s acuity card for far and near visual acuities respectively. Refraction was carried out using retinoscope and trial lenses for objective and subjective refraction respectively. Spherical equivalent was employed for cylindrical corrections. Hyperopia occurred more than myopia in the population. The hyperopia power range of +0.25 D to < +1.00 D increased from 7.6% in the population of 3 to <8 years old, to 51.7% in the population of 12 to<15 years old. It then reduced to 24.6% in the 15 years and above. At 5% confidence level this was not significant, null hypothesis was accepted (F-cal=0.42 was less than F-tab=4.07). The high prevalence of hyperopia in the study population could be due to the less near work activities like computer games by the schoolchildren as Mgbidi is a rural community.
Refractive errors; Hyperopia; Enugu state
Refractive error occurs when the eye is unable to focus images clearly onto the retina. When not corrected, it can lead to visual impairment or blindness. Uncorrected Refractive Error (URE) is the most common cause of visual impairment and the second leading cause of blindness after cataract affecting 18% of the blindness population [1,2]. Also, URE accounts for two thirds of visual impairment cases in children globally [3].
The World Health Organisation in 2006 estimates that globally 153 million people over 5 years of age are visually impaired due to uncorrected refractive errors, of whom 8 million are blind [4].
WHO listed the following factors as being the cause of uncorrected refractive errors: lack of awareness and recognition of the problem at personal and family level, as well as at community and public health level; non-availability of and/or inability to afford refractive services for testing; insufficient provision of affordable corrective lenses; and cultural disincentives to compliance [3,4].
URE is a public health concern due to its significant impact on global economy [5]. Although several treatment strategies including optical, pharmacological and surgical interventions are in use, research is still on-going. Many investigations have focused on the association between refractive error and a wide variety of factors, such as age, race, intelligence, performance at near work, and genetic factors. Other factors include presence of ocular and systemic diseases, nutritional standard, the type and nature of work for which the eyes are used (visual task) [6]. Considering age and visual task of schoolchildren, results show that refractive status of the eye shifts--being less hyperopic with age from infancy (growth increases the axial length and the refractive indexes of the optical components of the eye), and more myopic with prolong use of the eyes at near [1,2,7].
Refractive error could be myopia (near sightedness), hyperopia (far sightedness) or astigmatism (distorted vision due to irregular shape of front surface of the eye or the lens or inside the eye). Several studies have reported that myopia is most common refractive error in the urban regions of developing countries such as Nigeria [8,9]. This has been attributed to environmental factors including urbanization and formal education. Other studies have shown myopic astigmatism to be prevalent [10].
The purpose of this study is to report the pattern of distribution of refractive errors among school children aged 5 to 15 years in Mgbidi, Awgu Local Government Area of Enugu state, Nigeria.
Study population
All subjects were pupils and students from two primary schools and two secondary schools which include: Queen of Angles Primary School, Mgbidi, Central School, Mgbidi, Queen of Angels Secondary School, Mgbidi, and Technical College, Mgbidi (Figure 1). The subjects were between the ages of 5 to 15 years old. Students with any known ocular pathology or neurological condition capable of causing reduction in vision or compromising testing were excluded from this study. A total number of 416 subjects were assessed.

Figure 1: Showing map of Mgbidi, Enugu, Nigeria from ©2021 Google Maps
Research design
The design of this research is that of prospective vision screening based-type of research. The subjects were screened for refractive anomalies based on the amount and type, in order to determined its pattern of distribution in the research area.
Brief description of research area
Mgbidi is one of the major 18 communities in Awgu Local Government Area of Enugu state, Nigeria as the state comprises 17 local government areas. In Mgbidi community, there are 13 villages comprising: Ifite Mgbidi, Ogui-Mgbidi, Ezioha Mgbidi, Enugwu-Ife, Ofelite, Eziama-Mgbidi, Uwa-Akpu, Ogwugwu, Isi, Isi-Uga, Ogba, Ududa and Amaoji.
Mgbidi has boundaries with Awgu community, Nkwe, Ezere, Ugwu-eme and Mmaku communities.
Mgbidi has 3 major secondary schools one of which is a technical (state-owned) school, and 9 primary schools. The major sources of livelihood of the people are farming, and petty trade.
In this study, two secondary schools and two primary schools were assessed.
Research instruments/materials
The following research instruments were used for clinical examiner.
• The Snellen’s visual Acuity (VA) chart for distance acuity and Jaeger’s acuity card for near acuity
• Penlight
• Keeler ophthalmoscope
• Occluder for cover and uncover test
• Keeler retinoscope
• Trial lenses and interpupillary distance (IPD) rule
Other material was a video camera to show evidence of research.
Data collection procedure
After taking the case history, Snellen’s visual acuity chart for distance and Jaeger’s acuity card for near was used to measure their visual acuity at 6 metres and 40 centimetres respectively. This was done under normal room illumination with distance visual chart hung on the wall. External examination was done with a penlight and ophthalmoscope for internal or fundal examination, in order to rule out any case of obvious ocular pathology. Children with cognitive problems like autism and traumatic brain injuries were not part of the study.
Refraction was done with the retinoscope objectively under dim illumination with the subjects continually instructed to fixate at far (6 m) of the 6/60 letter of the visual acuity chart at 6 m. The examination was done with the examiner seated in front of the subject at his arm’s length (60 cm) which forms the working distance. This test was done with the examiner’s right hand holding the instrument, viewing the right eye of the patient with his right eye. The power of the lens that neutralizes the retinoscopic reflex of the eye becomes the static retinoscopic finding after subtracting the dioptric power of the working distance (+1.50 D).
The retinoscopic findings were refined subjectively using trial lenses with trial frame to the children’s best corrected visual acuity.
Data presentation and interpretation
Data for the research was obtained from the test on Refractive Errors among school children aged 5 to 15 years in Mgbidi, Agwu L.G.A., Enugu State. A total of four hundred and sixteen subjects (416) were examined, comprising 213 males and 203 females subjects. 131 subjects were emmetropic, 258 were ametropic while 27 subjects fall under the exclusive criteria of having either ocular pathological condition or neurological condition. The subjects had a mean age of 12 ± 2.93 years (Mean ± SD) (Table 1). For the astigmats, their spherical equivalent conversion was used to determine their refractive status.
Table 1 on Age distribution of Refractive Errors, showed that age 12<15 hyperopia was higher in occurrence compared to myopia.
| Age (yrs) | Refractive Error (D) | |||||||||||
|---|---|---|---|---|---|---|---|---|---|---|---|---|
| Myopia | Hyperopia | |||||||||||
| -0.25 <-1.00 | -1.00<-2.00 | -2.00 and above | 0.25<1.00 | 1.00<2.00 | 2.00 and above | |||||||
| N | (%) | N | (%) | n | (%) | n | (%) | n | (%) | n | (%) | |
| 5<8 | 13 | 32.5 | 3 | 16.7 | - | - | 9 | 7.6 | 2 | 33.3 | - | - |
| 8<12 | 8 | 20.0 | 4 | 22.2 | 1 | 20.0 | 19 | 16.1 | 1 | 16.7 | 1 | 100 |
| 12<15 | 18 | 45.0 | 7 | 38.9 | 2 | 40.0 | 61 | 51.7 | 2 | 33.3 | - | - |
| 15 and above | 1 | 2.5 | 4 | 22.2 | 2 | 40.0 | 29 | 24.6 | 1 | 16.7 | - | - |
| Total | 40 | 100 | 18 | 100 | 5 | 100 | 118 | 100 | 6 | 100 | 1 | 100 |
Table 1: Age Distribution of refractive error.
Table 2 on Sex Distribution of Refractive Errors, showed that male subjects had the highest occurrences of Myopia (-0.25<- 1.00 and -1.00<-2.00) while for hyperopia (2.00 and above), male subjects had highest occurrence with 1(100%).
| Gender | Refractive Error (D) | |||||||||||
|---|---|---|---|---|---|---|---|---|---|---|---|---|
| Myopia | Hyperopia | |||||||||||
| -0.25<-1.00 | -1.00<-2.00 | -2.00 and above | 0.25<1.00 | 1.00<2.00 | 2.00 and above | |||||||
| N | (%) | N | (%) | N | (%) | n | (%) | n | (%) | n | (%) | |
| Male | 28 | 70.0 | 10 | 55.6 | - | - | 56 | 47.5 | 3 | 50 | 1 | 100 |
| Female | 12 | 30.0 | 8 | 44.4 | 5 | 100 | 62 | 52.5 | 3 | 50 | - | - |
| Total | 40 | 100 | 18 | 100 | 5 | 100 | 118 | 100 | 6 | 100 | 1 | 100 |
Table 2: Sex Distribution of Refractive Error (D).
In Table 3 on Age Distribution of Anisometropic Difference, showed that at age 12-<15, hyperope of (0.25<1.00) was higher with {61(51.7%), 2(33.3%)} than myopes with {18(45.0%).
| Age (yrs) | Anisometropic Difference (D) | |||||||||||||
|---|---|---|---|---|---|---|---|---|---|---|---|---|---|---|
| Myopia | Hyperopia | Antimetropia | ||||||||||||
| -0.25<-1.00 | -1.00<-2.00 | -2.00 and above | 0.25<1.00 | 1.00<2.00 | 2.00 and above | n | (%) | |||||||
| n | (%) | n | (%) | n | (%) | n | (%) | n | (%) | n | (%) | |||
| 5<8 | 13 | 32.5 | 3 | 16.7 | - | - | 9 | 7.6 | 2 | 33.3 | - | - | - | |
| 8<12 | 8 | 20.0 | 4 | 22.2 | 1 | 20.0 | 19 | 16.1 | 1 | 16.7 | 1 | 100 | - | - |
| 12<15 | 18 | 45.0 | 7 | 38.9 | 2 | 40.0 | 61 | 51.7 | 2 | 33.3 | - | 9 | 69.2 | |
| 15 and above | 1 | 2.5 | 4 | 22.2 | 2 | 40.0 | 29 | 24.6 | 1 | 16.7 | - | 4 | 30.8 | |
| Total | 40 | 100 | 18 | 100 | 5 | 100 | 118 | 100 | 6 | 100 | 1 | 100 | 13 | 100 |
Table 3: Age Distribution of anisometropic difference.
Table 4 on Sex Distribution of Anisometrpic Difference, showed that male subjects had the highest occurrences of myopia (-0.25<-1.00 and -1.00<-2.00) with {28(70.0%) and 10(55.6%)}, while female subjects had highest occurrence of myopia (-2.00%above) with 5(100%). For hyperopia (0.25<1.00) female subjects had highest occurrence with {62(52.5%)}, while for hyperopia (2.00&above), male subjects had highest occurrence with 1(100%)}. For antimetropia, female subjects had higher occurrence with 9(69.2%) than male subjects with 4(30.8%).
| Gender | Anisometropic Difference (D) | |||||||||||||
|---|---|---|---|---|---|---|---|---|---|---|---|---|---|---|
| Myopia | Hyperopia | Antimetropia | ||||||||||||
| -0.25<-1.00 | -1.00<-2.00 | -2.00 and above | 0.25<1.00 | 1.00<2.00 | 2.00 and above | |||||||||
| n | (%) | n | (%) | n | (%) | N | (%) | n | (%) | N | (%) | n | (%) | |
| Males | 28 | 70.0 | 10 | 55.6 | - | - | 56 | 47.5 | 3 | 50.0 | 1 | 100 | 4 | 30.8 |
| Females | 12 | 30.0 | 8 | 44.4 | 5 | 100 | 62 | 52.5 | 3 | 50.0 | - | - | 9 | 69.2 |
| Total | 40 | 100 | 18 | 100 | 5 | 100 | 118 | 100 | 6 | 100 | 1 | 100 | 13 | 100 |
Table 4: Sex Distribution of anisometropic difference.
Statistical data analysis
1) Research hypothesis one
Alternative hypothesis (H1 ): Myopia decreases with Age.
Null hypothesis (H0 ): Myopia does not decrease with Age.
The above research hypotheses were analysed using ANOVA test of significance at P= 0.05 level of significance (Table 5).
| Sum of Squares | Df | Mean Square | F-ratio | F-tab | |
|---|---|---|---|---|---|
| Between groups | 70.25 | 3 | 23.42 | 0.73 | 4.07 |
| Within groups | 256 | 8 | 32 | ||
| Total | 326.25 | 11 |
Table 5: ANOVA for research hypothesis one.
Decision rule: Reject (H0 ), if F-ratio is greater than F-tab and accept (H1 ), otherwise accept (H0 ).
Conclusion: Since F-ratio (0.73) is less than F-tab (4.07), we therefore accept (H-0 ) conclude that Myopia does not decrease with Age.
2) Research hypothesis two
Alternative hypothesis (H1 ): Hyperopia increase with Age.
Null hypothesis (H0 ): Hyperopia does not increase with Age.
The above research hypotheses were analysed using ANOVA test of significance at P= 0.05 level of significance (Table 6).
| Sum of Squares | Df | Mean Square | F-ratio | F-tab | |
|---|---|---|---|---|---|
| Between groups | 508.25 | 3 | 169.42 | 0.42 | 4.07 |
| Within groups | 3204.67 | 8 | 400.58 | ||
| Total | 3712.92 | 11 |
Table 6: ANOVA for Research Hypothesis Two.
Decision rule: Reject (H0 ), if F-ratio is greater than F –tab and accept (H1 ), otherwise accept (H0 ).
Conclusion: Since F-ratio (0.42) is less than F-tab (4.07), we therefore accept (H0 ) conclude that Hyperopia does not increase with Age.
3) Research hypothesis three
Alternative Hypothesis (H1 ): Myopia occurs equally in females and in males.
Null Hypothesis (H0 ): Myopia does not occur equally in females and in males (Table 7).
| Gender | Myopia | Mean |
Variance |
||
|---|---|---|---|---|---|
| -0.25<-1.00 | -1.00<-2.00 | -2.00 and above | |||
| Males | 28 | 10 | 0 | 12.67 | 11.59 |
| Females | 12 | 8 | 5 | 3.51 | 2.87 |
Table 7: Mean and variance table for research hypothesis three.
The above research hypotheses were analysed using Z-test statistic to test for the difference between the occurrence of Myopia in Male and Female subjects.
stating the Z-test statistic: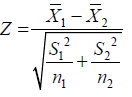
Where;
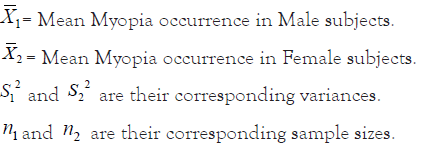
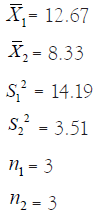
Z-calculated value= 1.79
Decision Rule: Reject (H0), if Z-calculated value does not lie within +1.96 and -1.96, otherwise accept (H0) and conclude.
Conclusion: Since Z-calculated value (1.79) lies within +1.96 and -1.96, we therefore accept (H0) and conclude that Myopia does not occur equally in females and in males.
4) Research hypothesis four
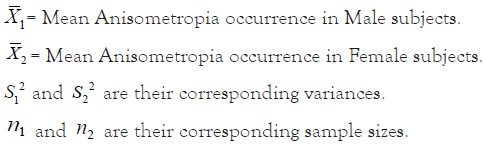
Alternative hypothesis (H1 ): Anisometropia occurs equally in females and in males.
Null hypothesis (H0 ): Anisometropia does not occur equally in females and in males.
The above research hypotheses were analysed using Z-test statistic to test for the difference between the occurrence of Anisometropia in Male and Female subjects (Table 8).
| Gender | Anisometropic Difference (D) | Mean |
Variance |
||||||
|---|---|---|---|---|---|---|---|---|---|
| Myopia | Hyperopia | Antimetropia | |||||||
| -0.25<-1.00 | -1.00<-2.00 | -2.00 and above | 0.25<1.00 | 1.00<2.00 | 2.00 and above | ||||
| Males | 28 | 10 | 0 | 56 | 3 | 1 | 4 | 14.57 | 19.12 |
| Females | 12 | 8 | 5 | 62 | 3 | 0 | 9 | 14.14 | 19.88 |
Table 8: Mean and variance table for research hypothesis four.
stating the Z-test statistic: 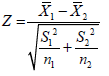
Where;
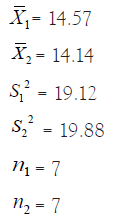
Z-calculated value= 0.18
Decision rule: Reject (H0), if Z-calculated value does not lie within +1.96 and -1.96, otherwise accept (H0) and conclude.
Conclusion: Since Z-calculated value (0.18) lies within +1.96 and -1.96, we therefore accept (H0) and conclude that Anisometropia does not occur equally in females and in males.
5) Research hypothesis five
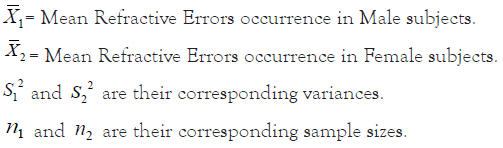
Alternative hypothesis (H1 ): Refractive Errors occur equally in males and in females.
Null hypothesis (H0 ): Refractive Errors do not occur equally in males and in females.
The above research hypotheses were analysed using Z-test statistic to test for the difference between the occurrence of Refractive Errors in Male and Female subjects (Table 9).
| Gender | Refractive Error (D) | Mean |
Variance |
|||||
|---|---|---|---|---|---|---|---|---|
| Myopia | Hyperopia | |||||||
| -0.25<-1.00 | -1.00<-2.00 | -2.00 and above | 0.25<1.00 | 1.00<2.00 | 2.00 and above | |||
| Males | 28 | 10 | 0 | 56 | 3 | 1 | 16.33 | 20.12 |
| Females | 12 | 8 | 5 | 62 | 3 | 0 | 15.00 | 21.35 |
Table 9: Mean and variance table for research hypothesis five.
stating the Z-test statistic: 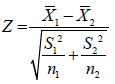
Where;
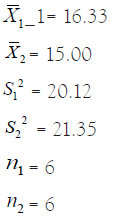
Z-calculated value= 11.91
Decision rule: Reject (H0), if Z-calculated value does not lie within +1.96 and -1.96, otherwise accept (H0) and conclude.
Conclusion: Since Z-calculated value (11.91) does not lie within +1.96 and -1.96, we therefore accept (H1 ): and conclude that Refractive errors occur equally in males and in females.
The purpose of this study was to generate data on the pattern of distribution of refractive errors among school children in Mgbidi community, of Awgu Local Government Area of Enugu State, Nigeria. Virtually every human at one state or the other in life had refractive error which could be as a result of normal anatomic and physiologic process or as a result of malformation of the refractive media or other external causes. This statement is in accord with Arnold [11] who stated that at birth, refractive errors are normally distributed. Refractive errors are among the leading causes of avoidable visual impairment or blindness worldwide and are responsible for higher rates of low vision and blindness in certain areas.
School children are considered a higher risk group because uncorrected refractive errors can seriously affect their academic learning and performances including their physical, social, environmental and mental development [12]. From the results of this study, it shows that age has a significant influence on the distribution of refractive error.
In Table 1, subjects aged 12-15 had the highest occurrences of myopia with 18 (45.0%), 7 (38.9%), 2 (40%). This supports the work of Anera [13] who confirmed that age has influence on the distribution of refractive error. He carried out work on age distribution of refractive error of school children in Morocco. However it was reported that hyperopia is the most prevalent refractive error and that age is the most important and demographic factor associated with different types of refractive errors [13].
From this analysis, it showed that hyperopia decreases with age. This supported the work of Duke-Elder [14] and Borish [6] who maintained that most, if not all children are born hyperopic and that this hyperopic status decreases with increase in age.
Table 2 shows that male subjects had the highest occurrences of myopic in total, while female subjects had the highest occurrence of hyperopia. This relates to the work of Czepita et al. [15], who reported the role of gender in the occurrence of refractive errors.
In the Table 3, it shows that on the age distribution of anisometropic differences, children between the ages of 12–15 had occurrences of myopia with 18 (45.0%), 7 (38.9%), and 2 (40.0%). This also shows strong evidence that hyperopia is the major cause in the increment of anisometropia in children within the same ages of 12–15 [16]. The anisometropic differences of 0.25<1.00 and 1<2.00 were 61 (51.7%), and 2 (33.3%) respectively. Hyperopia was higher in this age bracket. This is similar to the findings of Shih et al.16 on the prevalence of anisometropic difference in Taiwanese children. However, he further stated that myopia is responsible for the slight increase in anisometropia.
Furthermore, Table 3 agrees with more recent reports by Ostadimoghaddam [17], who carried out work on the anisometropic difference on 2947 participating school children, and showed that the prevalence of anisometropia is higher at older age.
Table 4 on sex distribution of anisometropic difference, showed that male subjects had the highest occurrences of myopia with anisometropic difference ranging from -0.25<-1.00 D and -1.00<- 2.00 D with occurrence (28 (70.0%) and 10 (55.6%)). This is in contrast to the findings of Weale [18] on gender distribution of anisometropia and concluded that there is a predominance of antimetropia, female subjects had higher occurrence with 9 (69.2%) than male subjects with 4 (30.8%).
Most children have refractive errors which might have lasted for a long period of time without the knowledge of both the students, the teacher, the guardians or parents. Presence of visual screening exercises and/or primary eye care practitioners in communities such as this would not only detect and manage refractive errors but also other ocular pathologies and oculo-visual conditions [18].
I. There is a need to incorporate visual screening into the admission process in schools. This is not to deter the student from gaining an admission into school, but to ensure that every pupil/student with refractive errors is corrected. According to Toledo et al. [19], poor visual acuity seems to be associated with poor academic performance. This will also help parents and guardian identify potential causes of their kid’s poor academic performance.
II. Government should include primary eye care as one of the components of primary healthcare system especially in the rural areas, making it accessible by the rural dwellers. This will ensure regular and affordable eye care services as rural dwellers often travel to often far cities for eye care.
III. Eye care practitioners (especially optometrists) should intensify their efforts in creating awareness especially through public eye health education on the effects of refractive errors. This should include demystifying the many wrong notions believed my many about wearing corrective lenses at infancy and adolescence age.
IV. Knowledge and education on proper reading and learning environment should be impacted on school owners and administrators, such as proper illumination, contrast, type of colour paint used in painting the class rooms, level of seats to the visual axes of the students, ventilation.
V. Finally, it is recommended that the influences of environmental, ocular pathological and neurological conditions on the distribution of refractive errors be assessed properly.
From this study, it shows that hyperopia tends to occur more than myopia in children within the ages of 5-15 years; this may be due to the less near-task activities of the children in this community (Mgbidi).
We observed gender discrimination in the distribution of refractive error with myopia occurring more in males while hyperopia occured more in females.
Citation: Chikezie IG, Uche E, Freeman I, Udo UA (2021) Distribution of Refractive Errors Among School Children Aged 5 to 15 Years in MGBIDI, AWGU L.G.A., Enugu State, Nigeria. J Clin Exp Ophthalmol. 12:889.
Received: 16-Sep-2021 Accepted: 30-Sep-2021 Published: 07-Oct-2021 , DOI: 10.35248/2155-9570.21.12.889
Copyright: © 2021 Chikezie IG, et al. This is an open-access article distributed under the terms of the Creative Commons Attribution License, which permits unrestricted use, distribution, and reproduction in any medium, provided the original author and source are credited.