Journal of Phonetics & Audiology
Open Access
ISSN: 2471-9455
ISSN: 2471-9455
Research Article - (2023)Volume 9, Issue 2
The development of a quick Speech - in - Noise test, based con Quick SIN, in the Rio de la Plata variant of Spanish is shown, for the measurement of the signal-to-noise ratio. The result was the generation of 8 lists, each of them with 6 sentences, containing 5 keywords that are counted as responses. In the tracks of each list, the phrases are mixed with noise (four-talkers babble with three female speakers and one male) so that each phrase has a signal to noise ratio decreasing, in steps of 5 dB. Three preliminary tests were carried out to select the material to be included in the lists. The first two trials served to select the sentences which are more appropriate to be part of the test while the third test was used to select the best conformation of the lists. The first experiment evaluated the results of the 8 final lists with low pass filtering at 750 Hz, 1400Hz and without filter in normal hearing subjects. The second experiment evaluated the homogeneity of the results of the different lists in groups of normal hearing people and subjects with different levels of hearing impairment.
Speech-in-noise; Intelligibility in noise; Speech audiometry; Spanish speech-in-noise test
Among of the most frequently referred problems by people with any degree of hearing loss is the difficulty of speech understanding when background noise is present. Even in people with normal audiograms, difficulties are reported to listen speech in complex environments. The use of hearing aids is not always effective in the task of improving efficiency in these poor listening conditions. Auditory discrimination evaluated through tests in quiet environments do not provide useful predictions about the performance of subjects in more demanding and daily life representative situations. Much work has been published that realize the importance of assessing the ability to discriminate speech in the presence of noise. Taylor (2003) points out that the diagnosis of the loss in speech to noise ratio (SNR) [1], brings the tool of determining the audibility in noise with and without hearing aid in free field, quantitatively accessing the benefit of the application of directional microphones. The deeper study of the consequences of hearing loss necessary to address issues that have had increasing interest in recent years (cochlear dead regions and cochlear synaptopathy) also requires methods to quantify word recognition in noisy environments. Speech-in-Noise tests should be part of any hearing aid evaluation and diagnostic audiometry process to document and objectify the most frequent complaint of people with hearing loss, whether or not they are hearing aid users [2].
In English, a great number of tests have been developed where, under different conditions, evaluate the ability to recognize speech in presence of noise. As an example we can mention, among others, the SIN test, the Quick SIN [3], the Bamford - Kowal-Bench Speech-in-Noise Test (BKB-SIN; EtymÃÂ?ÂÂtic Research, 2005; J. Bench, A. Kowal, & J. Bamford, 1979; P. Niquette et al., 2003), Words-in- Noise test (WIN;RH Wilson, 2003; RH Wilson & CA Burks, 2005), and HINT, Hearing in noise Test (Nilsson, Soli, Sullivan, 1993). The first four tests use a multi-talker babble as competing noise and are based on a modified constant stimulus method, the others uses speech spectrally shaped noise and an adaptive psychophysical method (Wilson, McArdle, Smith, 2007). In Spanish, the Latin American Spanish Hearing in Noise Test [4] and the Castillian Spanish Hearing in Noise Test (Huarte, 2008) based on the American English HINT and the Spanish Speech Perception in Noise Test have been presented (SPIN) (Cervera and Gonzalez Alvarez).
It is convenient to obtain a number to show the ability to recognize speech in background noise referred to a population defined as normal. Of all of the methods cited, QuickSIN [3] is especially attractive, because it allows a very rapid evaluation of this ability and is suitable for people with normal hearing and patients with hearing loss. Thus, the test introduced in this work is based on the QuickSIN. Among the known background in languages other than English, the Mandarin version of QuickSIN, the M-Quick SIN [5] can be mentioned. The need to have a reliable tool to be used with Rioplatense Spanish people * motivated the present development, which can help, among other things, in the choice of a certain technology in prosthetic equipment (a person with severe speech discrimination disorders may require superior technology in terms of directionality). It can also contribute to the evaluation of the possible benefit of amplification, helping to lower exaggerated expectations by the patient. Together with other studies, the measurement of SNR loss can provide useful information when synaptopathy or cochlear dead regions are suspected, helping to find possible strategies to mitigate the effects of the loss through the use of hearing aids. In short, it is a tool that provides data about the ability of the patient in difficult situations, which is not revealed by pure-tone or a speech in quiet audiometry. “Rioplatense” Spanish: Variant of the Spanish language spoken in the area of the Rio de la Plata (Argentina and Uruguay) [6].
The basic conditions that this test must have are a degree of reliability suitable for clinical purposes, simple and rapid administration and interpretation of results and effectiveness to be applied in people with different degrees of hearing loss including normal hearing.
Noise (babble)
In the development of any speech-in-noise test, one of the first decisions to be taken, is regarding the material to be used, both as a “speech signal” (which the subject under test must identify), as the interfering noise. The choice of the latter, the noise, offers several alternatives, among others, white or pink noise, speechshaped noise, multi-talker babble. Multi-talker babble is the interfering noise chosen by many of the tests, in particular the QuickSIN, since it reproduces a usually difficult situation for people with hearing loss and normal hearing: a meeting where it is difficult to receive the message of interest due to the competition of other speakers. The choice of this type of noise represents a major challenge compared to a steady noise. In this case, the fluctuations of the multi-talker babble cause the instantaneous value of the interfering signal to change permanently, requiring special care in "temporarily anchoring" the sentences intended to work as a signal with its interfering noise to maintain the signal-to-noise ratio controlled. A babble noise was chosen, generating recordings of four speakers, three female and one male, who read continuously and asynchronously different texts individually, which were then mixed to obtain the babble track. The reading was indicated to the speakers in a "natural" way, with limited expressiveness and a constant speech rate. Previously to the mixing of the 4 speakers tracks,pauses longer than 10 milliseconds were erased. The recording was made with an Audiotechnica® model T 2021 microphone and a Komplete Audio 6 audio board. A 2-minute track was generated. Processing of the audio signal was carried out with the Goldwave® audio editing software. The resulting noise turns out to be Type II, according to the classification [7].since it comes from the direct mixing of the 4 individual signals. According to these authors, the intelligibility rate of this noise is higher than the expected using other alternatives, being for this type of the order of 7%, against 3% for a type III. The choice of Type II interfering noise is due to create a more challenging condition in the presented task.
Speech signal
The choice of the stimulus has also several alternatives: phonemes, mono or poly-syllabic words or phrases. Each of these has their own characteristics, advantages and disadvantages. Phonemes or isolated words do not adequately represent the reality of continuous speech as the phrases do, although the recognition of the phrases implies the effect of variables related to short-term memory, cognitive and cultural aspects. Therefore, there is no definitive criterion in this regard [8]. In this case, we choose to follow the QuickSIN guidelines, prioritizing the representation of more real situations in everyday life through phrases. The phrases were taken from Corpus Sharvard [9]. They have the basic conditions necessary for this project: modern Spanish language and five significant words per sentence. The available recordings of this corpus are not useful for our work because they are recorded by Spanish native people, The material was recorded by an argentine speaker entirely in the Rio de la Plata variety of Spanish. The speaker was a female argentine speech therapist, from the city of Buenos Aires, who was instructed to read the sentences in a natural way, ensuring uniformity in the speech rate (elocution rate) and avoiding intentionally facilitating or hindering intelligibility.
Compliance with these instructions was monitored during recording, without making accurate measurements. The goal was to obtain a representative and real recording, neither excessively clear nor very difficult and the choice of a young speech therapist and with fewer years of working experience had to do with minimizing typical intonations of professionals accustomed to evaluating live auditory function. Level Differences within the sentences, inherent in any natural speech sequence were controlled at the generation of the material, but considering the multiple aspects to be controlled in this process, this will ultimately lead to a certain average performance of the material to be tested. The resulting SNR depends on both speech level and background noise. As both fluctuate permanently it was decided to generate the material and perform the intelligibility tests at various SNR values by subsequently evaluating the behavior of the lists in real situations. The resulting intelligibility in the experiments depends not only on the SNR but also on the inherent ease of each phrase where aspects related to the context take place. The recording of the material was made in AB studios, in Buenos Aires, with the following equipment: Neumann U67 microphone, Tascam M320 console. The process was carried out with the Sound Forge Pro11 software.
The phrases were then submitted to a selection committee, with several criteria for discarding, including the use of out of date or unusual words in our daily lives. Other exclusion criteria were excessive or very little context information. Phrases where reading was hesitant or with poor pronunciation were also discarded and only sentences where the last letter is a vowel were included. As the goal was to generate a set of 10 lists, and to expedite the various verifications to be carried out, a total of 88 sentences to be included in the first essay were separated from the original recorded material.
Preparatory trials
For the generation of the material, a group of 24 normal hearing subjects (14 female, 10 male, aged between 18 and 42 years (average age = 26.6) divided into three subgroups with equal number of members was formed. To the first group a first version of the speech and noise mix was presented. To the second subgroup a corrected version was presented, while the third subgroup was presented with versions of the set processed with low pass filter to reduce the amount of audible cues to evaluate the results under different audibility conditions.
Test No. 1
The objective of the first test was to measure the intelligibility of the selected phrases under various signal to noise ratio (SNR) conditions. Based on this measurement, the SNR50 was determined, defined as the signal-to-noise ratio value needed to obtain a 50% recognition of the significant words found in the sentences.
Method
Subjects
Eight adult subjects (equal number of men and women) aged between 18 and 42 years (average of 29 years) and hearing thresholds between 250 and 8000 Hz better at 20 dBHL.
Stimuli
The 88 recorded phrases taken from the Sharvard corpus were copied on channel A of an audio track. In channel B the four talker babble was recorded. Previous studies in the Sharvard phrases (Aubanel) indicate the average SNR values for a 50% recognition of significant words in -6.07 dB and -6.24 dB for male and female speakers,respectively. Three tracks were then generated with the following SNR values -8dB, -5dB and -2 dB.
Presentation of the stimuli and response scoring
The speech material (Channel A) was emitted through Channel 1 of an Astera clinical audiometer (Otometrics A / S), while the babble (Channel B) was emitted through channel 2. Both channels were presented binaurally through of Senheiser HDA 2000 headphones. The set was calibrated in accordance with ANSI / ASA S3.7-2016. The presentation was made in an acoustically treated room. Previously, a calibration track was used to adjust the levels of both channels in the audiometer level meter. The presentation of the stimuli had a minimum interval of 2 hours between the administration of the first track (-8 dB SNR) and the second (-5 dB SNR) to prevent possible memorization effects and also to prevent a decrease in performance due to fatigue issues or lack of attention. For the same reasons, a minimum interval of 24 hours was left between the second and third tracks (-2 dB SNR). The lists were presented so that the speech channel was 60 dBHL, or at a level indicated by the subject as "comfortable." Prior to the beginning of the test, each subject was presented with a list of test phrases, with different SNRs to familiarize themselves with the voice of the phrases (stimulus).
After the presentation of each sentence, the experimenter paused to enable the subject's response. From the subject answer each of the significant words correctly repeated was counted as one point and a half point was assigned to answers where the error is of minor importance, for example, change of plural by singular (“pajaro” -bird- instead of “pajaros”-birds-) or gender ( “rica” for “rico”) as long as they imply minor differences and do not change the meaning of the sentence.
Results and Discussion
The average of the scores obtained in all the sentences throughout the sample of subjects had the following values: 1.3 words for -8 dB SNR; 2.6 words for -5 dB SNR and 4.1 words for -2 dB SNR. Table 1 shows the discrimination D as a fraction of the total (1 = 100%), together with the standard deviation for each condition.
| SNR(dB) | D | SD |
|---|---|---|
| -8 | 0,26 | 0,3 |
| -5 | 0,53 | 0,3 |
| -2 | 0,82 | 0,2 |
Table 1: Average discrimination as a fraction of the total (D) and standard deviation (SD) for the 88 sentences.
The big dispersion between the values obtained for the different phrases at the same SNR conditions has to do with several motifs, the peaks and valleys characteristic of the speech and babble waveform and the inherent difficulty of each of the phrases are the more obvious reasons, although it can also be mentioned that the sample size is small. In any case, the decisions that derive from these previous tests are not definitive since at the most they would limit the set of usable phrases in the later stages, but they do not accept any component in a definitive way, that is, conclusive decisions are not taken regarding the conformation of the lists that will be generated.
For calculating the value corresponding to 50% detection for each of the sentences, the adjustment of these psychometric curves was performed by means of a logistic function given by the equation:
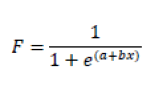
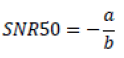
Where F is the value that the function takes (the % of correctly identified words divided by 100), x is the signal-to-noise ratio (SNR) and the constants a and b are the parameters of the adjustment curve and are related, as we will see, with the slope and the SNR50 value, the logistic function has been chosen since it is considered a reasonably good model of the sigmoid for psychometric data and has been used in numerous works (5,10, 11). Indeed, as we set the threshold when the detection percentage is 50%, this means that F takes the value 0.5. Replacing in the previous formula:
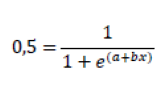
Thus,
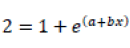
This Means,
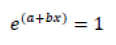
As we said, when F = 0.5 we are in the case where x is the SNR50 value, therefore:
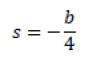
To find the slope we find the derivative of the logistic function corresponding to the value of SNR50, this gives a value for the slope:
The coefficients a and b of the logistic function were obtained using the Solver function of Excel® (Microsoft, 2011), which uses a non-linear method of least squares. The corresponding SNR50 value was obtained for the average discrimination values of each sentence. Subsequently, the sentences for which the following conditions were met were discarded:
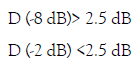
A set of 53 sentences was achieved and 12 additional phrases were separated, which did not meet the criteria due to a small difference, reserving them for use as training tracks. For the main set an average SNR50 of -5 dB (SD = 1.73) was calculated. The next step consisted of adjusting the SNR values, in other words, modifying the level of the babble anchored to each of the phrases to ensure that they all come as close as possible to the average of SNR50. If the SNR50 value obtained is smaller by a certain amount of dB, that means that the phrase is heard "better than average." This implies that we must "make it worse" by adding in this case as many dB to the noise as that difference. A correction value is then calculated for each phrase that will be added or subtracted from the effective value of the accompanying babble of each phrase. This gives rise to the material used in test Nº2. It is important to note here that the adjustment is made by modifying the babble levels as necessary for each sentence, but without temporarily displacing or otherwise altering the original babble: only the levels are altered. The "temporary anchor" between speech and its babble remains unchanged.
Test Nº2
The goal of the second test was to verify the value of SNR50 for the set of lists selected and corrected after the first trial. For this purpose, what was done using the lists adjusted in their SNR value was repeated with another group of listeners.
Method
Subjects
Eight adult subjects (five female and three male different from those used in the previous test) with ages between 18 and 27 years average 24.5 years) and hearing thresholds between 250 and 8000 Hz better at 20 dBHL.
Stimuli
The 53 recorded phrases selected in the previous test were copied to channel A of an audio track. In the B channel of the same stereo track, the babble of the previous trial was copied with the values corrected in the same experiment. From this material, three tracks with values of SNR -8dB,-5dB and -2 dB were generated.
Presentation of the stimuli and response scoring
The speech material was presented through Channel 1 of an Astera model audiometer (Otometrics A / S), while the babble was presented through channel 2.
Both channels were presented binaurally through Senheiser HDA2000 headphones, calibrated according to ANSI standards. The presentation was made in an acoustically treated room.
The same protocol was observed as in the previous trial, in terms of test administration, counting of results, interval between tests, etc.
Results and Discussion
The average of the scores obtained in all the sentences throughout the group of subjects had the following values: 0.78 words for -8 dB SNR; 2.8 words for -5 dB SNR and 4.41 words for -2 dB SNR.
Table 2 shows the discrimination D as a fraction of the total (1 = 100%), together with the standard deviation for each condition.
| SNR(dB) | D | SD |
|---|---|---|
| -8 | 0,16 | 0,14 |
| -5 | 0,57 | 0,15 |
| -2 | 0,88 | 0,10 |
Table 2: Average discrimination as a fraction of the total (D) and standard deviation (SD) for test 2.
The adjustment of the 53 curves using the logistic function resulted in SNR values whose average was -5.4 dB (SD = 0.81 dB). The average slope of the psychometric curves was 0.21 (SD = 0.14). This material was the basis of trial 3, through which the possible effects of hearing loss on the test results were evaluated.
Test Nº 3
This test purpose is to evaluate the behavior of the selected material for different ranges of SNR loss, in order to select the phrases that have the best performance for the definitive test and for each SNR level.
To have a first approximation about the expected result of the test to be performed in patients with hearing loss, Killion propose to simulate SNR losses by passing the recorded material by different low pass filters.In this way, audible cues that are used for word discrimination are suppressed [3].
Killion's rationale for evaluating the residual discrimination ability of subjects after filtering is based on the application of his Count the Dots Method for the calculation of what was then known as Articulation Index, AI, [12,13].
Nowadays known as SII (Speech Intelligibility Index). Filtering the signal and the noise that joins it with a low pass filter with a very pronounced roll-off, that is, a very steep slope, will remove a certain number of audible cues from the signal and will bring a loss in the SNR.
Method
Subjects
Eight adult subjects (five female and three males, different from those who performed the previous tests) with ages between 18 and 37 years (average of 26.4 years) and hearing thresholds between 250 and 8000 Hz better than 20 dBHL.
Stimuli
The same material from test 2 was processed with low pass filters with cutoff frequencies of 850 Hz and 1400 Hz with a slope of 100 dB / oct. The presentation level was adjusted to compensate for the loss of loudness derived from the filtering. Taking into account the expected SNR value, recordings with SNR were generated of +7 dB; +12 dB and +17 dB for the 850 Hz filter and -3 dB; +2 dB and +7 dB for the 1400 Hz filter.
Presentation of the stimuli and response scoring
The presentation of the material was carried out under the same conditions as the two previous tests. The same protocol as in trial 1 was followed, regarding the way the test was performed, in terms of count of results, interval between tests, etc.
Results
The average SNR50 value for all phrases filtered at 1400 Hz was +1.73 dB (SD = 3.66 dB). The observed dispersion is appreciable given that the filtering affects sentences in different ways. Some words, and consequently, some sentences are more sensitive to filtering. This filtering condition (1.4 KHz) and the 850 Hz cutoff frequency were used to select the phrases that will occupy the different places in the final lists. For each SNR value the mean of results for all sentences and all subjects is given in Table 3.
| FILTER AT 1400 Hz | FILTER AT 850 Hz | ||||
|---|---|---|---|---|---|
| SNR | D | SD | SNR | D | SD |
| -3 | 0,26 | 0,2 | 7 | 0,29 | 1,33 |
| 2 | 0,46 | 0,25 | 12 | 0,33 | 1,05 |
| 7 | 0,83 | 0,17 | 17 | 0,39 | 1,1 |
Table 3: Discrimination (D) and mean standard deviation (SD) of the phrases for the different SNR values under low-pass filtering conditions at 1400 Hz and 850 Hz.
Choosing the order of the phrases in the lists
Based on the results of Test 3, the sentences with the most homogeneous responses in the different SNR conditions were ordered. The combinations of speech and babble influence in such a way that makes intelligibility difficult to predict. If we add to this fact the loss of audibility derived from the filtering it is convenient to choose an ordering of sentences and SNR in the presentation that produces homogeneous results for each phrase throughout the sample. Eight lists of 6 sentences each were assembled, with decreasing SNRs in steps of 5 dB, starting with an SNR value of +17 dB. This is the basis for Experiment 1.
Experiment 1
The goal of this experiment is to evaluate the results of the 8 lists resulting from the preparatory tests in three audibility conditions, low pass filtering the material at different cutoff frequencies.
Method
Subjects
A total of 58 students of Audiology from Universidad del Museo Social Argentino in Buenos Aires, from the Psychoacoustics course was divided into two groups (A and B) and were tested with lists 1 to 4 and 5 to 8 respectively, with three conditions of filtering detailed in the next paragraph. The same students recognized and scored the test to their peers in such a way that a group that was a test subject with lists from 1 to 4 played the experimenter role in lists 5 to 8. The students who participated in the test were previously trained in the scoring method and were constantly accompanied and supervised by some of the authors during all the trials to limit the need to carry out specific tests of agreement between judges. The data of sets A and B are as follows:
GROUP A: N = 29 members (1 male, 28 female). Average age: 30.4 years, with ages between 21 and 52 years.
GROUP B: N = 29 members (3 male, 26 female). Average age: 30.2 years, with ages between 21 and 49 years.
Members of both groups were tested for normal hearing.
Stimuli
The lists with the most restrictive low-pass filtering condition were presented first (fc = 750 Hz, slope = 100 dB / Oct). After at least one week, the second low-pass filtering condition was presented (fc = 1400 Hz, slope = 100 dB / oct). After a minimum time-interval of two weeks, the unfiltered condition was tested. The aim was to minimize the memory effects of some sentences, this was facilitated by the fact of starting with the most restrictive situation in terms of filtering, that is, less discriminability. The stimulus presentation was performed monaurally, using an Interacoustics® audiometer, model AD229 in both cases equipped with Telephonics TDH39 headphones, all calibrated according to the ANSI / ASA S3.7-2016 standard, in a sound-damped cabin. The evaluation with the eight lists was preceded by the presentation of two training lists, so that the subject becomes familiar with the test and with the timbre of the voice to be identified. Before this, the instructions are specified, like those suggested by Killion (2001) in the QuickSIN manual [15].
Application of the Tillman-Olsen (1973) method for the determination of SNR50
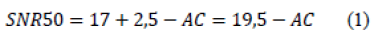
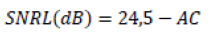
We are interested in determining the value of SNR50. This is the SNR value required for understand 50% of the words in sentences. According to Killion and Christensen (1998), understanding 50% of words in sentences is equivalent to 90% understanding of the meaning of complete sentences. The method used in Quick SIN is based on the recommendation of Tillman and Olsen [15], to obtain an estimate of SNR50 easily and quickly. This procedure has its roots in the Spearman- Kärber equation [16]. The equation that gives the value of SNR50 is:
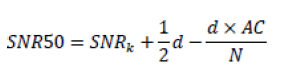
Where SNR50 is the searched threshold value, the level of SNR required for the identification of 50% of the words in phrases in the list, SNRk is the initial value of the stimulus (the highest signal-to-noise ratio presented, which is adopted in 17 dB), d is the interval between the signal to noise ratios presented, in our case 5 dB, AC is the number of correct answers (hits) and N the number of words presented by each SNR level (5 words per level). Thus:
a. SNR50 values for the eight proposed lists, in the 3 filtering conditions
Figure 1 shows the average of the SNR50 results for the two sets of 29 subjects (95% CI for the mean).

Figure 1: Average of the results for both groups in the 3 filtering conditions (95% CI).
Data were verified to have an approximately normal distribution. When performing the two-way ANOVA test to assess the homogeneity of the mean values for different levels of filtering, at both sites of the experiment (p <0.05). Statistically significant differences were found between the lists.
Table 4 shows a comparison of the averages obtained in the three filtering conditions with the data obtained by Killion et al (2004) can be seen in Table 4 [3].
| CABA | KILLION ET AL. | |||
|---|---|---|---|---|
| SNR50 | SNRD | SNR50 | SNRD | |
| 750 Hz | 13,46 | 17,88 | 22,3 | 20,4 |
| 1400 Hz | 4,93 | 9,35 | 10,5 | 8,6 |
| SIN FILTRO | -4,42 | 0 | 1,9 | 0 |
Table 4: SNR50 for different filtering conditions in the CABA and SANTA FE groups are shown. The SNRD columns show the differences with the non-filtered condition.
Differences between the averages for the two filter conditions with the non-filtered condition is shown in the SNRD column of the table. The average SNR50 value of the lists in the three conditions is in the range of ± 2.6 dB, from the global average for each condition.
b. Psychometric curves
Figure 2 shows the psychometric functions (average for the 8 lists) for the 6 sentences of each list, for each filtering condition, which correspond to levels +17; +12: +7; +2; -3 and -8 dB SNR, plotted in reverse order of presentation. AC means words repeated correctly.

Figure 2: Average psychometric curves for the different SNR under 3 filtering conditions. (95% CI).
Experiment 2
The goal of this experiment is to evaluate the use of the created lists in subjects with normal hearing and hearing loss. Despite having results for hearing subjects through experiment 1, these were obtained with different filters to evaluate the lists in conditions of reduced audibility. In this case the material is presented to a different group of subjects one time, in the unfiltered version.
Subjects
The unfiltered created material (eight lists) were presented to 27 subjects (16 female and 11 male) with normal hearing and no otological history (mean 38.6 years old, = ) and 45 subjects with hearing loss. (average age: 66.7 years, =16,13) with the same number of males and females. The inclusion criteria for this last group was to have pure tone audiogram with air thresholds in the range of 20 and 80 dB HL between 500 Hz and 2000 Hz and a air-bone gap less than or equal to 10 dB. The subjects mean audiogram is shown in Figure 3, along with the SD values for thresholds. Both the hearing losses and the ages of the participants (between 30 and 93 years) were accepted with a significant range so that the presentation of the test could be tested under various conditions.

Figure 3: Mean thresholds for hearing impaired subjects included in Experiment 2. Vertical bars are SD values.
People with evidence of cognitive or working memory disorders were discarded, due to the influence of in the results, beyond the auditory factor. All the subjects agreed to be included in the test.
Stimuli
The eight lists were presented through clinical audiometers. (In the different locations where the experiment was carried out (Buenos Aires City and Santa Fe City), Interacoustics brand audiometers, AD28 and AC33 models were used, both with Telephonics THD39 headphones and an Otometrics brand Astera audiometer with Senheiser HDA2000 headphones, calibrated according to ANSI / ASA standard S3.7-2016.
In Buenos Aires, the test was carried out in a sound booth, while in Santa Fe there was a sound-damped room.
The presentation of the stimuli was binaural for symmetrical and monaural losses with the stimulus applied to the ear with the best performance in pure tone audiometry, in case of nonsymmetrical losses. SNR50 and SNRL values were found, as in Experiment 1, using the Tillman-Olsen formula.
Results
a. Normal hearing
The SNR50 value for the normal hearing subjects tested with all the lists can be seen in Figure 4 and Table 5. It was verified that the distribution of the results turned out to be approximately normal. For statistical data processing, Minitab 19 software was used.
| LIST | N | Mean | SD | 95% IC |
|---|---|---|---|---|
| 1 | 27 | -4.796 | 1.361 | (-5.468, -4.125) |
| 2 | 27 | -4.352 | 2.429 | (-5.023, -3.680) |
| 3 | 27 | -5.315 | 1.353 | (-5.986, -4.643) |
| 4 | 27 | -5.296 | 1.533 | (-5.968, -4.625) |
| 5 | 27 | -4.444 | 2.22 | (-5.116, -3.773) |
| 6 | 27 | -4.63 | 2.017 | (-5.301, -3.958) |
| 7 | 27 | -5.407 | 1.721 | (-6.079, -4.736) |
| 8 | 27 | -4.833 | 1.083 | (-5.505, -4.162) |
Table 5: Mean values for normal hearing.

Figure 4: SNR50 for the subjects with normal hearing from Experiment 2 for the 8 lists n = 27 (CI = 95%).
Grouped Standard Deviation = 1.77011
The ANOVA analysis of variance for the material did not show statistically significant differences between the 8 lists (p <0.05).
ANOVA SNR50
As seen F (7,182) = 1.80, p> 0.05. This shows of an acceptable degree of homogeneity of the lists, within the conditions proposed for the work Table 6.
| GL | SC | MC | F | P | |
|---|---|---|---|---|---|
| LIST | 7 | 31.88 | 4.555 | 1.8 | 0.089 |
| SUBJECT | 26 | 192.36 | 7.398 | 2.93 | 0 |
| Error | 182 | 459.37 | 2.524 | ||
| Total | 215 | 683.61 |
Table 6: ANOVA SNR5.
The average SNR50 value for the group of normal listeners is -4.88 dB.
b. Subjects with hearing loss
Grouped Standard Deviation = 4.76865
Mean SNR50 value for the group was + 4.99 dB, with a greater dispersion in the results when compared with the group of listeners (the pooled standard deviation is 4.76 dB against 1.77 dB for the listening group), This can be explained in terms of the high variability in several factors due to the open inclusion criteria.Figure 4 shows the average SNR50 values obtained for the group of hearing impaired, calculated according to the Tillman-Olsen method. The vertical lines represent the 95% CI for each list. It is an analysis like that performed with the QuickSINlists and results were obtained that reflect close characteristics [17].
ANOVA analysis of variance is shown in the table. Since the pvalue is greater than the significance level of 0.05, the null hypothesis can be accepted: the means do not show statistically significant differences for the 8 lists. F (7,308) = 0.25, p> 0.05 (Table 7).
| LIST | N | Mean | SD | 95% IC |
|---|---|---|---|---|
| 1 | 45 | 4.844 | 5.07 | (3.446, 6.243) |
| 2 | 45 | 4.9 | 4.807 | (3.502, 6.298) |
| 3 | 45 | 5.244 | 4.919 | (3.846, 6.643) |
| 4 | 45 | 4.856 | 4.522 | (3.457, 6.254) |
| 5 | 45 | 5.1 | 4.748 | (3.702, 6.498) |
| 6 | 45 | 4.378 | 4.182 | (2.980, 5.776) |
| 7 | 45 | 5.067 | 4.751 | (3.669, 6.465) |
| 8 | 45 | 5.522 | 5.084 | (4.124, 6.920) |
Table 7: Mean for 8 lists (hearing impaired).
ANOVA SNR50
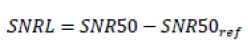
Average SNR50 for the group of subjects with hearing loss was 4.98 dB, therefore, the difference of SNR50 between this group and the average of the normal subjects was 9.86 dB.
Since we are interested in calculating the loss of signal-to-noise ratio, we must subtract the value of SNR50 from reference value. This reference is the average SNR50 of a group of subjects with normal hearing, without hearing in noise problems. According to the data from Experiment 2, this value can be approximated to SNR50ref = - 5 dB, therefore:
Killion et al. point out that a table like the one shown in Figure 5 can be used to interpret the SNRL value [9].

Figure 5: Average values and standard deviation for the 8 lists in the group of hearing impaired n = 45.
The standard deviation of the SNR50 values between lists for the hearing impaired subjects in Experiment 2 had an average value of 4.48 dB, while for the subjects with normal hearing this average was 1.61 dB.
These data can be used to assess the reliability of the test. A list provides the result for a hearing impaired subject with an 80% confidence interval of ± 2.04 dB and a 95% confidence interval of ± 3.12 dB. If two lists are taken and averaged, the value with the 80% confidence interval is ± 1.44 dB. Finally, if greater precision is desired, 3 lists can be taken, which will give a confidence interval of ± 1.2 dB for 80% and ± 1.8 dB for 95%. It is advisable then, to obtain greater precision, the test of two or more lists and the calculation of the average of the results. The greater the number of lists averaged, the better the accuracy will be (Table 8).
| SNRL | DEGREE OF SNRL | INTERPRETATION |
|---|---|---|
| 0-2 dB | Normal/almost normal | May hear better than normal in noise |
| 2-7 dB | Mild | May hear almost as well as normal in noise |
| 7-15 dB | Moderate | Directional microphones help. |
| >15 dB | Severe | Consider array mic.Maximum SNR improvement in needed. |
Table 8: Table 5 Interpretation of SNRL levels (Adapted from Killion et al, 2004).
Averaging the results of multiple lists is important when using the test to compare two conditions, such as two hearing aids or two different settings on one hearing aid [18-20].
The RPS Quick SIN test contains 8 lists to carry out tests to calculate the value of the loss of Speech to noise ratio loss (SNRL). It also provides two lists for training. The lists contain variable SNR sentences in decreasing steps of 5 dB and 5 significant words per sentence. The availability of information related to the SNRL, which is not measurable through conventional audiometry or speech audiometry tests, adds specific data on the ability of a subject (listener or hearing impaired) to perform in noisy environments. The test time of each list does not exceed one minute, this being an important aspect for use in the clinic. Similar tests exist in other languages and have proven to be valuable auxiliary tools for providing information both to characterize the hearing loss being treated and to help in the selection process of hearing aid technologies.
The set of 10 lists (2 for training and 8 for testing) are available for free use. To request them write to the authors at the indicated email address.
The authors express their gratitude to all the people who helped to carry out this work: firstly, to the staff and members of the Board of Directors of the Mutualidad Argentina de Hipoacúsicos who turned out to be test subjects in the different stages of the project, to Flga .Nilda Villanueva de Sanz and Lic. Silvia Espinazo, for the support in the search for hearing impaired subjects for the verification tests, to the Flga Laura Abal, for their participation in the first stages of the project, to Flga. EimiCecotto for lending her voice for the recording of the charts, to Paola Grajales, Nadia Rovelli and Leonardo Lapouble for their collaboration in the background noise recordings, to Ms. Adriana Kowalyk for her help in preparing the material for registration, family and friends who have also been test subjects, students of the Psychoacoustics course at the University of the Argentine Social Museum (UMSA), students of the Audiology course at the Catholic University of Santa Fe ( UCSF) for their voluntary participation in the filtered speech tests, to Drs. Mead Killion, Larry Revit and Patricia Johnson, creators of the original English-language Quick SIN, for their essential advice and guidance.
Citation: Cristiani HE, Serra V, Guinguis M (2020) Development of a Quick Speech-in-Noise Test in "Rioplatense" Spanish, Based on Quick -SIN®. J PhonetAudiol 6: 145. DOI:10.35248/2471-9455.20.6.145.
Published: 24-Sep-2021 , DOI: 10.35248/2471-9455.23.9.206
Copyright: This is an open access article distributed under the terms of the Creative Commons Attribution License, which permits unrestricted use, distribution, and reproduction in any medium, provided the original work is properly cited.