Journal of Tourism & Hospitality
Open Access
ISSN: 2167-0269
ISSN: 2167-0269
Research Article - (2019)Volume 8, Issue 1
This study attempts to determine the overall satisfaction factors from airline passengers at the San Francisco International Airport (SFO), using the classification method of random forest. The analysis is based on the 2014 annual survey conducted by SFO that collects data on passenger demographics and satisfaction with airport facilities and services. Results of this study indicate that some service attributes are more important than others for passengers’ overall satisfaction at SFO. Study results are expected to provide practical insights to the airport industry. This study, in addition, introduces the machine learning method of random forest to tourism research.
Airport; Customer satisfaction; Predictive modeling; Random forest; Service attributes
Researchers in tourism have generally used (i) multiple linear regression [1,2] which ignores the fact that the response is ordinal and not interval scale data, (ii) multinomial or ordinal logistic regression [3,4] or (iii) transformation to convert a 5-point Likert scale response to a binary response that is modeled by the binary logistic regression method [5], which is not necessary. The method of random forest [6] is a machine learning tool for classification and regression problems; the method uses decision trees and bootstrapping to predict a multinomial response (classification) or a continuous response (regression). This study attempts to determine the overall satisfaction factors from airline passengers at the San Francisco International Airport (SFO) (hereon called “SFO”) by using the method of random forest.
Airports are complex service settings where passenger satisfaction is influenced by a variety of attributes [7]. Some of the known factors that influence passenger’s satisfaction are: security check, art display, accessibility, airport parking, baggage, cleanliness, information availability, restrooms, restaurants, shops, staff, signage, and Wi- Fi [8-12]. In study of the service quality at Melbourne airport [11], significant discrepancies between passengers’ expectations and their perceptions of service quality at the airport were found, indicating room for improvement in service quality at the Melbourne Airport. Another study [13] used observations and information collected from a focus group study, and in-depth interviews to determine reasons for delays in baggage access. Researchers in hospitality and tourism have also investigated the problems related to determinants of customer satisfaction [14-16].
Data collection and description of variables
SFO conducts an annual survey and collects data on passenger demographics and satisfaction with airport facilities and services from stratified random samples [15]. This study uses secondary data from the 2014 SFO annual survey, which provided a random sample of 2820 responses on 95 questions, with a number of missing responses ranging from 0 to 2820. A total number of 23 variables are selected for the analysis based on existing literature. The method of multivariate imputation by chained equations (MICE) yields a complete data set and results in estimates with smaller standard errors and narrower confidence intervals [16]. The R-package mice is therefore used to replace missing values [17].
In this study, three types of predictor variables are selected to determine the key drivers of overall satisfaction at SFO: ratings, cleanliness, and demographics. Ratings include a total of 15 items (artwork exhibitions, restaurants, retail shops and concessions, signs and directions inside SFO, escalators/elevators/moving walkways, information on screens/monitors, information booths (lower level - near baggage claim), information booths (upper level - departure area), accessing and using free Wi-Fi at SFO, signs and directions on SFO airport roadways, airport parking facilities, AirTrain, long term parking lot shuttle (bus ride), airport rental car center, and SFO Airport as a whole. A 5-point Likert scale, with 1 as “Unacceptable” to 5 as “Outstanding” is used to measure ratings.
Cleanliness includes a total of 6 items (Boarding areas, AirTrain, airport rental car center, airport restaurants, restrooms, and overall SFO cleanliness). A 5-point Likert scale, with 1 as “Dirty”, 3 as “Average” to 5 as “Clean” is used to measure cleanliness. Age, gender, and income are the demographic variables, with age categorized into 7 levels, gender categorized into 3 levels, and income categorized into 5 levels. Table 1 summarizes the variables selected in this study.
| Variable label | Attribute |
|---|---|
| Q7 = Ratings | |
| Q7ART | Artwork and exhibitions |
| Q7FOOD | Restaurants |
| Q7STORE | Retail shops and concessions |
| Q7SIGN | Signs and directions inside SFO |
| Q7WALKWAYS | Escalators/Elevators/Moving walkways |
| Q7SCREENS | Information on screens/monitors |
| Q7INFODOWN | Information booths (lower level - near baggage claim) |
| Q7INFOUP | Information booths (upper level - departure area) |
| Q7WIFI | Accessing and using free WiFi at SFO |
| Q7ROADS | Signs and directions on SFO airport roadways |
| Q7PARK | Airport parking facilities |
| Q7AIRTRAIN | AirTrain |
| Q7LTPARKING | Long term parking lot shuttle (bus ride) |
| Q7RENTAL | Airport Rental Car Center |
| Q7ALL | SFO Airport as a whole |
| Q9 = Cleanliness of SFO | |
| Q9BOARDING | Boarding areas |
| Q9AIRTRAIN | Airtrain |
| Q9RENTAL | Airport Rental Car Center |
| Q9FOOD | Airport restaurants |
| Q9RESTROOM | Restrooms |
| Q9ALL | Overall cleanliness |
| Demographic variables | |
| Q18AGE | Age (1 = Under 18, 2 = 18-24, 3=25-34, 4=35-44, 5=45-54, 6=55-64, 7 = 65 and over, 8=don’t know/refused, 9= multiple responses, 10 = Blank) |
| Q19GENDER | Gender (1 = Male, 2 = Female, 3 = Other) |
| Q20INCOME | Income (1 = Under 50K, 2 = 50K-100K, 3=101K-150K, 4=Over 150K, 5 = Other currency, 0 = Blank ) |
| LANG | Language of questionnaire (1 = English, 2 = Spanish, 3 = Chinese, 4 = Japanese) |
Table 1: Description of variables in 2014 SFO Survey.
Method of random forest
The analyses are performed using the statistical software environment R [18]. The method of random forest is utilized to build a predictive model for overall satisfaction as a function of the 22 selected predictors. Random forest is a highly accurate ensemble machine learning method for classification or regression, which involves building a large number of decision trees in the training step, and outputs the model of the classes predicted by individual trees [4,19,20].
This study uses the R-package randomForest [21] to perform the method of random forest. The package randomForest outputs ‘Out of Bag’ (OOB) (i.e., out of the training sample) estimates of prediction accuracy as well as a plot showing the importance of predictors in the model. The package is iteratively used by adding and dropping predictors until a final model with good prediction accuracy is obtained. The association between the response variable and each individual predictor is further tested by the chi-square test of independence; in majority of the cases, the expected frequencies of several cells turn out to be less than 5, and the p-values for the chi-square test are evaluated by bootstrap [22].
Performance measures for prediction
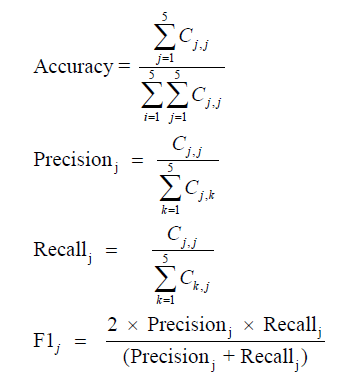
A large number of performance measures for multi-level classifiers exist in machine learning literature [23]. Accuracy, precision, recall and the geometric mean F1 of precision, and recall are commonly used [24,25]. To compute these measures, the confusion matrix is first calculated. Since the response has five categories, the confusion matrix is comprised of a 5x5 matrix of cell frequencies Ci,j where Ci,j = number of times true response of j get predicted as i (i, j = 1, 2, …, 5) (Table 2).
| Predicted Overall Satsfaction | True Overall Satsfaction | ||||
| 1 | 2 | 3 | 4 | 5 | |
| 1 | C1,1 | C1,2 | C1,3 | C1,4 | C1,5 |
| 2 | C2,1 | C2,2 | C2,3 | C2,4 | C2,5 |
| 3 | C3,1 | C3,2 | C3,3 | C3,4 | C3,5 |
| 4 | C4,1 | C4,2 | C4,3 | C4,4 | C4,5 |
| 5 | C5,1 | C5,2 | C5,3 | C5,4 | C5,5 |
Table 2: Performance measures for prediction.
The performance measures accuracy, precision, recall and F1 were calculated for each category from the following formulas [24]:
There are examples in the literature when a multi-level classification or prediction problem is transformed into a binary classification so that the binary logistic regression can be used [3]; for this reason, the overall ratings are transformed as follows:
“Unacceptable (1)”, “Below Average (2)”, “Average (3)” = 0, “Good (4)”, and
“Outstanding (5)” = 1 and the performance measures are recalculated; these are referred to as binary accuracy, precision, recall, and F1 in this study.
Data imputation
Table 3 shows that the method of multivariate imputation by chained equations (MICE) has performed quite well for the data set; the five-point summaries of data before and after imputation are very close to each other.
| Variable | N | Mean | Median | sd | Min | Max | |||||
|---|---|---|---|---|---|---|---|---|---|---|---|
| B | A | B | A | B | A | B | A | B | A | ||
| RATE_ART | 675 | 3.92 | 3.91 | 4 | 4 | 0.88 | 0.88 | 1 | 1 | 5 | 5 |
| RATE_FOOD | 481 | 3.58 | 3.59 | 4 | 4 | 0.89 | 0.89 | 1 | 1 | 5 | 5 |
| RATE_STORE | 512 | 3.6 | 3.63 | 4 | 4 | 0.87 | 0.86 | 1 | 1 | 5 | 5 |
| RATE_SIGN | 122 | 4.01 | 4.02 | 4 | 4 | 0.87 | 0.87 | 1 | 1 | 5 | 5 |
| RATE_WALKWAYS | 274 | 4.09 | 4.08 | 4 | 4 | 0.81 | 0.82 | 1 | 1 | 5 | 5 |
| RATE_SCREENS | 174 | 4.05 | 4.05 | 4 | 4 | 0.82 | 0.82 | 1 | 1 | 5 | 5 |
| RATE_INFODOWN | 1298 | 3.84 | 3.86 | 4 | 4 | 0.88 | 0.87 | 1 | 1 | 5 | 5 |
| RATE_INFOUP | 1298 | 3.86 | 3.86 | 4 | 4 | 0.86 | 0.87 | 1 | 1 | 5 | 5 |
| RATE_WIFI | 864 | 3.91 | 3.9 | 4 | 4 | 1.13 | 1.13 | 1 | 1 | 5 | 5 |
| RATE_ROADS | 964 | 3.95 | 3.95 | 4 | 4 | 0.88 | 0.88 | 1 | 1 | 5 | 5 |
| RATE_PARK | 1710 | 3.79 | 3.8 | 4 | 4 | 0.95 | 0.94 | 1 | 1 | 5 | 5 |
| RATE_AIRTRAIN | 1410 | 4.08 | 4.12 | 4 | 4 | 0.85 | 0.83 | 1 | 1 | 5 | 5 |
| RATE_LTPARKING | 2123 | 3.79 | 3.8 | 4 | 4 | 0.95 | 0.92 | 1 | 1 | 5 | 5 |
| RATE_RENTAL | 1824 | 3.72 | 3.73 | 4 | 4 | 1.02 | 1 | 1 | 1 | 5 | 5 |
| RATE_ALL | 143 | 4 | 4 | 4 | 4 | 0.71 | 0.7 | 1 | 1 | 5 | 5 |
| CLEANLINESS_BOARDING | 56 | 4.34 | 4.34 | 5 | 5 | 0.76 | 0.77 | 1 | 1 | 5 | 5 |
| CLEANLINESS_FOOD | 661 | 4.13 | 4.11 | 4 | 4 | 0.82 | 0.82 | 1 | 1 | 5 | 5 |
| CLEANLINESS_RESTROOM | 213 | 4.08 | 4.06 | 4 | 4 | 0.86 | 0.87 | 1 | 1 | 5 | 5 |
| CLEANLINESS_ALL | 81 | 4.2 | 4.19 | 4 | 4 | 0.75 | 0.75 | 1 | 1 | 5 | 5 |
| AGE | 516 | 4.11 | 4.13 | 4 | 4 | 1.56 | 1.56 | 1 | 1 | 7 | 7 |
| GENDER | 114 | 1.5 | 1.5 | 1 | 1 | 0.52 | 0.52 | 1 | 1 | 3 | 3 |
| INCOME | 494 | 2.62 | 2.62 | 3 | 3 | 1.12 | 1.12 | 1 | 1 | 5 | 5 |
| LANG | 2 | 1.06 | 1.06 | 1 | 1 | 0.35 | 0.35 | 1 | 1 | 4 | 4 |
Table 3: Results of data imputation by MICE - number of missing values, and five-point summary of data before (B) and after (A) data imputation.
The stacked bar chart of Wi-Fi service (RATE_WIFI) (Figure 1) shows that the majority of SFO passengers give a rating of 4 or 5 to the Wi-Fi service at SFO; Figure 1 further suggests that the proportions of Wi-Fi service ratings of 1, 2,…, 5 are similar across the gates, i.e., there is no association between Wi-Fi service rating and gate; this is confirmed by the chi-square test of association between gate and Wi- Fi service (p = 0.18), which implies that the quality of Wi-Fi is similar at each gate. Figures 2 and 3 show stacked bar charts of eight of the rating predictors by the response variable overall satisfaction with SFO (RATE_ALL).

Figure 1: Stacked bar charts of WIFI ratings by Gate.

Figure 2: Stacked bar charts of ratings on signage, food, roads, and overall cleanliness by the response variable overall satisfaction with SFO (RATE_ALL).

Figure 3: Stacked bar charts of ratings on art, store, rental, and WIFI by the response variable overall satisfaction with SFO (RATE_ALL).
All of the bar charts suggest the presence of association between the response and the predictor; the chi-square test of independence confirms this association; Table 4 shows that strong association exists between the response variable and each of the potential predictors.
| Predictor | Chi-square statistic | P-value |
|---|---|---|
| RATE_SIGN | 1458.1 | 0 |
| RATE_FOOD | 1347.0 | 0 |
| RATE_ROADS | 1303.4 | 0 |
| CLEANLINESS_ALL | 1376.3 | 0 |
| RATE_ART | 1224.5 | 0 |
| RATE_STORE | 1288.7 | 0 |
| RATE_RENTAL | 925.17 | 0 |
| RATE_WIFI | 729.34 | 0 |
Table 4: Results of the chi-square test of independence between the response and the potential predictors.
Figure 4 shows the stacked bar charts of age (AGE) and gender (GENDER) by the response variable overall satisfaction with SFO (RATE_ALL). Figure 4 suggests that overall satisfaction with SFO is not affected by age or gender. Table 5 shows the results of the chisquare test of independence between the response variable and the two demographic variables age and gender. The associations between the response and these two potential predictors are insignificant (p > 0.05).

Figure 4: Stacked bar charts of demographic variables AGE and GENDER by the response variable overall satisfaction with SFO (RATE_ALL).
| Predictor | Chi-square statistic | P-value |
|---|---|---|
| AGE | 34.98 | 0.096 |
| GENDER | 6.81 | 0.441 |
Table 5: Results of the chi-square test of independence between the response and the demographic variables AGE and GENDER.
The random forest model
The backward selection procedure is used to find the important predictors of the response variable overall satisfaction with SFO (RATE_ALL). Table 6 shows the multi-level confusion matrix of the full random forest model for the response as a function of all of the 22 potential predictors, and Table 6 shows the binary confusion matrix of prediction obtained from Table 6. Tables 6 and 7 show that the random forest model has high accuracy (75%) and very high binary accuracy (98.5%).
| Predicted Overall satisfaction | ||||||
|---|---|---|---|---|---|---|
| Unacceptable | Below Average | Average | Good | Outstanding | ||
| Observed Overall satisfaction | Unacceptable | 3 | 0 | 2 | 1 | 0 |
| Below Average | 0 | 5 | 29 | 5 | 0 | |
| Average | 0 | 4 | 308 | 232 | 4 | |
| Good | 0 | 0 | 87 | 1400 | 102 | |
| Outstanding | 0 | 0 | 0 | 225 | 413 | |
Table 6: Confusion matrix of the random forest model for 5-point Likert scale response RATE_ALL with all potential predictors.
| True Binary Overall Satisfaction | |||
|---|---|---|---|
| Observed Binary Overall Satisfaction |
0 | 1 | |
| 0 | 351 | 6 | |
| 1 | 87 | 2140 | |
Table 7: Confusion matrix of the random forest model for RATE_ALL with all potential predictors for binary response (Unacceptable and Below Average = 0, Average, Good, or Outstanding = 1) obtained by collapsing rows and columns of Table 6.
Figure 5 shows the plot of variable importance measures for the full random forest model; gender (GENDER), language (LANG), age (AGE), and income (INCOME) are the least important predictors in this model, and overall SFO cleanliness (CLEANLINESS_ALL), signs and directions inside SFO (RATE_SIGN), artwork exhibitions (RATE_ART), and restaurants (RATE_FOOD) are the most important ones. Key drivers of overall satisfaction were obtained by successively removing predictors from the bottom of Figure 5: signs and directions inside SFO (RATE_SIGN), overall SFO cleanliness (CLEANLINESS_ ALL), signs and directions on SFO airport roadways (RATE_ROADS), artwork exhibitions (RATE_ART), retail shops and concessions (RATE_STORE), restaurants (RATE_FOOD), airport rental car center (RATE_RENTAL) and accessing and using free Wi-Fi at SFO (RATE_ WIFI).

Figure 5: Variable importance plot of the full random forest model, i.e., from random forest model for overall satisfaction as a function of all of the 22 selected predictors.
Table 8 shows the multi-level confusion matrix, and Table 9 shows the binary confusion matrix for the final random forest model. The OOB accuracy of the final random forest model (74.6%) is very close to that of the full random forest model (75.5%). Figure 6 shows the variable importance of the predictors in the final random forest model.

Figure 6: Variable importance plot from the final random forest model for overall satisfaction.
| Predicted Overall satisfaction | ||||||
|---|---|---|---|---|---|---|
| Unacceptable | Below Average | Average | Good | Outstanding | ||
| Observed Overall satisfaction | Unacceptable | 3 | 0 | 2 | 1 | 0 |
| Below Average | 0 | 8 | 25 | 6 | 0 | |
| Average | 0 | 3 | 308 | 232 | 5 | |
| Good | 0 | 1 | 112 | 1343 | 133 | |
| Outstanding | 0 | 0 | 0 | 196 | 442 | |
Table 8: Confusion matrix of the random forest model for 5-point Likert scale response RATE_ALL using the final predictors.
| True Binary Overall Satisfaction | |||
|---|---|---|---|
| Observed Binary Overall Satisfaction |
0 | 1 | |
| 0 | 349 | 7 | |
| 1 | 113 | 2114 | |
Table 9: Confusion matrix of the random forest model for RATE_ALL using the final predictors for binary response (Unacceptable and Below Average = 0, Average, Good, or Outstanding = 1) obtained by collapsing rows and columns of Table 8.
This study introduces the machine learning tool of random forest to tourism literature, and shows the applicability of this approach in determining drivers of passenger satisfaction using data from the 2014 SFO customer satisfaction survey. The methods used in this study (data imputation, random forest predictive model) and performance measures computed for multi-level response (precision, recall, F1) are taken from the machine learning literature and applied to analysis of SFO customer satisfaction data. These methods can clearly be applied to any modeling situation in which the response variable is multi-level, without transforming it to binary response, or using methods such as multiple linear regression which should not be used for ordinal data.
Generally, this study suggests that the key drivers of overall satisfaction at the SFO airport are artwork and exhibitions, restaurants, retail shops and concessions, signs and directions inside SFO, signs and directions inside SFO airport roadways, airport rental car center, accessing and using free Wi-Fi at SFO, and overall cleanliness of SFO. Among these key drivers, overall cleanliness of SFO, signs and directions inside SFO, artwork and exhibitions, and restaurants are regarded most important. Several limitations exist in this study. Study results cannot be generalized as data is from a single airport and from 2014 only. Moreover, there is no ‘typical’ airport in terms of services and facilities provided [26-29]: airports differ in size, infrastructure, service facilities etc., so not all airports may have all of the features at SFO. It is recommended to replicate this study for different years and different sizes of airports. Additionally, this study did not use the entire list of variables from the SFO survey. Future studies are encouraged to include a broader variety of predictor variables to determine the drivers of passengers’ overall satisfaction.
Funding for this project was provided by the Caesars Foundation.
Citation: Singh AK, Yoo M, Dalpatadu RJ (2019) Determinants of Customer Satisfaction at the San Francisco International Airport. J Tourism Hospit 8:398. doi: 10.4172/2167-0269.1000398
Received: 10-Dec-2018 Accepted: 16-Jan-2019 Published: 23-Jan-2019 , DOI: 10.35248/2167-0269.19.8.398
Copyright: © 2019 Singh AK, et al. This is an open-access article distributed under the terms of the Creative Commons Attribution License, which permits unrestricted use, distribution, and reproduction in any medium, provided the original author and source are credited.