Journal of Tourism & Hospitality
Open Access
ISSN: 2167-0269
ISSN: 2167-0269
Mini Review - (2023)Volume 12, Issue 3
Tourist resources can be contaminated and closed down if the contaminated are not cleared for degradation to set in. This study therefore developed a three-compartment dynamic model to show how tourism activities can generate pollution that can affect coastal tourism in Nigeria. The model has three dynamics non-overlapping compartments, which was applied to international tourist arrivals in Nigeria and estimated using moment method. The result showed that if the rate of degradation, carrying capacity, and contamination rate of a resource are not properly managed could increase the rate of pollution in the environment, while an increase in the clearance rate could reduce the level of pollution. It is therefore concluded that restrictions should be put in place to make sure carrying capacity of the resources is not exceeded, and the neatness of the environment should be ensured.
Coastal tourism; Contamination; Environmental pollution; Resources; Visitors
Goal 8 of the sustainable development goal (2030) is on inclusive and sustainable economic growth, goal 12 is on sustainable consumption and production, while goal 14 is on the sustainable use of oceans and marine resources. Coastal tourism development touches these goals 8, 12, and 14 one way or the other. Tourism is one of the emerging markets in Nigeria mapped out as a means of diversification, and it is one of the mainstays of global economy. Coastal tourism is therefore associated to tourism resources in areas where there are oceans, like Lagos, Nigeria, as the main purpose of attraction. International tourists flow measures the number of tourists that arrives and leaves a country, which is a measure of tourism development of a country tourist resources are the facilities or natural endowment that attracts tourists to a particular location. These tourism resources can be contaminated due to inflow of tourists to the resources without proper cleanup and become degraded and unattractive. The degradation natures of the tourist resources discourage tourists from visiting the resources, thereby making the country to loose cash inflow and economic development. So, tourism development can cause environmental pollution, and environmental pollution can affect tourism development. Many authors in literature have looked for different means to model the relationship between costal tourism development and environmental pollution using different mathematical and statistical model, but none has considered the dynamic nature of the relationship they either use static or stochastic model. Thus, this paper is a commentary of Metilelu, et al., which insight was gained into how tourism development affects tourist resources, thereby affecting the environment through pollution using a novel dynamic mathematical model [1-6].
The dynamic model was formulated with three compartments, Visitors (V), Resources (S) and Contamination (C). The visitors are the number of tourists visiting Nigeria at a particular Time (T); the resources are the tourism attraction centres and any other features that are of interest to the tourists at the time, while contamination is the pollution to the coastal environment due to tourists’ activities at the time. The visitors arriving are used as a proxy for tourism development. The resources are the beaches, and other attractions around the beach area. The contamination is the amount of pollutants caused by the presence of the tourists and natural environment at the time. It is assumed that if the carrying capacity of the resources is overstretched, it will lead to high level of pollution and degradation of the resources.
Formulation of the model is based on some assumptions. As the tourists resources are popularized by word-of-mouth or through advertisement, the tourist flow to the location where the resources are since they are influenced by the word-of-mouth positively at a given rate β, and K is the carrying capacity of the tourist resources. When the rate at which tourist arrives increases, it is assumed that the demand for recreational activities by the tourists may follow a law of diminishing return due to competition for scarce resources, which may lead to overcrowding and increased tourists activities that may further contaminate the environment. Afterward, when word-of-mouth is negative, can discourage tourists from visiting the resources at a given rate d. It is also assumed that β>d in an ideal situation.
Increasing number of visitors in the coastal area is as a result of the growth in tourist resources with an intrinsic growth rate α. There may be degradation in tourism resources due to the increase in contamination as a result of tourist activities at rate θ in the environment. The dynamics of the resources is given by:
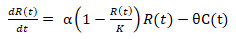
Contamination in the environment is increased through tourist activities resulting in the degradation in tourism resources and natural contamination in the surrounding at a constant rate c1 while the rate of clearing the contamination is assumed to be c2, where c2>c1. Hence, we have the dynamics of the contamination in the surrounding given by:
The steady-state solutions have six possible scenarios that can play out in the current settings as follows. Scenario 1 is a situation where there are no resources, contamination and therefore, there is no interest in tourism in the area. Scenario 2 is a setting where tourists are available but no resources of interest. Scenario 3 is that the tourist resources are yet to be discovered by tourists. Scenario 4 is a scenario that describes a tourist attraction centre having a constant number of tourists and the area is pollution-free. Scenario 5 represents a situation where there is no tourist to visit a particular tourist attraction centre due to high pollution of the resources. Scenario 6 depicts a situation where fully developed tourist resources, the tourists and elements of pollution all coexist. The six scenarios are mutually exclusive and exhaustive [7-10].
Data on international tourist arrivals to Nigeria from 1995 to 2016 is taken as Visitors (V) collected from world bank database. The tourist resource in the coastal areas of Nigeria is aggregated as the Resource (R), and the pollution of the tourist resources in the coastal area of Nigeria, either through the tourist activities or naturally is Contamination (C) (Figure 1).
Figure 1 shows that international tourists arriving Nigeria increased from 1995 to 2010, and after then experienced a sharp fall. This number has been fluctuating.

Figure 1: International tourist arriving Nigeria (1995 to 2016).
Table 1 shows 942 out of 10,000 tourists are influenced by wordof- mouth while 274 out of 10,000 tourists were discouraged from coming to Nigeria yearly. The carrying capacity is 76.82% full. Table 1 shows that 4.19% available tourist resources are established in Lagos yearly, 16.35% of the tourist attractions are degradation due to contamination. It is assumed that the rate of natural contamination in the surrounding is 50% and the rate of clearing the contamination is 50.01% [10-13].
| Parameters | Description | Estimates (per year) | Minimum | Maximum | Source/Ref. |
|---|---|---|---|---|---|
| β | Rate at which the tourists are influenced by word of mouth or advertisement. | 0.0942 | 0.001 | 0.117 | Estimated |
| K | Carrying capacity of the tourist resources. | 0.7682 | 0.1101 | 1 | Estimated |
| d | Rate at which the inflow of tourists is decreased. | 0.0274 | 0.0003 | 0.0574 | Estimated |
| α | Intrinsic growth rate of tourist resources. | 0.0419 | 0 | 0.59 | Estimated |
| θ | Rate of degradation of tourist attraction due to contamination. | 0.1635 | 0 | 0.2052 | Estimated |
| C1 | Rate of natural contamination in the surrounding. | 0.5 | 0 | 0.6 | Assumed |
| C2 | Rate of rate of clearing the contamination. | 0.5001 | 0.5001 | 0.9014 | Estimated |
Table 1: Estimates, minimum, maximum.
Figure 2 shows that the dynamic model fit the data. The actual values are the dotted red, while the fitted values are represented by the blue straight line.

Figure 2: Fitting internal tourism arrival (1995 to 2016).
Coastal tourism is directly related with the environment and with the potentials within a country as regards socio-economic real growth. There are enough tourist resources along the coastal area of Nigeria that are yet untapped. This research came out with the conclusion that environmental pollution can be attributed to tourists activities in the area, which makes the demand of coastal tourism to be high, by exceeding the carrying capacity of the tourist attractions where resources are scarce. Coastal tourism resources are over stressed by tourist’s activities in the coastal areas, which can increase pollution level. The analyses showed that the rate of degradation, with the carrying capacity, and the contamination rate increase the rate of pollution in the environment.
[Crossref] [Google Scholar] [PubMed]
[Crossref] [Google Scholar] [PubMed]
[Crossref] [Google Scholar] [PubMed]
[Crossref] [Google Scholar] [PubMed]
[Crossref] [Google Scholar] [PubMed]
Citation: Metilelu OO, Adeniyi MO, Ekum MI (2023) Commentary on Dynamic Effect of Environmental Pollution on Coastal Tourism. J Tourism Hospit. 12:522.
Received: 05-Jan-2023, Manuscript No. JTH-23-21270; Editor assigned: 09-Jan-2023, Pre QC No. JTH-23-21270 (PQ); Reviewed: 23-Jan-2023, QC No. JTH-23-21270; Revised: 06-Mar-2023, Manuscript No. JTH-23-21270 (R); Published: 13-Mar-2023 , DOI: 10.35248/2167-0269.23.12.522
Copyright: © 2023 Metilelu OO, et al. This is an open-access article distributed under the terms of the Creative Commons Attribution License, which permits unrestricted use, distribution, and reproduction in any medium, provided the original author and source are credited.