Journal of Hematology & Thromboembolic Diseases
Open Access
ISSN: 2329-8790
ISSN: 2329-8790
Research Article - (2016) Volume 4, Issue 2
To provide a single molecular assay that could be used to easily stage Multiple Myeloma patients at diagnosis, we investigated the association between the simultaneous expression of 7 Multiple Myeloma-associated Cancer/Testis Antigens and biochemical parameters that are currently used for disease staging. We analysed the mRNA expression of MAGEC1, MAGEA3/A6, BAGE2, PRAME, NYESO1, SSX2 and PAGE by qualitative reverse transcription PCR using RNA extracted from diagnostic bone marrow samples from 39 patients covering the Multiple Myeloma disease continuum and compared this to levels of key biochemical parameters at diagnosis. We found that the Cancer/Testis Antigen panel was expressed in a specific order that was specifically associated with the severity of disease. This allowed the Cancer/Testis Antigens expression profile to successfully place the patient clearly into either stage I or stage III of the disease, with further sub-stratification in the stage III grouping. In addition, we putatively identified MAGEC1 expression as a confirmatory diagnostic marker for symptomatic Multiple Myeloma and clearly associated BAGE2 expression exclusively with stage III disease. We also demonstrated the novel finding of PAGE expression in Multiple Myeloma, with an association with more advanced disease. We suggest that this particular molecular Cancer/Testis Antigen panel can be used at diagnosis as a single test to clearly stage patients.
Keywords: MAGEC1; BAGE2; Cascade; Myeloma
Multiple Myeloma (MM) is a hematological malignancy that is characterized by the accumulation of monoclonal malignant plasma cells in the bone marrow (BM), and elevated serum or urine monoclonal paraproteins. Severe clinical manifestations occur due to the accumulation of plasma cells in the BM, which results in anemia, immunodeficiency and lytic bone lesions, as well as overproduction of paraproteins. Complete remission is easily induced in patients with high dose chemotherapy and stem cell rescue protocols, but relapse and death are extremely common and the disease is currently incurable [1,2].
There are a number of factors that influence a MM patient’s prognosis and response to therapy [3-7] including: disease stage, renal impairment, tumor burden, severity of anaemia, proliferation index of the plasma cells (PCPI) and chromosomal abnormalities. The International Staging System (ISS), is based on levels of β2 microglobulin (B2M) and albumin, and the Durie-Salmon Staging (DSS) index that looks at M-protein levels, the presence of bone lesions, haemoglobin (Hb), calcium and serum creatinine levels [8,9]. While both staging systems are fairly successfully in staging disease into 3 large categories, multiple additional tests are required to be able to sub-classify the patients into more specific prognostic subgroups. Not only is this process expensive, but often not possible due to the range of laboratory expertise that is required and thus a comprehensive patient prognostic profile is often not achieved.
The concept of a single molecular panel that can be used to both stage and further sub-group high risk patients is thus an attractive alternative approach. Unfortunately, the genetic background of MM is very complex, with multiple chromosomal abnormalities occurring in different patients.
In the search for common genetic profiles in MM, Cancer/Testis antigens (CTAs) were investigated. These genes encode proteins that show testis-restricted expression in normal tissue, but high expression in many different cancer types [10-12]. The expression of these proteins has been associated with a worse prognosis in many cancers in addition to MM and in particular with the proliferative nature of the tumours [13,14]. Although the full panel of CTAs has yet to be tested in MM patients, the following CTAs have been found to be expressed in 20-80% of cases: MAGEC1 and MAGE A3/6, SP-17, PRAME, NYESO1, SSX family (1,2,5) and BAGE [15-19]. While commonly expressed, the role in MM pathogenesis is unclear, with hints at a possible cascade-like effect occurring where the expression of multiple CTAs appears to be associated with advanced disease [17,19,20].
It is thus possible that a CTA panel maybe useful in sub-typing MM prognostic groups. If we and others are successful in linking CTA expression patterns with major prognostic indicators, then this assay could easily be offered as a quick molecular service, providing vital prognostic information to clinicians.
The aim of this study was to establish an association between CTA expression (7 CTAs) and key disease staging/prognostic factors in newly diagnosed MM patients, to be able to define a genetic panel that has clinical value at diagnosis.
Patient selection, diagnosis and disease staging
Newly diagnosed patients with untreated MM or monoclonal gammopathy of undetermined significance (MGUS) from the Haematology clinic, Groote Schuur Hospital (GSH) and UCT Private Academic Hospitals (Cape Town, South Africa) were enrolled for the study over a 24 month period. This study was approved by the Human Research Ethics Committee University of Cape Town: HREC/REF 125/2009 and all participants gave their written informed consent to participate. Patients with known HIV+ status and secondary malignancies were excluded from the study. The following chemistry and haematology parameters were collected within two weeks of the diagnostic BM sample using standard pathological test methods (National Health laboratory Services- GSH (NHLS/GSH)): Hb (g/dl) , BM aspirate plasma cell count, B2M (mg/l) , Urine Bence Jones Protein (UBJP) (g/24 h), creatinine (μmol/l), monoclonal serum Ig levels (serum M-protein) (g/dl), corrected calcium (mmol/l) and albumin (g/l).
Patients were diagnosed as suffering from symptomatic MM (SMM), asymptomatic MM (AMM) or MGUS, based on the following criteria: 1) SMM: Clonal plasma cell population in BM or plasmacytoma; M-protein in serum or urine; evidence of organ damage: CRAB (WHO criteria [21])- corrected calcium ˃2.56 mmol/l, serum creatinine ˃90 μmol/l (F) ˃110 μmol/l (M), Hb˂12 g/dl (F) ˂13 g/dl (M), and/or evidence of bone lytic lesions. 2) AMM: M-protein in serum ˃30 g/l and/or ≥10% clonal plasma cells in BM; No evidence of CRAB symptoms. 3) MGUS: M-protein in serum ˂30 g/l; BM plasma cells ˂10%; no evidence of CRAB symptoms [21]. The disease stage of the patient was calculated according to a modified DSS [8,21] (based on the fact that our patients did not have their myeloma cell mass assessed).
PCPI and aneuploidy
A) The PCPI was generated using a Ki-67/CD138 (Becton Dickson) dual-labelling approach on mononuclear cells with analysis by flow cytometry (anti-Ki67 FITC, ABCAM; anti-CD138 APC, Becton Dickson) with a minimum of 10000 CD138 positive cells being analysed Ki-67+/CD138+ populations of ˃20% were resulted as positive for the proliferation marker. B) Aneuploidy DNA analysis was performed on unfractionated BM aspirate stained with propidium iodide (PI) [22]. The DNA content of 30 000 events in the lymphocyte gate was then analysed using the PI histogram, with the geometric mean value of the major G0/G1 peak being calculated (P1). Sexmatched controls were used for the analysis of each patient to be able to compare DNA content. A DNA index (MM PI/ control PI) of 0.95 – 1.05 was regarded as normal, hypodiploid ˂0.95, and hyperploid ˃1.05–1.75 [23]. The PI staining of lymphocytes allowed aneuploidy subpopulations of ˃10% to be scored in patients with ˃5% plasma cells.
CTA qualitative mRNA expression
Mononuclear cells from 2-5 ml BM aspirate were enriched using standard ficoll density centrifugation (Histopaque-1077, Sigma, USA). Approximately 1×10⁷ mononuclear cells were resuspended in Total RNA Isolation Reagent (TRIR) (ABgene, USA) and RNA extracted according to the manufacturer’s recommendations and stored in single use aliquots. Only samples fulfilling the following criteria were acceptable for analysis: 260/280 ratio ˃1.7, and ˃180 ng/μl. The expression of CTA mRNA was assessed using a 2-step RT-PCR protocol using random hexamers for global cDNA synthesis (20 μl): MMLV RT buffer, 1 μg random hexamers (Promega, USA), 1 mM dNTP mix (Sigma, USA), 20 U RNAsin (Promega, USA), 100 U MMLV (Promega, USA) and 1 μg heat–denatured RNA. The following cDNA reaction parameters were used: 22°C/10 min, 42°C/60 min, 99°C/5 min.
The expression of 7 CTAs and the reference gene β-actin was simultaneously assessed using 7 PCR reactions from a single patient RT reaction. PCR primer sequences are indicated in Table 1 and all were designed to amplify across introns. The following PCR reaction mix was used (25 μl): Green GoTaq buffer, 1.5 U GoTaq HotStart (Promega, USA), 0.8 mM dNTP mix (Sigma, USA), 1.5 mM MgCl2 and 2 μl cDNA and amplified under the following conditions: 95°C/5 min, 35 cycles of 94°C/30 sec, 55°C/40 sec and 72°C/90 sec with a final 8 min soak at 72°C. Amplicons were simultaneously separated on 3% TAE/agarose gels and visualized with EtBr staining. CTA expression results were not recorded if the β-actin amplification was inadequate. Samples were analyzed in duplicate.
| Primer Mix | Gene name (NCBI ref) | Quantity /reaction | Sequence (5’ – 3’) | Amplicon size (bp) |
| 1 | BAGE2 (NM_182482.2) |
25pmol | F: tggctcgtctcactctgg R: cctcctattgctcctgttg [13] |
267 |
| 2 | NYESO1 (NM_001327.2) |
25pmol | F: ctgcttgagttctacctcgcca R: tgaactggccactcgtgct# |
330 |
| 3 | SSX2 (NM_175698.1) PAGE (NM_003785.3) |
25pmol 25pmol | F:gtgctcaaataccagagaagatc R:tttgggtccagatctctctcgtg F: ccagtgatgagcaacctgacga R: ctctggcccttctgcgggca[24] |
434 232 |
| 4 | PRAME (NM_206956.1) |
50pmol | F:ctgtactcatttccagagccaga R:attgagagggtttccaaggggtt [25] |
520 |
| 5 | β-ACTIN (NM_001101.3) |
25pmol | F: ggcatcgtgatggactccg R: gctggaaggtggacagcga [26] |
540 |
| 6 | MAGEA3/A6(NM_005362.3 NM_005363.2)* | 25pmol | F: ggaggcaagcttctgag R: caggcttgcagtgctga# |
175 |
| 7 | MAGEC1 (NM_005462.4) |
25pmol | F: atccagtcttcaaggtgctc R: agaacgactctgaggactctg# |
330 |
Table 1: Primers used for qualitative CTA PCR analysis
Development of the qualitative CTA expression assay
The molecular assay was developed to simultaneously assess the expression of 7 CTA genes from a single RNA sample: PRAME, MAGEC1, MAGEA3, PAGE, BAGE2, NYESO1, and SSX2, allowing the relationship between the genes to be investigated (as shown in Figure 1). Several controls, including human testis RNA (Clontech, USA), human tonsil RNA (plasma cell progenitors [27]; Clontech, USA), as well as 5 donors PB and BM samples (including CD34+ purified cells) were used to confirm the integrity of the results and link the CTA expression directly to diseased cells and human testis tissue only. A previous study, using flow cytometry to detect MAGEC1 in PB and BM samples, showed that malignant CTA expression in MM is associated with early stem cells (CD34+) and early pro-B to pre-B cells (CD34+/−/CD19+), with only the proliferating compartment of plasma cells expressing the malignant marker [28]. Amplicon sequencing confirmed detection of the correct transcript with this assay using both human testis RNA and MM patient RNA. The assay demonstrated a detection sensitivity of approximately 1% (1:100 human testis/donor PB RNA).
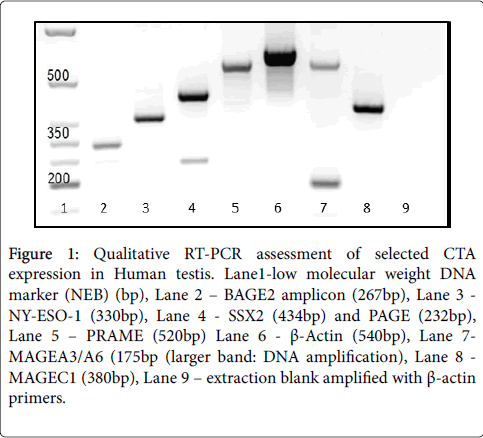
Figure 1: Qualitative RT-PCR assessment of selected CTA expression in Human testis. Lane1-low molecular weight DNA marker (NEB) (bp), Lane 2 – BAGE2 amplicon (267bp), Lane 3 - NY-ESO-1 (330bp), Lane 4 - SSX2 (434bp) and PAGE (232bp), Lane 5 – PRAME (520bp) Lane 6 - β-Actin (540bp), Lane 7- MAGEA3/A6 (175bp (larger band: DNA amplification), Lane 8 - MAGEC1 (380bp), Lane 9 – extraction blank amplified with β-actin primers.
Links between the number of CTAs expressed and disease characteristics
The majority of the patients diagnosed during the research period were MM patients referred from local primary health clinics (Figure 2), and consequently most were classified as stage III according to classical DSS methods. We were hoping to be able to provide an objective tool for clinicians to be able to sub-stratify these stage III patients for more effective management with this study. In total, 39 patients were included, representing the continuum from MGUS to SMM: 5 MGUS, 8 stage I, 5 stage II and 21 stage III MM patients. The distribution of Ig subtype in the patient population correlated well with previous studies [29], with a slight male gender bias of 1.2:1 for this cohort also being typical for MM reported cases internationally [30]. The considerably earlier average age of only 59.4 yrs (33-84 yrs range) compared to 69 was however unexpected [31].
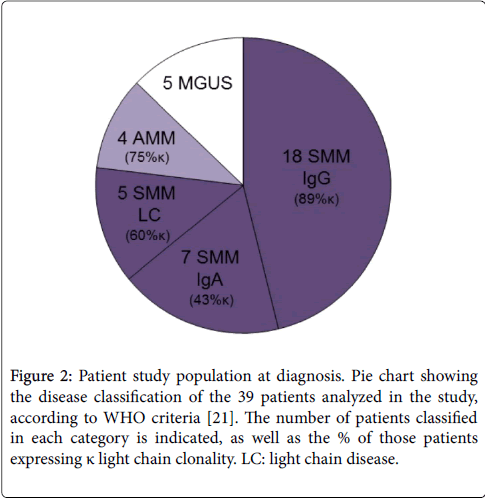
Figure 2: Patient study population at diagnosis. Pie chart showing the disease classification of the 39 patients analyzed in the study, according to WHO criteria [21]. The number of patients classified in each category is indicated, as well as the % of those patients expressing κ light chain clonality. LC: light chain disease.
The expression of CTAs, disease classification, staging and CRAB symptoms at diagnosis for each patient is summarized in Figure 3. All 30 of the SMM patients, expressed at least one of the CTA panel members, namely MAGEC1. There was a strong association (R2 = 0.74) between the number of CTAs expressed and the stage of the disease as characterized by the DSS method, with the expression of 1-2 CTAs only observed in stage I and II disease, while all stage III patients expressed 3-6 genes at diagnosis. This association was further strengthened by the increase in the number of CTAs expressed by two AMM patients who progressed to MM within 12 months, both showing no CTA expression at initial diagnosis and 3 (stage II) and 6 (stage III) genes, respectively at follow up. With regards to disease subtype, light chain MM disease is known to offer a worse prognosis [32,33], with rapid kidney failure. While we only had 5 patients in this grouping at diagnosis, all presented with advanced disease (stage III, 3-4 CRAB symptoms) and correspondingly expressed 5-6 CTAs (Figure 2).
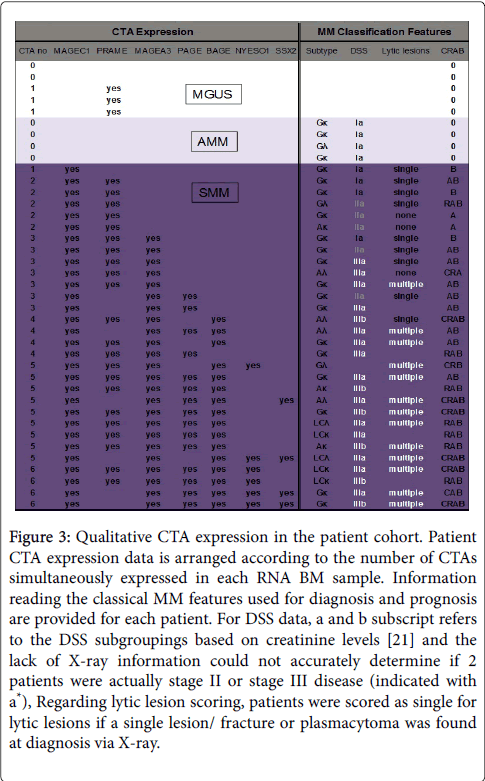
Figure 3: Qualitative CTA expression in the patient cohort. Patient CTA expression data is arranged according to the number of CTAs simultaneously expressed in each RNA BM sample. Information reading the classical MM features used for diagnosis and prognosis are provided for each patient. For DSS data, a and b subscript refers to the DSS subgroupings based on creatinine levels [21] and the lack of X-ray information could not accurately determine if 2 patients were actually stage II or stage III disease (indicated with a*), Regarding lytic lesion scoring, patients were scored as single for lytic lesions if a single lesion/ fracture or plasmacytoma was found at diagnosis via X-ray.
Due to the clear association between disease progression and the number of CTAs expressed, the biological parameters used for staging and defining the CRAB scoring (a direct indicator of disease progression) in MM patients were further analyzed, showing that the increasing number of CTA mRNAs detected showed good correlation with the severity of the CRAB defining features (Figure 4A). Figure 4A shows the linear correlation between the severity of the anemia, the increase in B2M and increasing leached calcium levels with the number of CTAs expressed. Clinically high creatinine was only associated with the expression of 5-6 CTA’s (all stage III disease), indicating a possible subgroup. In addition, the majority of patients presenting with multiple lytic lesions (86%), again a poor prognostic indicator, grouped together, expressing 4-6 CTAs (Figure 3).
Serum M-protein and UBJP are an indication of tumor burden and thus stage of disease and are regularly used to monitor patient therapy progress. Figure 4B shows the relationship between these protein levels and the number of CTAs expressed. The serum M-protein levels rapidly increased as the CTA number increased from 0-3 and then remained at a high level for patients expressing 4-6 CTAs. For patients in this group (4-6 CTAs), this correlated as expected with a sharp spike in the UBJP levels (>1), which is associated with renal damage as the IgM levels rise. Another indicator of tumor burden is the plasma cell load in the BM. However, Figure 4B shows that no clear relationship was observed between the percentage of plasma cells in the BM aspirate and the number of CTA mRNAs detected. The quantification of plasma cells in the aspirate or BM trephine is however highly dependent upon the area sampled and can be inaccurate.
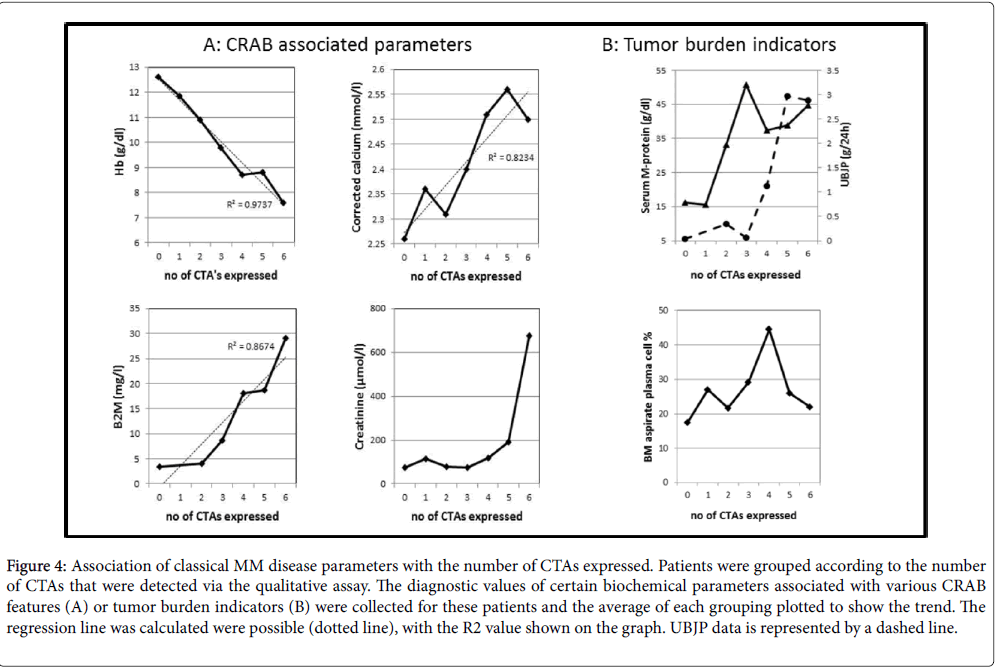
Figure 4: Association of classical MM disease parameters with the number of CTAs expressed. Patients were grouped according to the number of CTAs that were detected via the qualitative assay. The diagnostic values of certain biochemical parameters associated with various CRAB features (A) or tumor burden indicators (B) were collected for these patients and the average of each grouping plotted to show the trend. The regression line was calculated were possible (dotted line), with the R2 value shown on the graph. UBJP data is represented by a dashed line.
The characteristics of the plasma cells, including their presence in the PB, proliferation status and their abnormal nuclear staining are additional independent prognostic factors that can be considered. Circulating plasma cells, which is indicative of more aggressive disease [33,34] were only observed in 9 patients, 78% of whom presented with stage III disease.
However, this subgrouping showed no specific CTA expression pattern (in number or specific gene). There was also no association of specific CTA expression to plasma cell proliferation (PCPI) (results not shown) or the aneuploidy status of the patient’s plasma cell population, with all patients analyzed having the hyperdiploid status.
Expression profiles of specific CTAs in MM
Two specific CTAs, namely MAGEC1 and BAGE, were found to be the most informative. Firstly, MAGEC1 expression was strongly linked to a diagnosis of all SMM patients while no MGUS or AMM patients showed detectable transcript at diagnosis (Figure 3). Secondly, BAGE2 expression was specifically linked with stage III disease and significantly associated with poor hematological parameters. This was demonstrated by the mean values for this patient group all falling within the WHO classification for all of the CRAB symptoms [21], indicating an association with advanced disease and a worse prognosis (Table 2).
| Biochemical parameter | Mean (Range) BAGE2+ | Mean (Range) BAGE2- | p value# |
| UBJP (g/24hrs) | 2.45(0.50-6.83) | 0.15 (0.00-0.96) | 0.0009 |
| Hb(g/dl) | 8.6* (6.8-9.7) | 11.09 (7.2-14.1) | 0.0016 |
| B2M (mg/l) | 21.6(9.0-34.7) | 6.0 (2.3-10.5) | 0.0028 |
| Corrected Calcium (mmol/l) | 2.57* (2.12-3.41) | 2.33 (2.19-2.79) | 0.0222 |
| Creatinine (µmol/l) | 257* (58-1250) | 75 (55-116) | 0.0267 |
| Serum M-protein (g/l) | 44.3(25.8-68.6) | 35.6 (11.5-48.9) | 0.2543 |
| Albumin (g/l) | 32 (49-23) | 34 (49-20) | 0.6976 |
| LDH (U/l) | 370 (177-681) | 373 (242-528) | 0.9503 |
Table 2: Biochemical characteristics of MM patients expressing BAGE2.
Several biological parameters showed a significant difference between the BAGE2+ and BAGE2- groups (p˃0.05), with the levels of UBJP, B2M and Hb showing the highest significant difference (p˃0.005) (Table 2). Interestingly, 88% (7/8) of patients with high PB calcium levels belonged to this BAGE2+ cohort, which not surprisingly also included 92% of the 13 patients with confirmed multiple lytic lesions. The patients in the BAGE2+ cohort also exhibited the highest indicators for renal damage in the total MM cohort, with creatinine and B2M levels as high as 1250 μmol/l and 34.7 mg/l respectively. No significant difference was however found with regards to the association of BAGE2 expression with lower albumin or increased lactate dehydrogenase (LDH) levels (Table 2), both of which have been reported to be associated with a worse prognosis [35,36].
While the other CTAs in the panel did not show such clear associations as MAGEC1 and BAGE2, the expression results still showed potential value of which PAGE was of particular interest. PAGE was expressed in half of the SMM patients at diagnosis and although PAGE has not been previously investigated in MM disease, we show that it is fairly commonly expressed in mainly more advanced disease patients (87% classified as stage III disease). While its expression does not as clearly define distinct groupings as BAGE2, the PAGE+ patients do still present with significantly worse anemia (Hb ˂10 g/dl) and significantly higher UBJP and creatinine levels indicating renal damage (Table 3) than the PAGE- patients.
| Biochemical parameter | p value* PAGE | p value# BAGE2 |
| Elevated creatinine (µmol/l) | 0.0174 | 0.0267 |
| Elevated UBJP (g/24hrs) | 0.0087 | 0.0009 |
| Reduced Hb (g/dl) | 0.0164 | 0.0016 |
| Elevated B2M (mg/l) | 0.1420 | 0.0028 |
| Elevated Corrected Calcium (mmol/l) | 0.3956 | 0.0222 |
Table 3: Biochemical parameters in MM patients: Significance of BAGE2 and PAGE expression.
MAGEA3 occurred in 79% of SMM patients and was again associated with advanced disease [17,19] with 21/23 patients in this cohort diagnosed with stage III MM. There was a very strong correlation between expression of this CTA and anemia (p ˂0.0005), with an average Hb value of 9.0 for this group. However, there was less statistical difference between the MAGEA3 positive and negative groups compared to BAGE2 expression for all the other haematological parameters (all p values ˃0.02).
NYESO1 and SSX2 expression was only associated with stage III disease, specifically with advanced renal damage (creatinine ave 442 μmol/l units and abnormal calcium ave: 2.67 mmol/l) and extensive bone deterioration (multiple lytic lesions). The co-expression of NYESO1 and/or SSX2 and BAGE2 did show a slight increase in the levels of creatinine and calcium (p ˂0.5) over the BAGE2 only cohort, indicating that these CTAs may be useful in stratifying the stage III group of patients.
Association between CTAs
Ordering the patients according to the number of CTAs expressed (Figure 3) and the above observations of both the number and specific CTAs being associated with more advanced disease, illustrated a possible progressive pattern of CTA expression during the disease pathogenesis. This hypothesis was further strengthened by the strong association of specific CTAs to co-expression with others; for example all patients expressing BAGE2 or PAGE co-expressed MAGEC1 and MAGEA3, while 75% (12/16) patients expressing BAGE2 also expressed PAGE (Figure 2).
Looking at these associations, a possible cascade-like effect appears to be associated with disease progression (Figure 5). Interestingly 2 distinct patterns of expression were observed when 6 CTAs were expressed in the stage III patients, namely those defined as light chain disease, who expressed MAGEC1, PRAME, PAGE, BAGE, MAGE A3 and NYESO1 and IgG Kappa patients expressing MAGEC1, PAGE, BAGE MAGE A3, NYESO1 and SSX2. The numbers of patients in these groupings were too small to make any significant findings, but this may suggest a difference in the disease pathogenesis of these sub types.
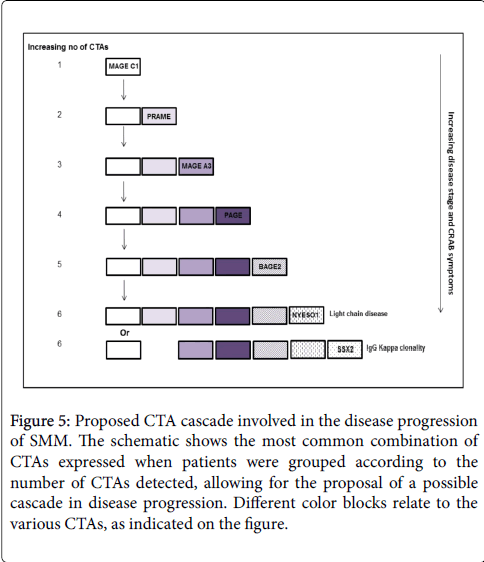
Figure 5: Proposed CTA cascade involved in the disease progression of SMM. The schematic shows the most common combination of CTAs expressed when patients were grouped according to the number of CTAs detected, allowing for the proposal of a possible cascade in disease progression. Different color blocks relate to the various CTAs, as indicated on the figure.
There are a number of factors at diagnosis of MM that can influence a patient’s overall prognosis, including response to specific therapy in MM and survival statistics. The data that needs to be accumulated at diagnosis to establish prognosis can be exhaustive, including standard/ specialized biochemical tests, cytogenetics, specialized staining/flow cytometry and extensive X-ray/MRI analysis [4-7]. Unfortunately, for a variety of reasons, this plethora of data is regularily not available and a clinician may be faced with not even being able to accurately stage the patient, the very basic of prognostic indicators. This is particularily a problem in our tertiary state hospital environment in South Africa (SA), where patients are referred from a local clinic. Often important preliminary data is not acquired or transferred to the hospital clinican and the initiation of treatment at these facilities then prevents the acquistion of important diagnostic biochemical parameters for successful managment. This is then compounded by the lack of full skeletal surveys, inability to obtain sufficient 24 hr urine samples and specialised assays requests, as well as the difficulty in obtaining cytogenetic data due to the non-proliferative nature and low count of the plasma cells in the majority of the patients at diagnosis. Although these problems are not issues in a large clinical trial setting, they are not unique to our institution and standard MM patient care suffers as a consequence. It is therefore imperative that a simple and quick assay is designed to summarise as much of the data as possible, giving the clinican an easy-to-interpret analysis of the disease stage of the patient and possible high risk indications to help guide the clinician more effectively. The aim of our study was to link the expression of specific CTAs to known prognostic factors to establish a molecular panel that could be used to simplify risk stratification. The use of large genetic panels is useful in research environments, but more focused panels are preferential in a diagnostic environment, where their accuracy/ reproducibility and cost can be more easily controlled and therefore the data of more clinical relevance. Thus we chose 6 CTAs that have previously been shown to be commonly expressed in MM patients, namely PRAME, MAGEC1, MAGEA3, BAGE2, NYESO1, and SSX2 and looked at the simultaneous expression of these genes along with PAGE, a CTA not yet examined in MM. Most of these CTAs have previously been studied in isolation or as a small grouping, with researchers trying to associate the link of gene expression to specific prognostic indicators. Unfortunately, most of the results are contradictory, with the exception of the expression of multiple CTAs, which has been loosely linked with some indicators of advanced disease [17,18,20,37-40]. Defining whether these genes are associated with specific symptoms of the disease (comprehensive biochemical assessment) and if expression is useful in sub-classifying different disease stages has not yet been clarified.
Using our specific 7 CTA panel we found very good correlation between the number of CTAs expressed and the stage of the disease, in agreement with other studies [17,18,20,37-40]. More importantly, we found significant correlation specifically with the severity of the symptoms. In summary, the expression of 1-2 CTAs was only observed in stage I and II disease, while all stage III MM patients expressed 3-6 genes at diagnosis. There was a linear correlation between the number of CTAs expressed and the severity of the anemia, B2M levels and calcium levels, with patients expressing 4-6 CTAs demonstrating worse biochemical features and a link to poor prognostic indicators [6,41,42]. The increase in serum M-protein followed by detectable UBJP also correlated with the increase in CTA expression, with high immunoglobulin levels and thus a high disease burden being present in patients expressing 4-6 CTAs. The expression of 5-6 CTAs represented the patients with the highest creatinine and calcium levels, and thus worse end-organ damage. This could possibly indicate that disease progression could be enumerated by the number of CTAs expressed in this panel and could be used to re-evaluate patients if disease progression is suspected.
Only a small group of patients represented either the IgA or light chain disease subtypes, both of which are associated with a worse overall survival [33,34]. While no significant associations could be found regarding the IgA grouping, due to low numbers, the light chain diseased patients all grouped together expressing 5-6 CTAs and demonstrated advanced clinical symptoms. While this result strengthened the association of increased CTA expression with more aggressive/progressive disease, it unfortunately also indicated that the light chain diseased patients could not be further risk-stratified using this approach.
When looking at the expression of individual CTAs in the panel, there appeared to be a definite progression or cascade-like effect, with different CTAs being associated with more severe biochemical parameters. MAGEA3 expression for example was highly associated with anemia, while PAGE expression was associated with anemia and high creatinine levels as well as stage III disease. BAGE2 expression was only associated with stage III diseased patients and worse clinical features, with all biochemical parameters for this grouping representing WHO defined CRAB features [21], potentially representing a subgroup within the stage III patients. Finally, the expression of SSX2 and/or NYESO1 characterized a further sub grouping within the stage III patients, representing those with light chain disease and the patients with the greatest end-organ damage. Our findings strongly support the hypothesis that CTA expression plays a role in disease pathogenesis similar to previous studies that have shown the association of co-expression and poor outcome [18,32], thus making these genes interesting as disease targets and monitoring tools. We propose that the following pattern of expression occurs during disease: MAGEC1 - PRAME - MAGEA3 - PAGEBAGE2 - NYESO1/SSX2. The idea of a cascade-like expression of CTAs has been previously suggested [17,38], with their role being linked with promoting the survival of MM cells by decreasing transcription factors that control cell proliferation or induce apoptosis and regulation of cell signalling and gene transcription [17,19,20,43,44].
Other than disease stage, subtype, severity of the CRAB features and end-organ damage indicators, other independent factors have been previously associated with high risk patients. These include a high PCPI [42,45], specific cytogenetic abnormalities and aneuploidy status of the plasma cells [46]. As mentioned earlier, these results are easily available in a clinical trial setting, however in standard health care facilities in SA access to these specialized tests is very limited. While standard karyotyping and FISH analysis of chromosome 13 and 14 rearrangements is being performed routinely in our institution, many MM patient samples are unsuccessful and thus this was not included in our current study and reflects the limited cases were this testing is of clinical relevance. All patients analyzed for aneuploidy showed either a normal or hyperdiploid status, which therefore did not allow us to associate poorer non-hyperdiploid status prognostic factor with CTA expression, but also importantly demonstrated its limited prognostic impact in our clinical environment. While the PCPI did vary amongst patients, we were unable to associate a specific CTA expression pattern to the patients expressing a positive PCPI, indicating that this gene panel cannot represent this particular independent risk factor.
In conclusion, we suggest that a molecular CTA expression panel consisting of MAGEC1, MAGEA3, PAGE, BAGE, NYESO1 and SSX2 can be used at diagnosis as a single test to clearly group patients into stage I and stage III disease, with further risk stratification within the stage III patients. MAGEC1 only – stage I, MAGEC1/MAGEA3 onlystage II, MAGEC1/MAGEA3/PAGE – stage II/early stage IIIa, BAGE expression – more advanced stage IIIb and NYESO1/ SSX2 and BAGE expression – advanced stage IIIc subgroup. Using the expression of these CTAs as a guide it may then also allow clinicians to reassess patient staging at a later stage. While treatment options are limited in SA, being able to prognosticate patients still plays a critical role in patient management and this molecular panel will simplify this process. While more patients need to be analysed to strengthen our findings, the association of MAGEC1 with all SMM patients, regardless of disease stage, allowing easy discrimination between patients that need immediate therapy versus AMM patients. The expression of this antigen in all of our SMM patients also suggests that it may prove to be a very useful marker in monitoring minimal residual disease in patients, where previously a common genetic marker has been elusive and we are currently investigating this possibility.
This research was funded by the following agencies in SA: National Health laboratory Services Research Trust, CANSA and the Medical Research Council SA. In addition funding was also obtained from AstraZeneca.