Journal of Osteoporosis and Physical Activity
Open Access
ISSN: 2329-9509
ISSN: 2329-9509
Research Article - (2014) Volume 2, Issue 1
Aim of the study: To examine the bone mineral density (BMD) in Bulgarian patients with type 1 diabetes mellitus (DM) in comparison to age- sex- and ethnically matched healthy controls and its correlation with bone turnover markers: oteocalcin as a marker of bone formation and deoxypyridinoline cross-laps as bone resorption marker.
Materials and methods: 162 patients with type 1 DM (97 females and 65 males) age 29.17 yrs. (20-40) and 200 (100 women and 100 men) age- and sex matched healthy controls were analyzed for BMD and Z-score of lumbar spine and femoral neck by dual X-ray absorptiometry (DXA) using Lunar DPX-A. Plasma levels of osteocalcin and urine levels of deoxypyridinoline cross-laps were determined.
Results: BMD in type 1 DM showed statistically significant lower levels for lumbar spine L1-L4- men (1.2114 g/ cm2 ± 0,1587 DM vs. 1.3346 g/ cm2 ± 0,1635 controls, P<0.05) and L1-L4 women (1.1035 g/cm2 ± 0.1269 DM vs 1.1978 g/ cm2 ± 0,1269 controls, P<0.05) and femoral neck - men (0.9138 g/cm2 ± 2134 DM vs 0.9868 g/ cm2 ± 0.1534 controls, P<0.05) and women (0.8656 g/cm2 ± 0.1223 DM vs 0.9236 g/ cm2 ± 0.145 controls, P<0.05) in both sexes in comparison with that in control group. We found no statistically significant difference for osteocalcin levels as a marker of bone formation in both groups (P=0.062), while deohypyridinoline (DPD) levels as a marker of bone resorption were significantly higher (P<0.01) in diabetic patients in comparison with age and sex matched controls. Osteocalcin showed significant negative correlation with BMD at lumbar spine (r=-0.418; P=0.004) and nonsignificant negative correlation with that at femoral neck (r=-0.271; P=0.078) in diabetic patients. DPD showed nonsignificant correlations with BMD at lumbar spine (r=-0.024; P=0.846) and at femoral neck (r=0.143; P=0.259) in diabetic patients.
Conclusions: BMD measured at lumbar spine and femoral neck was significantly lower in patients with type 1 DM than in age-and sex matched controls. Levels of the bone turnover markers indicate increased bone resorption as a reason for the decreased bone mineral content in diabetic patients. Prospective studies are needed to determine whether metabolic control of diabetes has any influence upon the observed bone changes and whether keeping good metabolic control can minimize the reduction of the bone mineral content like it happens with the diabetic microangioapthy. If we consider the reduction of the BMD to be a specific complication of type 1 diabetes mellitus than we should take appropriate measures to cope with this problem like stressing upon the importance of appropriate diet adequate physical activity especially at the time peak bone mass is being accumulated.
<Keywords: Diabetic microangioapthy; Osteocalcin; Bone resorption marker
In 2004 the prevalence of diabetes mellitus (DM) for all age-groups worldwide was estimated to reach 4.4% with 366 million suffering from the disease in 2030 [1]. The more recent data from International Diabetes Federation show that these figures are already exceeded with 382 million people having diabetes in 2013 and by 2035 this will rise to 592 million [2]. Patients with type 1 diabetes accounts for 5-10% of those with diabetes [3]. Nevertheless at their majority these are young active people and with the expected increase in the absolute number and the life expectancy of patients with DM on the forefront comes the risk of developing complications different than that typical for the disease and so far considered of no such great importance, like diabetic bone changes for example. More than 60 years ago Albright and Reifenstein showed that diabetes mellitus is associated with low bone mineral density [4]. Since then the correlation between diabetes mellitus and bone changes is a subject of extensive research, but results so far are inconclusive. Various disorders of calcium metabolism in diabetic patients are described, such as impairment of calcium absorption in the intestine, increased urinary loss of calcium followed by development of secondary hyperparathyroidism and bone loss [5-7]. Bone turnover in diabetes is characterized with osteoblast deficiency and therefore impaired bone formation is not capable to compensate for normal or increased bone resorption. The proposed reason for this is the deficiency of insulin and insulin-like growth factors [8-11]. However the effect of the higher levels of glucose upon osteoblasts cannot be excluded. Data from in vivo and in vitro studies show that high glucose impairs osteoblast function by causing intracellular accumulation of sorbitol or by generating higher concentration of Advanced Glycation End products (AGEs) in collagen that may reduce bone toughness [12-16]. Additional factors in diabetic osteopenia can be important like impaired blood perfusion to bone due to macroangiopathy and decreased mechanical stress on bone, due to neuropathy and myopathy [17]. Another reason for diabetic osteopenia in type 1 DM can be accumulated low peak bone mass during puberty partly due to osteoblast dysfunction, partly to the specific requirements of the diabetic diet and reduced physical activity. Generally diabetes mellitus type 1 is associated with reduced bone mineral density while in different studies patients with type 2 are found to have normal, decreased or even increased bone mineral density [18-26]. Due to the different pathogenic mechanisms for the development of type 1 and type 2 DM there is no single entity of “diabetic osteopathy”. Whether the bone changes in diabetes mellitus are associated with increased fracture risk is a matter of debate the risk of hip fracture in type 1 DM appears to be increased although studies of fractures in those with type 1 diabetes are limited. Two cohort studies reported a 4-12- fold increase in the risk of hip fracture [27,28]. However, two previous casecontrol studies did not find evidence of increased risk [29,30]. Several studies showed that in patients with type 1 diabetes mellitus there is an increased risk for all non-vertebral fractures and in particular for hip fractures [27,31]. Diabetes mellitus type 2 is associated with increased risk for hip fractures only in women [32]. In general in all patients on insulin therapy there is an increased risk for hip fractures [33].
| Variable | Women with DM | Women without DM | P | Men with DM | Men without DM | P |
|---|---|---|---|---|---|---|
| n | 97 | 100 | 65 | 100 | ||
| Age (years) | 29.17 ±6.65 | 27.17 ±5.43 | P=0.623 | 28.09 ±4.42 | 29.56 ±6.76 | P=0.721 |
| BMI (kg/m2) | 22.864±2.5 | 24.643±2.7 | P=0.132 | 24.95±3.43 | 26.76±4.32 | P=0.083 |
Data are presented as mean ± SEM.
Table 1: Demographic and clinical characteristics of patients with type 1 diabetes mellitus and healthy controls.
| Variable | Women with diabetes mellitus n=97 | Controls n=100 |
|---|---|---|
| BMD L1L4 g/cm2 | 1,10 ± 0,126* | 1,20± 0,126 |
| Zscore | - 0,4857 ± 0,981 | - 0,1832 ± 0,981 |
| BMD femoral neck g/cm2 | 0,86 ± 0,122* | 0,92 ± 0,145 |
| Zscore | - 0,8534 ± 1,025 | - 0,3423 ± 1,032 |
| BMD Ward g/cm2 | 0,81 ± 0,158 | 0,85 ± 0,235 |
| Zscore | - 0,6898 ±1,220 | - 0,5568 ± 0.356 |
| BMD trochanter g/cm2 | 0,68 ± 0,100** | 0,82 ± 0,123 |
| Zscore | - 0,9003 ± 0,896 | - 0,4876 ± 0,569 |
* P<0.05 ; ** P<0.01.
Table 2: Bone mineral density of lumbar spine with region of interest L1-L4 g/cm2 and proximal hip in women with diabetes mellitus and in healthy controls.
Study population
This study was a cross-sectional observational study. The patients recruited were those with type 1 diabetes mellitus residents of Plovdiv and surrounding neighborhoods. We used our own database or referral from other physicians. Eligible participants were 65 men and 97 women who met the following inclusion criteria: diagnosed with type 1 diabetes mellitus (according to the ADA criteria) for at least one year; aged ≥ 20 and ≤ 40 years; BMI ≥ 19 kg/m2 and current insulin treatment with duration for at least a year.
The following exclusion criteria were applied: history of type 2 diabetes, thyroid and parathyroid disorders, treatment with drugs that can affect bone metabolism /levothyroxine, corticosteroids, benzodiazepines, vitamin D etc/, current pregnancy or lactation, menopause, estimated glomerular filtration rate (eGFR) < 60 ml min-1 or serum creatinine ≥ 124 μmol/l (men) or ≥115 μmol/l (women)] ALT ≥ 2.5 times above the reference range.
The study was conducted in accordance with ethical principles and the study protocol was approved by the local review board. All participants provided written informed consent before taking part in the study.
We used age-, sex- and ethnically matched control group of 200 (100 women and 100 men) clinically healthy individuals.
Statistical analysis
Data presented are mean ± SEM for comparison between groups. Analyses were performed using SPSS (PASW Statistics, Chicago, IL, USA). We performed Kolmogorov-Smirnov Test to test for the normal distribution of the data. The comparison between BMD at different skeletal sites in patients with diabetes and healthy controls in both sexes was examined by t-test for normally distributed variables. The association between bone mineral density and bone turnover markers were examined by linear regression analysis using Pearson`s correlation coefficients. A value of P<0.05 was considered significant.
Demographic and clinical characteristics of patients with type 1 diabetes mellitus and healthy controls are presented in Table 1.
Dual-X-ray absorptiometry
Bone mineral density (BMD) was measured by central dual-energy x-ray absorptiometry (DXA) (DPX-A X-ray Bone Densitometer, version 1.13, LUNAR Corp. USA). We followed a precise protocol for calibration and quality control of the device in vitro by scanning the supplied phantom - at least 3 times a week and before each measurement of bone mineral density of the included subjects. The coefficient of variation (CV) that showed the short-term reproducibility of the acquired osteodensitometric results of bone mineral density (CV from 0.13-0.48, average - 0.36%) was calculated [34]. Daily quality control was carried out according to the rules pointed in Multirule Shewart Charting. For the assessment of the bone mass we used the absolute values of bone mineral density presented in g/cm² and the so called Z-score (number of standard deviations the patient`s BMD differ from age- sex- matched reference value). A Z-score of -2.0 or lower was defined as “below the expected range for age” and a Z-score above -2.0 was “within the expected range for age”. Because of the age characteristic (20-40 yrs.) of the study groups it was inappropriate to use T-score to determine BMD changes and WHO classification of osteopenia and osteoporosis could not be applied. Bone mineral density was measured at the following regions of interest: lumbar spine /L1-L4 in PA position/ and left proximal hip / femoral neck, Ward` s area and greater trochanter/. All the measurements were performed by one technologist to minimize the possible precision error.
We examined osteocalcin plasma levels in patients` blood samples drawn at fasting condition by using hOST-EASIA (BioSorce Europe S.A). Samples were stored frozen (-20°C) until testing. The excretion of deoxypyridinoline (DPD) crosslinks as an indicator of bone resorption was examined in the first morning void urine collections by MicroVue DPD EIA. All the samples were collected prior 10.00 am to avoid diurnal variations and kept frozen (-20°C).
| Z-score | Femoral neck | Ward | Trochanter | L1-L4 | ||||
|---|---|---|---|---|---|---|---|---|
| n | % | n | % | n | % | n | % | |
| Z-score < -2.0 | 61 | 62.88 | 75 | 58.76 | 57 | 77.31 | 63 | 64.9 |
| Z-score > - 2.0 | 36 | 37.11 | 22 | 41.23 | 40 | 22.69 | 34 | 35.1 |
Table 3: Distribution of diabetic women according to Z-score of BMD g/cm2 at different skeletal sites.
| Variable | Men with diabetes mellitus n-65 | Controls n-100 |
|---|---|---|
| BMD L1L4 g/cm2 | 1.21 ± 0,158* | 1.33 ± 0.163 |
| Zscore | - 0.7948 ± 0.892 | - 0.2823 ± 0.665 |
| BMD femoral neck g/cm2 | 0.91 ± 0.213* | 0.99 ± 0.153 |
| Zscore | -1.0885 ± 1,012 | -0.3923 ± 0.133 |
| BMD Ward g/cm2 | 0.91 ± 0.165 | 0.99 ± 0.345 |
| Zscore | -0.8698 ± 1.212 | -0.4468 ± 0.366 |
| BMD trochanter g/cm2 | 0.74 ± 0.131** | 0.93 ± 0.231 |
| Zscore | -1.4203 ± 0.978 | -0.5476 ± 0.346 |
* P<0.05 ** P<0.01.
Table 4: Bone mineral density of lumbar spine with region of interest L1-L4 g/cm2 and proximal hip in men with diabetes mellitus and healthy controls.
| Z-score | Femoral neck | Ward | Trochanter | L1-L4 | ||||
|---|---|---|---|---|---|---|---|---|
| n | % | n | % | n | % | n | % | |
| Z-score < -2.0 | 46 | 70.7 | 55 | 84.6 | 45 | 69.2 | 48 | 73.8 |
| Z-score > - 2.0 | 19 | 29.3 | 10 | 15.4 | 20 | 30.8 | 17 | 26.2 |
Table 5: Distribution of male patients according to Z-score of BMD L1-L4 g/cm2 and proximal femur.
| BMD neck g/cm2 | BMD trochanterg/cm2 | BMD Ward g/cm2 | |
|---|---|---|---|
| BMD L1L4 g/cm2 | 0.688** | 0.681** | 0.672** |
| BMD neck g/cm2 | 0.862** | 0.928** | |
| BMD trochanterg/cm2 | 0.797 ** |
** P<0.01.
Table 6: Correlation (r) between BMD of the examined skeletal sites.
| Variable | Diabetes Mellitus | Controls |
|---|---|---|
| Osteocalcinng/ml(ẍ±Sẍ) | 6.752 ± 4,297 | 8.765 ± 5.342 |
| DPDnmol/mmolCr (ẍ±Sẍ) | 9.3382 ± 6.989* | 6.452 ± 4.989 |
* P<0.05.
Table 7: Values of the bone turnover markers in patients with diabetes and control group.
Results of the measurement of bone mineral density of lumbar spine and proximal hip in women with type 1 diabetes mellitus and that in age and sex matched healthy controls are presented in Table 2. All results are presented as mean ± standard error (? ± S?).
BMD showed lower values in all regions of interest of the lumbar spine and proximal femur in diabetic women in comparison to healthy controls. The difference for the BMD of the L1-L4 (P<0.05), femoral neck (P<0.05) and greater trochanter (P<0.001) was statistically significant. Distribution of women with DM according to Z-score is shown in Table 3. In healthy controls no women showed BMD with Z-score lower more than - 2 SD.
These data showed that there was a statistically significant lower BMD of the lumbar spine, the neck of the femur and the greater trochanter in women with diabetes mellitus in comparison to healthy controls. The difference was more pronounced for BMD of the proximal femur where a higher percentage of individuals presented with lower than expected bone mass in comparison to BMD of the lumbar spine.
Results of the measurement of bone mineral density of the lumbar spine and the proximal hip in men with diabetes mellitus and healthy age- and sex matched controls are presented in Table 4. All results are expressed as mean ± standard error (? ± S?).
In men with diabetes mellitus bone mineral density L1-L4 was with 0.1232 g/cm2 lower on average in comparison to that in controls. The difference was statistically significant like in the women’s group (P<0.05). Distribution of male patients according to Z-score of lumbar spine and proximal femur is presented in Table 5.
We found statistically significant lower BMD of the femoral neck and greater trochanter in men with diabetes mellitus in comparison to that in healthy controls (P<0.01) and the difference was the same at the two examined areas. In the group of healthy men no values of BMD showed Z-score below -2.0 SD.
There was a significant correlation of BMD measured at the two different skeletal sites, which indicated that for the general practice the assessment of BMD in patients with diabetes mellitus type 1 can be done at either site (Table 6).
Results of the values of bone turnover markers in diabetic and control groups are presented in Table 7. We found no statistically significant difference for osteocalcin levels as a marker of bone formation in both groups (P= 0.062), while deohypyridinoline crosslinks (DPD) levels as a marker of bone resorption were significantly higher (P< 0.05) in diabetic patients in comparison with age and sex matched controls. All results are expressed as mean ± standard error (x ± Sx).
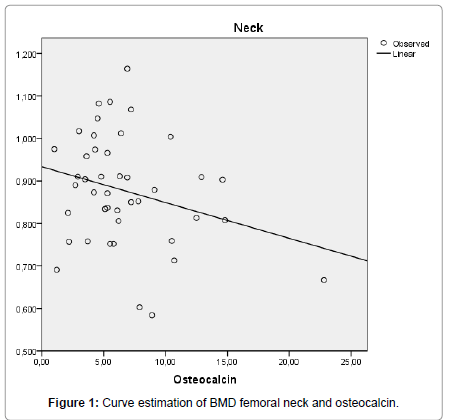
Figure 1:Curve estimation of BMD femoral neck and osteocalcin.
Osteocalcin showed significant negative correlation with BMD at lumbar spine (r= -0.418; P= 0.004) and nonsignificant negative correlation with that at femoral neck (r= -0.271; P= 0.078) in diabetic patients. Regression analyses of BMD L1-L4 and femoral neck with osteocalcin are presented on Figures 1 and 2. DPD showed nonsignificant correlations with BMD at lumbar spine (r= -0. 024; P=0.846) and at femoral neck (r=0.143; P=0.259) in diabetic patients.
Our data showed that patients with diabetes mellitus type1 of both sexes have a reduced BMD for lumbar spine and proximal hip in comparison to the age and sex matched healthy controls with a significant proportion of patients with diabetes having Z score below -2.0 at both skeletal sites. Taking into account the data from different studies showing increased fracture risk in patients with type 1 diabetes we can consider type 1 diabetes mellitus as an important risk factor for secondary osteoporosis and propose regular examination of the bone mineral density in these patients. BMD can be examined at both sites of the axial skeleton due to the significant correlation of the osteodensitometric results. Our data showed that observed low bone mineral density in diabetic patients was associated with increased bone resorption. Osteocalcin levels showed statistically significant negative correlation with the BMD of lumbar spine built up mainly of cancellous bone with high metabolic activity and nonsignificant negative one with the BMD of femoral neck suggesting an unsuccessful attempt of osteoblasts to compensate for the increased bone resorption. As far as osteocalcin indicates osteoblastic function in patients with diabetes the bone formation proves to be inefficient enough to compensate for the bone resorption. Prospective studies are needed to determine whether metabolic control of diabetes has any influence upon the observed bone changes and whether keeping good metabolic control can reduce the observed bone loss like it happens with the diabetic microangioapthy. If we consider the reduction of the BMD to be a complication of type 1 diabetes mellitus than we should take appropriate measures to cope with this problem like stressing upon the importance of appropriate diet containing enough amounts of calcium and vitamin D and adequate physical activity especially at the time peak bone mass is being accumulated and if maintaining good metabolic control proofs in future studies to be protective to add another reason for beneficial effects of keeping blood glucose under control.
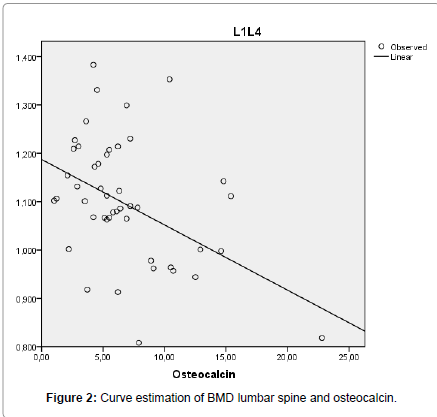
Figure 2:Curve estimation of BMD lumbar spine and osteocalcin.