Journal of Physical Chemistry & Biophysics
Open Access
ISSN: 2161-0398
ISSN: 2161-0398
Research Article - (2025)Volume 15, Issue 5
Psoralens are naturally occurring compounds used in clinical settings to treat skin diseases and cancers. Their therapeutic efficacy stems from their ability to intercalate between DNA base pairs, and once activated by ultraviolet A (UVA) light, form mono- and di-adducts that initiate apoptosis. Although a few psoralen derivatives (like 8-MOP, TMP, and AMT) are widely used in treatments such as PUVA (psoralen plus ultraviolet A) and X-PACT (X-Ray Psoralen Activated Cancer Therapy), many other psoralen derivatives with unique structures have not yet been studied. In the present study, we investigated the binding affinities of three novel psoralen derivatives (1B, 6D, and 2F) with a synthetic adenine-thymine polynucleotide (AT-40) using fluorescence spectroscopy. We analyzed the fluorescence quenching data with Scatchard plots to determine the relative binding constants, and then compared those values to previously reported cytotoxicity data. Results showed that 2F exhibited the greatest binding constant (3.43 × 10⁶ M-1), followed by 6D and 1B, indicating that certain structural features such as protonated substituents and side chain position may impact DNA intercalation. Additionally, comparisons between binding strength and cell survival after UVA exposure revealed a moderate inverse correlation, suggesting that stronger DNA binding may increase cytotoxicity. In particular, 2F appeared to have therapeutic potential because of its high binding constant and cytotoxicity. These findings highlight the significance of psoralen structure in binding and cytotoxic effectiveness and call for further in vivo studies of derivatives with high binding affinity like 2F.
Psoralen; Spectrofluorometry; Intercalation; 2F; 1B; 6D; Binding; Scatchard
Psoralens are naturally occurring compounds, found in a variety of common plants and fruits, such as parsley, figs, and citrus [1]. These compounds have been clinically used since ancient Egypt and India, when they were applied to the skin or ingested and then activated by sunlight exposure to treat skin conditions [2]. When administered to cells, via topical cream, pill ingestion, or injection, psoralens intercalate between DNA pyrimidines after penetrating the phospholipid bilayer. The planar structure of psoralen, composed of a furan ring and an α-pyrone ring fused to a benzene ring, allows for intercalation into adenine-thymine sites [3]. This structure is shown in Figure 1 with numbered positions that will be referred to throughout this paper. Although inert when not exposed to radiation, when psoralens absorb photons from UltraViolet A (UVA) light (specifically in the 200-400 nm wavelength range), they are activated, forming mono- and diadducts (inter-strand crosslinks) with the stacked pyrimidine bases [4-6]. Particularly, the reactive double bonds in psoralen undergo cycloaddition with thymine, forming two cyclobutane rings: one between the furan-side C-4’ and C-5’ positions and the thymine C-5 and C-6 and the other between the pyrone-side C-3 and C-4 and the thymine C-5 and C-6 [7]. The resulting DNA crosslinking and damage triggers an immune response, releasing cyclindependent kinase inhibitors and p53 to prevent growth and induce apoptosis [8].

Figure 1:Chemical structures of psoralen and the derivatives examined in the present study [11].
Psoralens have continued to be medically applicable as a result of their photoreactivity, used, for instance, in Psoralen Plus Ultraviolet A (PUVA) photochemotherapy, a treatment developed in the 1970s for psoriasis [5]. Psoralens are promising candidates for integration into severe skin disease and cancer treatments because they specifically target cells with high rates of proliferation and division, such as psoriatic keratinocytes (characteristic of psoriasis), melanoma cells, and abnormal T lymphocytes (which lead to Cutaneous T-cell Lymphoma) [9]. However, the use of psoralens to treat such conditions has been limited by UVA’s maximum penetration depth, only able to target solid tumors less than 1 mm deep [9]. This restriction has been addressed by the more recently developed X-Ray Psoralen Activated Cancer Therapy (X-PACT). This method utilizes locally injected phosphors that absorb x-rays and then emit photons at ultraviolet wavelengths, capable of activating 4'-Aminomethyltrioxsalen (AMT) and initiating apoptosis in the targeted tumors [10].
Such therapies primarily utilize a limited repertoire of psoralen derivatives, such as 8-methoxypsoralen (8-MOP), 4,5′,8-trimethylpsoralen (TMP), and AMT. However, there exist dozens of psoralen derivatives (synthesized by the Duke Small Molecule Synthesis Facility) that have yet to be thoroughly studied and may enhance these treatments if effectively integrated [11]. Given that DNA intercalation is at the mechanistic center of psoralen activity, this paper aims to determine the binding constants of three unstudied psoralen derivatives (1B, 6D, and 2F) with a synthetic polynucleotide consisting of an alternating adenine-thymine sequence (AT-40). This is accomplished through fluorescence spectroscopy and offers a method of comparison with the psoralens currently being used in the medical field. Further, the relationship between psoralen structure, binding strength, and cytotoxicity has yet to be analyzed for the vast majority of novel psoralen derivatives, including those selected for this study. Examining the influence of varying chemical structures for the selected psoralen derivatives (displayed in Figure 1) on their DNA binding affinities and previously determined cytotoxicity may provide insight into their potential therapeutic applicability.
Psoralen and synthetic DNA preparation
The three psoralen derivatives analyzed in this study were synthesized by the Duke Small Molecule Synthesis Facility. Stock solutions were prepared using ethanol (Flinn scientific, 95% v/v). Given psoralen affinity for adenine-thymine (AT) sites, an oligonucleotide known as AT-40, synthetic DNA consisting of 20 alternating AT sites, was used to evaluate binding strength. This oligonucleotide was generated by the Yale Keck Oligonucleotide Synthesis Facility.
Solution preparation and fluorescence spectroscopy
Solutions were prepared in capped quartz cuvettes with 1875 μL deionized water and 100 μL phosphate buffer (ScholAR Chemistry, 0.1 M) to stabilize the helical structure of DNA. Light and dark fluorescence references were taken on this solution, in the absence of psoralen, to account for noise. 50 μL of 2F, 5 μL of 6D, and 5 μL of 1B stock were each added to their respective cuvettes. The 1B solution was accompanied by 50 μL ethanol (Flinn scientific, 95% v/v) needed to further dissolve the psoralen. Using a Spectranet black comet spectrofluorometer (set at 3000 ms integration time, 8 scans-to-average, 4 smoothing), each solution was excited with a wavelength of 345 nm, and the peak emission wavelength was determined for each derivative. Fluorescence intensities were recorded at these wavelengths. After each aliquot of AT-40 was added, the cuvette was inverted several times and rested for 2 minutes to allow equilibrium to be reached before recording fluorescence. Three fluorescence intensity measurements (in counts) were then taken and averaged at each aliquot of AT-40 oligonucleotide added to the solution. While free molecules of psoralen fluoresce, intercalation between AT-40 base pairs quenches this fluorescence, and free AT-40 is nonfluorescent. Therefore, the reduction of fluorescence intensity can be ascribed to psoralen-AT-40 binding.
Scatchard analysis
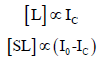
Binding constants were determined for each psoralen derivative using Scatchard plots with the fluorescence quenching data and AT-40 concentrations. The binding constant (K) between a ligand and binding site can be expressed as the following formation constant of the ligand-binding site complex:

in which [S] is the concentration of unoccupied binding sites, [L] is the concentration of free ligand, and [SL] is the concentration of occupied binding sites (the ligand-binding site complex) [12]. This expression can be rewritten in terms of fluorescence intensity and DNA concentration, assigning I0 to the solution fluorescence (in counts) in the absence of AT-40, Ic to the fluorescence in the presence of AT-40, and [AT-40] to the concentration of [AT- 40]. Since free psoralen molecules fluoresce while intercalated molecules do not, observed fluorescence is proportional to [L] (free psoralen), and the decrease in fluorescence intensity is proportional to [SL] (bound psoralen) [13]:
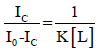
Substituting [L] and [SL] with their fluorescence counterparts and rearranging to isolate the ratio of the observed fluorescence intensity to the decrease in fluorescence yields:
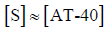
Low binding site occupancy was assumed relative to the total DNA concentration, allowing [S] to be approximated by [AT-40]:
Therefore, with fluorescence values and DNA concentration, we can determine the binding constant for each psoralen derivative with AT-40 using the following equation:
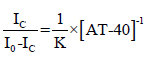
as plotting  on the y-axis and [AT-40]-1 on the x-axis yields a slope that is equal to
  . Plots, least squares regression lines necessary for calculating the Scatchard plot slopes, and R2 values were generated using the Python libraries NumPy, SciPy, Matplotlib, and Seaborn. These libraries were used for Figures 2-5.
Reproducibility and statistical analysis
One binding constant was calculated for each trial, with three trials being conducted for 6D and 1B and two for 2F. These binding constants were averaged for each compound, and the standard deviation was calculated. Since analysis of 2F only resulted in two constants, range was used as a measure of variability instead of standard deviation. All trials were conducted at room temperature, approximately 20° Celsius.
Peak wavelengths were determined for each psoralen (6D: 684.9- 685.7 nm, 1B: 493.2-495.2 nm, 2F: 511.0-520.4 nm) using the spectrofluorometer, and trials were conducted at these respective wavelengths. As successive aliquots were added and AT-40 concentration increased, fluorescence intensity generally decreased, a trend observed amongst nearly all trials and expected as a result of fluorescence quenching. The average fluorescence counts were normalized (each observed intensity was divided by the initial intensity: Ic/I0) for each trial to better reflect the relative quenching effect, and these values are presented in Table 1. This normalization was conducted because although intensities varied between trials of the same psoralen derivative, decreasing trends were observed. Finally, 1B Trial 1 (2 μL aliquot), 2F Trial 2 (16 μL aliquot), and 2F Trial 3 were excluded from the Scatchard plots due to extraneous error (as indicated by the asterisks in Table 1).
| 1B | 6D | 2F | |||||||
|---|---|---|---|---|---|---|---|---|---|
| Aliquot of AT-40 (μL) | Trial 1 | Trial 2 | Trial 3 | Trial 1 | Trial 2 | Trial 3 | Trial 1 | Trial 2 | Trial 3* |
| 0 | 1 | 1 | 1 | 1 | 1 | 1 | 1 | 1 | 1 |
| 2 | 0.998* | 0.992 | 0.975 | 0.861 | 0.965 | 0.956 | 0.875 | 0.949 | 1.019 |
| 4 | 0.974 | 0.976 | 0.944 | 0.834 | 0.767 | 0.859 | 0.763 | 0.911 | 1.084 |
| 8 | 0.955 | 0.937 | 0.898 | 0.78 | 0.663 | 0.834 | 0.798 | 0.9 | 1.001 |
| 16 | 0.913 | 0.929 | 0.879 | 0.718 | 0.6 | 0.883 | 0.793 | 0.978* | 1.186 |
*Excluded from Scatchard plots
Table 1: Normalized psoralen fluorescence intensity in the presence of increasing AT-40 aliquots.
Raw fluorescence intensity counts were used to generate
Scatchard plots for each investigated psoralen. The term was plotted on the y-axis with the reciprocal concentration of AT-
40 on the x-axis. One plot per ‘viable’ trial was created and fitted with
a least-squares regression line (displayed as y = mx + b). R2 values were
also calculated and reported to quantify the regression line accuracy
and effectiveness of accounting for data variability. Scatchard plots are visualized in Figure 2 (1B), Figure 3 (6D), and Figure 4 (2F).

Figure 2: Scatchard plots of binding data for psoralen derivative 1B (Trials 1, 2, and 3)

Figure 3: Scatchard plots of binding data for psoralen derivative 6D (Trials 1, 2, and 3).

Figure 4: Scatchard plots of binding data for psoralen derivative 2F (Trials 1 and 2).
The slopes of the Scatchard plot regression line equations in Figures 2, 3, and 4 were used to calculate binding constants using
the equation  . Mean binding constants were determined
from individual plot values in Table 2. Standard deviation was
used for 1B (1.92 × 10⁵) and 6D (2.29 × 10⁵) as those had three
plots each, and range was reported for 2F (3.96 × 10⁶) as it is
the average of only two trials. Results showed that 2F yielded the
greatest binding constant, followed by 6D, and finally 1B. Binding
constants for other psoralens determined by Balas and Gasparro
[14] (8-MOP, AMT, 6E) and Gupta and Ali [13] (8-MOP, TMP,
psoralen) using fluorescence quenching and Scatchard plots are
also included in Table 2.
. Mean binding constants were determined
from individual plot values in Table 2. Standard deviation was
used for 1B (1.92 × 10⁵) and 6D (2.29 × 10⁵) as those had three
plots each, and range was reported for 2F (3.96 × 10⁶) as it is
the average of only two trials. Results showed that 2F yielded the
greatest binding constant, followed by 6D, and finally 1B. Binding
constants for other psoralens determined by Balas and Gasparro
[14] (8-MOP, AMT, 6E) and Gupta and Ali [13] (8-MOP, TMP,
psoralen) using fluorescence quenching and Scatchard plots are
also included in Table 2.
| Psoralen | Binding Constant (M-1) | Psoralen | Binding Constant (M-1) | Psoralen | Binding Constant (M-1) |
|---|---|---|---|---|---|
| Puhl and Gasparro | Balas and Gasparro | Gupta and Ali | |||
| 1B | 3.12 × 10⁵ | 8-MOP | 3.25 × 10⁵ | 8-MOP | 7.1 × 10⁵ |
| 6D | 2.16 × 10⁶ | AMT | 5.16 × 10⁵ | TMP | 1.32 × 10⁶ |
| 2F | 3.43 × 10⁶ | 6E | 7.30 × 10⁶ | Psoralen | 1.22 × 10⁶ |
Table 2: Psoralen-DNA binding constants determined through Scatchard analysis. [14], [13]
To assess potential correlations, the average binding constants were compared with the cytotoxicity values of each psoralen [11]. Both the binding constants for psoralens analyzed in this study and those investigated by Balas and Gasparro [14] are presented in Figure 5, due to the nearly identical methodology of these studies. Cytotoxicity (quantified by the percent of surviving cells) both in the absence of UVA (Figure 5A) and after exposure to 1 J UVA (Figure 5B) were plotted against the binding constants. Least squares regression lines and R2 values are also included in these figures. Base-10 logarithms were applied to both axes of Figures 5A and 5B due to the large ranges of binding constant magnitudes and cell survival proportions.

Figure 5: Correlation between psoralen–DNA binding affinity and percent cell survival without UVA exposure (5A) and with 1J UVA exposure (5B).
While cell survival remained approximately constant before exposure to UVA, after 1J UVA there was a moderately strong inverse correlation between log(binding constant) and log (% cell survival). Figure 5 excludes 6D (an outlier) in order to ensure that the analysis accurately reflects the relationship between DNA binding constants and cell survival, without being disproportionately influenced by this outlier.
The binding constants calculated in this study align with the binding constant magnitudes determined by other studies for different psoralen derivatives also using fluorescence quenching techniques. Balas and Gasparro [14] calculated constants for 8-MOP, AMT, and 6E (using the same equipment and virtually identical procedure and conditions) while Gupta and Ali [13] determined constants for 8-MOP, TMP, and psoralen, the collection ranging from 3.25 × 10⁵ to 7.30 × 10⁶ M-1. The values obtained in the present study align closely with these previously determined values, ranging from 3.12 × 10⁵ to 3.43 × 10⁶ M-1. However, the large standard deviation and range values suggest pronounced variations, which may be the result of uncontrolled fluctuations in room temperature, further augmented by limited replicates. This study was also conducted in vitro under simplified conditions, not accurately reflecting the influence of biological mechanisms on binding in vivo.
Psoralen derivative 2F yielded the greatest average binding constant, greater than 6D and 1B by factors of approximately 1.6 and 11, respectively. These differences in binding constant magnitude may be explained by the different chemical structure of each compound, specifically the length and polarity of each side chain, which may alter interactions with the AT-40 intercalation site. For 2F, its protonated tertiary amine group causes an electrostatic attraction to the negatively charged DNA backbone, increasing the concentration of 2F near DNA and therefore enhances the extent of psoralen intercalation. Further, these electrostatic interactions may provide enhanced stability while the molecule is inserted into the intercalation site [11]. This protonation is likely the greatest contributor to the large binding constant exhibited by 2F. While this psoralen has a bulky side chain, it is bonded at the C-8 position, remaining solvent exposed and likely not interfering with or blocking insertion [11]. Unlike 2F, 6D lacks the electrostatic attraction from the presence of a positive charge. Further, the long alkyl chain, although it is solvent exposed at C-8, could potentially result in steric hindrance and prevent proper intercalation due to misalignment of the reactive double bonds [15]. Psoralen 1B lacks a positively charged substituent, and in addition, the methyl side chains located at C-4 and C-4’ may slightly interfere with reactive double bond alignment, despite being compact. The variation in structure between these psoralen derivatives and their binding constants suggest side chain location and properties significantly influence the extent of psoralen intercalation.
Analysis of the psoralen binding constants and respective cytotoxicities are also revealing. The weak positive correlation (R²=0.331) between log (% cell survival) and log (binding constant) illustrated in Figure 5A suggests that binding strength does not significantly impact cell survival in the absence of UVA. However, the moderate negative correlation (R²=-0.493) in Figure 5B indicates that higher binding affinities do correlate with increased cytotoxicity after exposure to UVA. This trend is consistent with the widely accepted cell-killing mechanism for psoralens. Psoralen derivatives with greater binding constants tend to be more cytotoxic, likely as a result of more extensive intercalation and increased DNA damage [6]. The trends illustrated in Figure 5 underscores the importance of considering binding strength with DNA in selecting psoralens for maximum therapeutic efficacy under UVA activation. Of note, 6D was excluded from the plots in Figure 5 because it significantly contradicted this trend, having a relatively high binding constant (2.16 × 10⁶) despite its low cytotoxicity (94.4 % cell survival) [11]. Although the large binding constant implies successful intercalation, there may be substituent structural factors that reduce adduct/crosslink efficacy and thus decrease cytotoxicity. For instance, while steric hindrance doesn’t seem to impact intercalation, it may interfere with the alignment for the second cycloaddition necessary for crosslinking; the bulky substituent potentially prevents the psoralen from adopting the optimal orientation for both furan- and pyrone-side adduct formation, inserting itself into the AT site, but failing to cause sufficient DNA damage.
The correlation between cell survival and binding indicates that structural differences influence binding strength, which in turn impacts cytotoxicity. While TMP and AMT remain more cytotoxic than the three psoralen derivatives investigated in this study, 2F has the second greatest binding constant of all discussed psoralens (Table 2) and greater cytotoxicity than 8-MOP. Therefore, further investigation into 2F is suggested and will be a topic of future research. Other areas that require additional research include the classification of the binding strengths of more psoralen derivatives, specifically those that are protonated under physiological conditions (similar to 2F and 6E) and contain substituents avoiding the C-3, C-4, C-4’, and C-5’ positions to reduce potential steric hindrance. Such investigation of structural effects may also lead to the development of new derivatives with improved efficacy, advancing the field of psoralen-based therapies. Derivatives that yield high binding affinity and cytotoxicity (e.g., 2F) should also be analyzed in vivo in order to enhance our understanding of how they may operate in therapeutic environments.
Conceptualization, methodology, validation, resources, supervision, project administration, funding acquisition: Francis P Gasparro; software, investigation, writing-original draft, visualization: Cameron M Puhl; formal analysis, data curation; writing-review and editing: Cameron M Puhl and Francis P Gasparro. All authors have read and agreed to the published version of the manuscript.
This research was funded by Hamden Hall Country Day School; the project was funded by contributions to the Science Innovation and Design Program at Hamden Hall.
The authors wish to thank Dr. Patrick Fitzgerald for guidance and lab space to complete data collection.
The data for the Scatchard plots can be found at this link: (https://docs.google.com/spreadsheets/d/1AAE_GU6iDRaU_QOfS_YqQ5ooZwEWH7bOOx6Nq8iMwDw/edit?usp=sharing).
The authors declare no conflict of interest.
Citation: Puhl CM, Gasparro FP (2025). Binding Affinities and Cytotoxicity of Novel Psoralen Derivatives: A Fluorescence Spectroscopy Study. J Phys Chem Biophys.15:439.
Received: 26-Aug-2025, Manuscript No. JPCB-25-38598; Editor assigned: 29-Aug-2025, Pre QC No. JPCB-25-38598; Reviewed: 19-Sep-2025, QC No. JPCB-25-38598; Revised: 26-Sep-2025, Manuscript No. JPCB-25-38598 (R); Published: 03-Oct-2025 , DOI: 10.35841/2161-0398.25.15.439
Copyright: © 2025 Puhl CM, et al. This is an open-access article distributed under the terms of the Creative Commons Attribution License, which permits unrestricted use, distribution, and reproduction in any medium, provided the original author and source are credited.