Family Medicine & Medical Science Research
Open Access
ISSN: 2327-4972
ISSN: 2327-4972
Research Article - (2016) Volume 5, Issue 4
Background: Not a few studies have investigated the clinical association between obesity and renal dysfunction. Nonetheless, there is still scarcity of information about the degree of obesity with the development of microalbuminuria. Thus, we evaluate the longitudinal relationship between the degree of obesity stratified by body mass index (BMI) and the risk for microalbuminuria. Method: A cohort of 1,938 Korean men with normoalbuminuria in 2005 was followed-up until 2010. The development of microalbuminuria was defined as urine-albumin to creatinine ratio (UACR) between 30 and 300 µg/mg and the incidences of microalbuminuria were compared among 4 groups according to their baseline degree of obesity stratified by BMI. Cox proportional hazard model was used to evaluate the hazard ratios (HRs) for microalbuminuria according to the degree of obesity. Result: During follow-up, 103 cases of microalbuminuria (5.4%) developed. The incidence of microalbuminuria was lowest in normal BMI group (underweight: 3.4%, normal: 2.6%, overweight: 4.2%, obesity: 7.9%, P<0.001). When HRs for microalbuminuria in normal BMI group was set as a reference, only obese group had the statistically significant association with the development of microalbuminuria [underweight: 1.73 (0.22-13.49), overweight: 1.49 (0.73-3.06), obese: 2.54 (1.31-4.93), respectively]. Conclusion: Comparing to normal BMI group, people with obesity had the higher risk for microalbuminuria. This study suggests that obesity is longitudinally related to the development of microalbuminuria.
<Keywords: Albuminuria; Kidney disease; Obesity; Body mass index
Obesity is a serious health issue expected to increase at an alarming rate in future [1,2]. Obesity has more significant clinical implication as a risk factor for various medical diseases than obesity itself. Previous studies showed that medical diseases such as cardiovascular diseases, diabetes and chronic kidney disease were largely attributed to the obesity [3]. Additionally, the prevalence of obesity is rapidly growing in Asian as well as Western. The prevalence of BMI-based obesity in Korean men has increased from 26.2% in 1998% to 37.6% in 2013, which suggest the growing burden of obesity-related diseases in Korea [4]. Thus, rapid growing incidence of obesity implies that medical conditions related to obesity would become more serious threat to public health.
Microalbuminuria, defined as a urinary albumin-to-creatinine (UACR) ranging within 30–300 mg/g, is usually used in evaluating and managing diabetic nephropathy [5,6]. Body of evidence indicated that obesity was deeply associated with diabetic nephropathy manifested by microalbuminuria [7-9]. Additionally, even in non-diabetic patients, risk for microalbuminuria was related with the degree of obesity [10,11]. Nonetheless, evidences are still lacking to support a definite correlation between the degree of obesity evaluated by BMI and the development of microalbuminuria. Thus, we investigated the incidental risk of microalbuminuria according to the baseline degree of obesity on the hypothesis that degree of obesity might be somehow associated with the risk for microalbuminuria.
Study design
We set a prospective cohort study and use a cox proportional hazards model in order to examine association between baseline BMI and the development of microalbuminuria. The analyses form these studies are based on medical health check-up data from the Health Promotion Center of Kangbuk Samsung Hospital, Sungkyunkwan University, Seoul, Korea. Study participants consisted of Korean men who are employees participated in either annual or biennial medical health check-up program, as required by Korea’s Industrial Safety and Health law. The purpose of this program is to enhance early detection of existing diseases and improve the health of employees. The costs of the health check-up are largely paid by their employers. Most of the participants is employees and their family members from all around the country, thus, we conduct a follow-up study as taking advantage of this opportunity.
Study population
4,807 of male participants who had examined the urine albumin creatinine ratio (UACR) for a medical health check-up in 2005 initially participated in this study. Of these subjects, 355 were not included in analyses because of various reasons as follow. 264 had a baseline microalbuminuria (30 ≤ UACR<300 mg/g) or had a baseline overt albuminuria (UACR 300 ≥ mg/g); 5 had baseline missing of BMI at initial examinations; 113 had a previous medical histories of cardiovascular disease or malignancy. In the remaining 4,442 men, we further excluded 2,504 participants who did not examine any followup visit between 2006 and 2010 for optimal outcome and accur acy. Finally, a total of 1,938 participants were enrolled in this study and observed for the development of microalbuminuria (Figure 1). The total 6,554.2 person year were followed up and average follow-up period was 3.38 person year. Written informed consent was obtained from all participants. The institutional review board of Kangbuk Samsung Hospital provided Ethics approvals for the study protocol and analysis of the data with the consent of all participants.
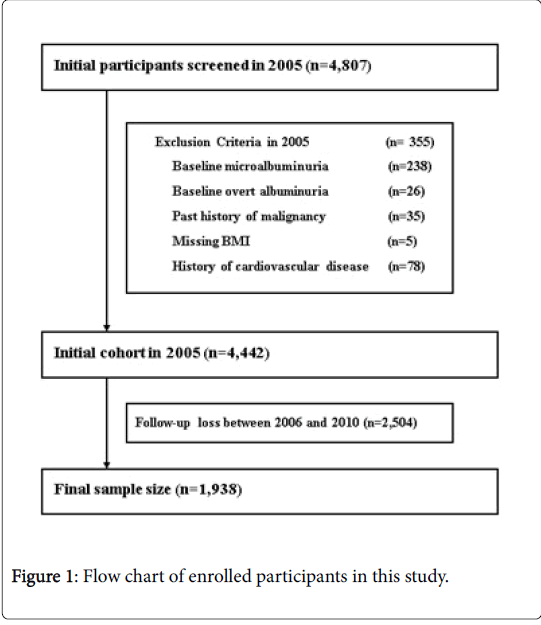
Figure 1: Flow chart of enrolled participants in this study.
Clinical and Laboratory Measurements
Participants completed a standardized questionnaire included a medical history, life style and had a physical examination, anthropometric measurements and laboratory measurements.
The medical and drug history were assessed by the trained physicians. All of participants respond to a health-related behavior questionnaire regarding alcohol consumption, smoking and exercise. The questions about alcohol consumption included the frequency of alcohol use on a weekly and the daily typical amount. We considered persons who response they smoked at the time of the health-check to be current smoker. Diabetes mellitus was diagnosed with the current use of blood glucose–lowering agents or fasting serum glucose test (126 mg/dL). Hypertension was diagnosed with the current use of antihypertensive medication or having a measured blood pressure ≥ 140/90 mmHg at initial examinations by a standard mercury sphygmomanometer. Blood samples were collected from an antecubital vein after more than 12 hours of fasting. We obtained data about main variables such as Serum levels of aspartate aminotransferase (AST), alanine aminotransferase (ALT), and γ-glutamyltransferase (GGT) measured by Bayer Reagent Packs (Bayer HealthCare, Tarrytown, NY) on an automated chemistry analyzer (ADVIA 1650 Autoanalyzer; Bayer Diagnostics, Leverkusen, Germany). We calculated Insulin resistance using the homeostasis model assessment of insulin resistance (HOMA-IR): fasting serum insulin (uU/mL)×fasting serum glucose (mM/L)/22.5 [12].
The alkaline picrate (Jaffe) method are used for measuring Serum creatinine (SCr) and the Chronic Kidney Disease Epidemiology Collaboration (CKD-EPI) equation: eGFR=141×min(SCr/K, 1)a×max(SCr/K, 1)−1.209×0.993age×1.018 [if female]×1.159 [if Black], where SCr is serum creatinine, K is 0.7 for females and 0.9 for males, a is −0.329 for females and -0.411 for males, min indicates the minimum of SCr/K or 1 and max indicates the maximum of SCr/K or 1 is used for calculating the glomerular filtration rate (GFR) which means kidney function [13].
A single morning voided urine sample at baseline was used to measure the UACR. The urinary albumin concentration was detected by immunoradiometry (Radioimmunological competition assay, Immunotech Co. Prague, Czech Republic), and the urinary creatinine concentration was measured by a modified Jaffe method. The UACR measured in spot urine sample has been determined to be highly correlated with the 24 hr urine albumin excretion [14]. The incidence of microalbuminuria was assessed from the annual records of all participants and defined as UACR between 30 and 300 mg/g. The presence of overt albuminuria was routinely defined as UACR more than 300 mg/g. These variables were assessed at each visit. The BMI was calculated by dividing weight (kg) by height squared (m2). Height and weight were measured with the shoeless participants wearing a lightweight hospital gown. BMI was categorized based on criteria for Asian populations [15,16]. Underweight was defined as BMI<18.5 kg/m2, normal weight as BMI ≥ 18.5, <23 kg/m2, overweight as BMI ≥ 23, <25 kg/m2 and obese as BMI ≥ 25 kg/m2, respectively.
Statistical analyses
Descriptive statistics of participants were expressed as means ± (standard deviation) or medians (interquartile range) for continuous variables and percentages of the number for categorical variables. The statistical differences among the characteristics of the study participants at the time of enrollment according to the BMI categories analyzed by One-way ANOVA and X2-test. BMI categories comprised underweight, normal weight, overweight and obese, respectively. For the defining incidence of microalbuminuria, we make use of the midpoint between the visit at which microalbuminuria was first diagnosed and the baseline visit (2005) for the time of microalbuminuria occurrence. The person years were calculated as the sum of follow-up times from the baseline until the final examination of each individual or until a presumed time of microalbuminuria development. Cox proportional hazards models were used to estimate adjusted hazard ratios (HRs) and 95% confidence intervals (CI) for development of microalbuminuria comparing the underweight, overweight and obese vs normal weight. In the multivariate models, the data were adjusted for the multiple covariates and we included variables that might confound the relationship between baseline BMI and microalbuminuria, which include age, ALT, GGT, triglyceride, HOMA-IR, baseline UACR, eGFR, alcohol intake, recent smoking status, regular exercise, diabetes mellitus and hypertension. For the linear trends of risk, BMI categories were used as a continuous variable and tested on each model. We checked the validity of the proportional hazards assumption for using the Cox proportional hazards models.
There were two approaches. First of the assumption was assessed by log-minus-log survival function and found to graphically hold. Second, time-dependent covariate analysis was used to confirm the validity of the proportional hazards assumption. The time dependent covariate was not statistically significant, suggesting that the proportional hazards assumption is not violated (P=0.866). Statistical analyses were performed using PASW Statistics 18 (SPSS Inc., Chicago, IL) and P values <0.05 were considered to be statistically significant.
During 6,554.2 person-years of follow-up, eventually 103 (5.3%) cases of microalbuminuria developed from 2006 to 2010. The baseline characteristics between exclusion and inclusion of the present study population are shown in Table 1.
| Characteristic | Exclusion from analysis (N=2,504) | Inclusion in analysis (N=1,938) | P-value* |
|---|---|---|---|
| Age (years) | 50.4 ± (11.8) | 52.9 ± (10.3) | <0.001 |
| BMI (kg/m2) | 24.4 ± (2.9) | 24.5 ± (2.7) | 0.210 |
| Systolic BP (mmHg) | 118.1 ± (15.1) | 117.6 ± (14.8) | 0.269 |
| Diastolic BP (mmHg) | 79.5 ± (9.8) | 79.9 ± (9.7) | 0.234 |
| Total cholesterol (mg/dL) | 195.7 ± (33.8) | 198.5 ± (33.1) | 0.005 |
| Triglyceride (mg/dL) | 156.6 ± (99.8) | 152.1 ± (112.3) | 0.166 |
| HDL-cholesterol (mg/dL) | 51.0 ± (10.8) | 51.7 ± (11.0) | 0.042 |
| LDL-cholesterol (mg/dL) | 113.7 ± (28.7) | 116.2 ± (27.3) | 0.004 |
| Fasting serum glucose (mg/dL) | 101.3 ± (19.0) | 101.6 ± (18.8) | 0.545 |
| HOMA-IR | 2.23 ± (1.05) | 2.19 ± (1.00) | 0.232 |
| Insulin (uU/dL) | 8.9 ± (3.6) | 8.7 ± (3.4) | 0.098 |
| SCr (mg/dL) | 1.12 ± (0.12) | 1.13 ± (0.11) | 0.009 |
| eGFR (mL/min per 1.73m2) | 77.2 ± (11.5) | 75.0 ± (10.4) | <0.001 |
| GGT (U/L) | 50.2 ± (61.3) | 48.5 ± (59.4) | 0.352 |
| AST (U/L) | 27.2 ± (20.6) | 26.8 ± (12.2) | 0.434 |
| ALT (U/L) | 31.3 ± (32.2) | 30.0 ± (19.4) | 0.097 |
| Current smoker (%) | 45.0 | 34.4 | <0.001 |
| Alcohol intake (%) | 26.0 | 25.3 | 0.608 |
| Regular exercise (%) | 20.3 | 27.1 | <0.001 |
| Hypertension (%) | 31.1 | 33.6 | 0.078 |
| Diabetes mellitus (%) | 8.0 | 8.3 | 0.698 |
| Data are expressed as means (standard deviation) or percentages. *P-value by t-test for continuous variables and Chi square test for categorical variables. |
|||
Table 1: Comparison of the baseline characteristics between people excluded and included from study.
The baseline characteristics of the study participants according to the BMI categories are presented in Table 2. At baseline, the mean (SD) age and BMI of study participants were 52.9 (10.3) years and 24.5 (2.7) kg/m2, respectively.
| Characteristic | Overall | BMI categories | P-for trend* | |||
|---|---|---|---|---|---|---|
| underweight (<18.5, n=29) | Normal (≥18.5, <23, n=507) | Overweight (≥23, <25, n=594) | Obese (≥25, n=808) | |||
| Total person-year | 6,554.2 | 95.8 | 1,765.6 | 2,031.5 | 2,661.3 | |
| Average person-year | 3.38 ± (1.45) | 3.30 ± (1.48) | 3.48 ± (1.42) | 3.42 ± (1.46) | 3.29 ± (1.47) | |
| Age (years) | 52.9 ± (10.3) | 50.8 ± (15.6) | 53.4 ± (10.8) | 53.7 ± (10.0) | 52.1 ± (9.8) | 0.674 |
| Systolic BP (mmHg) | 117.6 ± (14.8) | 113.9 ± (16.6) | 114.0 ± (14.9) | 116.8 ± (13.8) | 120.6 ± (14.7) | <0.001 |
| Diastolic BP (mmHg) | 79.9 ± (9.7) | 76.1 ± (10.3) | 77.1 ± (9.7) | 79.3 ± (9.2) | 82.2 ± (9.5) | <0.001 |
| Total cholesterol (mg/dL) | 198.5 ± (33.1) | 181.3 ± (23.5) | 192.1 ± (34.7) | 199.9 ± (32.5) | 202.1 ± (32.1) | <0.001 |
| Triglyceride (mg/dL) | 127 (91-180) | 91 (70-112) | 104 (76-143) | 125 (93-175) | 148 (103-211) | <0.001 |
| HDL-cholesterol (mg/dL) | 51.7 ± (11.0) | 61.8 ± (16.8) | 54.7 ± (12.5) | 52.1 ± (10.9) | 49.2 ± (9.0) | <0.001 |
| LDL-cholesterol (mg/dL) | 116.2 ± (27.3) | 99.7 ± (23.1) | 110.7 ± (27.0) | 117.1 ± (27.3) | 119.5 ± (27.0) | <0.001 |
| Fasting serum glucose (mg/dL) | 101.6 ± (18.8) | 92.5 ± (8.9) | 98.9 ± (17.7) | 101.7 ± (17.7) | 103.6 ± (20.1) | <0.001 |
| HOMA-IR | 1.99 (1.53-2.61) | 1.54 (1.09-1.87) | 1.68 (1.30-2.15) | 1.91 (1.50-2.36) | 2.30 (1.76-3.11) | <0.001 |
| Insulin (uU/dL) | 8.7 ± (3.4) | 6.8 ± (2.4) | 7.3 ± (2.5) | 8.1 ± (3.1) | 10.0 ± (3.8) | <0.001 |
| SCr (mg/dL) | 1.13 ± (0.11) | 1.08 ± (0.08) | 1.11 ± (0.11) | 1.12 ± (0.11) | 1.15 ± (0.12) | <0.001 |
| eGFR (mL/min per 1.73m2) | 75.0 ± (10.4) | 80.2 ± (11.1) | 76.4 ± (10.5) | 74.8 ± (9.8) | 74.1 ± (10.7) | <0.001 |
| GGT (U/L) | 32 (21-54) | 20 (14-31) | 24 (17-41) | 32 (21-51) | 41 (26-66) | <0.001 |
| AST (U/L) | 24 (21-30) | 22 (19-25) | 23 (20-27) | 25 (21-30) | 25 (22-31) | 0.001 |
| ALT (U/L) | 25 (20-34) | 19 (16-22) | 21 (17-27) | 25 (20-33) | 29 (23-40) | <0.001 |
| Current smoker (%) | 34.4 | 46.4 | 38.4 | 31.4 | 33.6 | 0.049 |
| Alcohol intake (%) | 25.3 | 25.9 | 24.9 | 23.7 | 26.7 | 0.522 |
| Regular exercise (%) | 27.0 | 15.4 | 27.6 | 25.8 | 28.0 | 0.806 |
| Hypertension (%) | 33.6 | 17.2 | 22.1 | 31.6 | 42.9 | <0.001 |
| Diabetes mellitus (%) | 8.3 | 3.4 | 6.1 | 8.9 | 9.4 | 0.027 |
| Development of microalbuminuria (%) | 5.3 | 3.4 | 2.6 | 4.2 | 7.9 | <0.001 |
| Data are means (standard deviation), medians (interquartile range), or percentages. *P-value by ANOVA-test for continuous variables and Chi square test for categorical variables. | ||||||
Table 2: Baseline characteristics of study participants according to BMI categories (N=1,938).
There were clear dose response relationships between all of the variables and BMI categories except for age, alcohol intake, and regular exercise.
The HRs and 95% CI for development of microalbuminuria according to the BMI categories are showed in Table 3. The relationship between HRs for the incident microalbuminuria and the degree of obesity exhibited a J-shaped pattern.
| Hazard ratios (95% Confidence Interval) | |||
|---|---|---|---|
| Unadjusted | Model 1a | Model 2b | |
| BMI categories | |||
| underweight | 1.42 (0.19-10.89) | 1.62 (0.21-12.49) | 1.73 (0.22-13.49) |
| Normal | 1.00 (reference) | 1.00 (reference) | 1.00 (reference) |
| Overweight | 1.68 (0.86-3.28) | 1.53 (0.78-3.03) | 1.49 (0.73-3.06) |
| Obese | 3.31 (1.82-6.01) | 2.43 (1.29-4.57) | 2.54 (1.31-4.93) |
| Age | 1.04 (1.02-1.07) | 1.05 (1.02-1.07) | |
| Baseline UACR | 1.14 (1.11-1.17) | 1.14 (1.11-1.16) | |
| Triglyceride | 1.00 (1.00-1.01) | 1.00 (1.00-1.01) | |
| ALT | 1.00 (0.99-1.01) | 1.00 (0.98-1.01) | |
| GGT | 1.00 (1.00-1.01) | 1.00 (1.00-1.01) | |
| HOMA-IR | 1.21 (1.02-1.42) | 1.22 (1.02-1.46) | |
| eGFR | 1.01 (0.99-1.03) | 1.01 (0.99-1.03) | |
| Smoking status | 1.57 (1.02-2.42) | ||
| Regular exercise | 0.83 (0.52-1.31) | ||
| Alcohol intake | 1.08 (0.67-1.74) | ||
| Diabetes mellitus | 1.24 (0.69-2.23) | ||
| Hypertension | 1.05 (0.68-1.60) | ||
| a Model 1 was adjusted for age, baseline UACR, triglyceride, ALT GGT, HOMA-IR and eGFR. b Model 2 was adjusted for model 1 plus current smoking status, regular exercise, alcohol intake, diabetes mellitus and hypertension. |
|||
Table 3: Hazard ratios (HRs) and 95% confidence intervals (CI) for the incidence of microalbuminuria according to the BMI categories.
In unadjusted model, the HRs and 95% CI for incident microalbuminuria comparing the underweight, overweight and obese vs normal weight were 1.42 (0.19-10.89), 1.68 (0.86-3.28) and 3.31 (1.82-6.01), respectively. These results were also significant, even after further adjustments for covariates in model 1 and 2. In model 2, the adjusted hazard ratios and 95% CI for incident microalbuminuria across underweight, overweight and obese were 1.73 (0.22-13.49), 1.49 (0.73-3.06) and 2.54 (1.31-4.93), respectively.
This study showed the higher incidence of microalbuminuria in underweight, overweight and obese group than normal BMI group in middle-aged Korean men. HRs for microalbuminuria was also higher in underweight, overweight and obese group than normal BMI group. However, after adjusting for multiple covariates such as age, baseline UACR, triglyceride, ALT GGT, HOMA-IR, eGFR, diabetes mellitus, hypertension, smoking status, regular exercise and alcohol intake, incidental risk for microalbuminuria was statistically significantly only in obese group with BMI ≥ 25. Thus, this finding implies that obese people have the higher likelihood for the development of microalbuminuira than others. Additionally, this finding is supported by previous studies reporting the positive relationship between the obesity and microalbuminuria [7-9]. Especially, recent body of evidence focused the significant relationship between microalbuminuria and central or visceral obesity. The American study associated diabetes control and complications trial supports a positive interaction between central obesity and microalbuminuria in individuals with type 1 diabetes [17]. Even in general population without any of the disease associated microalbuminuria, age-adjusted risk of abnormal albumin excretion rate was almost 18 times greater in the centrally obese as compared with the control subjects [18]. Also in studies for Asian, similar results suggested that central obesity may be harmful to kidney in individuals without hypertension, diabetes, preexisting renal disease from the general population [10,11,19].
Regarding to the obesity stratified by BMI, not a few studies have reported the harmful effect of obesity on kidney. Obesity was a potential risk factor for microalbuminuria in hypertensive or diabetic patients [20-22], and causative relationship was identified between chronic renal disease and obesity. In US cohort among 2,585 participants without any kidney disease at baseline showed that men and women had more chronic renal failure with significant OR 1.23 per unit BMI after 18.5 year of follow-up [23]. Another similar cohort study for Okinawa demonstrated that highest BMI quartile was associated with an increased risk for developing end-stage renal disease (ESRD) 17 years later but only among men according to OR 1.27 [24].
Nonetheless, there is still scarcity of information about the incidental relationship between microalbuminuria and obesity stratified by BMI. That’s because most of studies were conducted with cross-sectional design [7-9] or patients of chronic illness such as diabetes and hypertension [20-22]. Despite several cohort studies showing the increasing incidental risk for renal disease proportionally to BMI [23,24], data is still insufficient in clarifying the relationship between BMI and microalbuminuria itself. However, we monitored the natural progress of the large number of common middle-aged Korean men, our present study was more likely to clarify the longitudinal association between obesity and microalbuminuria.
As the potential pathophysiological mechanism accounting for our finding, several theories may be raised. The first theory is the harmful influence of obesity on renal function. Obesity affected alterations in glomerular structure so that it has been termed as obesity-related glomerulopathy. This hemodynamics started with increased renal blood flow, reduced nephron number, glomerular filtration rate (GFR), which may cause excretory loads, endothelial dysfunction, increased vascular permeability and sympathetic nerve stimulation. These alterations in renal function may affect the risk of microalbuminuria in high BMI categories [25-27]. In addition to such renal alteration, disturbances of lipid metabolism caused by obesity also related to renal dysfunction. Triglyceride-rich lipoproteins promoting mesangial cell proliferation, low HDL-cholesterol levels generating atherogenesis in renal structure and direct lipotoxicity to the proximal tubular cells could be linked to increased chronic renal disease [28,29]. Increasing evidence has also established that inflammatory effects due to obesity are linked to renal damage. Adipose tissue has been known as a source of inflammatory cytokines. Being overweight or obesity elevated these cytokines such as C-reactive protein(CRP) and Tumor necrosis factor- α(TNF-α), which attribute to glomerular mesangial expansion, the loss of slit pore diaphragm integrity, endothelial cell derangements, eventually leading to progression of microalbuminuria [30,31].
The second theory is the role of the baseline metabolic parameters in the development of microalbuminuria. In this study, baseline clinical characteristics were more unfavorable in more obese group. In particular, this tendency was more prominent in significant deleterious factors such as baseline HOMA-IR, blood pressure, eGFR, prevalence of diabetes and hypertension. As well known, these factors are established risk factors for the renal disease including microalbuminuria. Thus, people with more unfavorable metabolic profiles were more likely to have microalbuminuria. However, statistical significance was maintained even after adjusting for these metabolic parameters, which suggests the clinical significance of obesity as a contributable factor for microalbuminuria.
This study had several limitations. First, urinary albumin was assessed on only a single urine specimen from study participants. Prior studies have suggested that urinary albumin levels may exhibit considerable intra-individual variability [32]. Nonetheless, the national practice guidelines recommend the use of spot specimens for the UACR because the test is easily performed in the clinic and the results correlate well with those of 24 h collections [33]. Second, this study was restricted to only men. These results may not be inferenced to women and further studies are needed.
In conclusion, our study indicated that increasing BMI was associated with an increased risk of the development of microalbuminuria in Korean men even after adjustment for diabetes, hypertension and other renal disease related to microalbuminuria. Hence, obesity probably should be put high on the list of preventable causes of microalbuminuria and maintaining a normal weight, at least in men, is an important strategy for reducing the development of microalbuminuria.
The author(s) declare(s) that they have no conflicts of interest related to the subject matter or materials discussed in this article.
Joong-Myung Choi coordinated the study, interpreted the data, contributed to discussion and wrote the manuscript. Sung Keun Park and Kanghee Moon equally contributed to collecting the data, editing and writing the manuscript. Therefore, Sung Keun Park and Kanghee Moon should be equally considered as first authors. Jae-Hong Ryoo interpreted the data, contributed to discussion and reviewed the manuscript. In-Hwan Oh, Jung sook Yun, Eun Young Lee and Keum Ok Lee participated in reviewing manuscript. Joong-Myung Choi is the guarantor of this work and, as such, had full access to all the data in the study and takes responsibility for the integrity of the data and the accuracy of the data analysis.