Forest Research: Open Access
Open Access
ISSN: 2168-9776
ISSN: 2168-9776
Research Article - (2018) Volume 7, Issue 2
Keywords: Seedling quality; Sturdiness quotient; Substrate mix
The quality of seedling can be determined by the inherent genetic characteristics. It is possible to improve seedling quality by propagating genetically superior trees, i.e. mother trees of superior quality are selected in forest stands across the provenance and are used for seed collection. Although the above fact is correct and acceptable the reality in countries like Ethiopia where the forest has already gone, and the remaining forest has been highly degraded it is unlikely to get genetically superior mother trees.
Inability to recognize seedling quality as a factor of plant performance in the field has led to the failure of many tree planting projects. Strategies for assessing quality of planting stock need to move away from the traditional approach of considering only the height of seedlings [1,2]. The production of quality planting stock is an important prerequisite for any planting program [3]. Many factors ought to be considered before establishment of plantation. However special consideration should be given to the quality of planting stock. Successful plantation establishment is highly dependent on the planting of high quality tree seedlings [4]. Mistakes at early plantation establishment stage are costly because they can’t be easily corrected, and they are multiplied and compounded throughout the lifespan of the stand.
These mistakes are represented by poor survival and early growth. Growth and survival of young seedlings are functions of vigor, growth rate and resistance to environmental stress. Various measurements of morphological characteristics have been developed and used as a tool to predict field performance of tree seedlings and their ability to tolerate mechanical and environmental stresses [2]. Different research methods have been employed to test the quality of seedlings prior to planting out in the field. Most of these methods however are characterized as destructive which could not be implemented without destroying one or more parts of the seedling.
An alternative nondestructive method commonly used to test seedling quality is sturdiness quotient (index) which compares seedling height (cm) over root collar diameter (mm). The sturdiness quotient (SQ) refers to the ratio of the height of the seedling to the root collar diameter and expresses the vigor and robustness of the seedling [2]. The ideal value for a seedling to be considered sturdy is less than six [5]. A small quotient indicates a sturdy plant with a higher expected chance of survival, especially on windy or dry sites. Therefore, seedlings of selected tree species could be sorted in to different sturdiness index classes and the effect on tree survival and early performance under field conditions could be evaluated.
There is scanty supply of information regarding the quality of planting stock that has implication on survival and field performance out planted tree seedlings [6]. Thus, in this research it was hypothesized that seedling quality could significantly influence the resultant early performance of planted tree seedlings and the trial evaluates the relationship between quality class and early performance of tree seedlings for successful plantation establishment on degraded highlands like Yerer Mountain Range in Ethiopia.
The study area
Yerer, located 40 km to the South West of Addis Ababa and standing at over 3000 m a.s.l is a microcosm of mountain degradation in Ethiopian highlands. The area is characterized by a unimodal rainfall having long rainy season. It receives the highest rainfall during the wet season from June to September. Short rains occur at any months of the dry season, especially during March, April and May. On an average, the area receives more than 1000 mm annual rainfall. The average minimum and maximum temperatures are 100C and 26 0C, respectively. The mountain covers a total area of 6000 hectares of which 3500 hectares are designated as a forest land, under the management of Oromia Forest and Wildlife Enterprise (OFWE).
Yerer Mountain (Figures 1-6) is characterized by having both natural forest and man-made plantations. The natural vegetation is dominated by tree species of Juniperus procera and diverse species of bushes, shrubs and herbs. The vegetation diversity varies depending on the different environmental gradients like soil, altitude and other climatic factors. The upper part of the mountain is highly dominated by bushes and shrubs. The man-made plantation is dominated by exotic species such as Eucalyptus globulus, E. camaldulensis and Cuppressus lustanica. The most common species of shrubs are Carisa edulis, Alophylus abyssinicus, Maytenus arbutifolia, Maytenus. unduta, Erica arborea, Buddleja polystachya, Nuxi congesta, Entada abyssinica, Rosa abyssinica, Grewia ferruginea, Grewia villosa and Hypericum revolutum. Fifty years ago, Yerer was completely forested; since then rapid population growth has forced farming families to expand their fields on to steeper slopes. These families depend on using both on the available organic nutrient sources and the last few remaining shrubs and trees as fuel for cooking, with the result that the land has been stripped of both vegetation and nutrients.
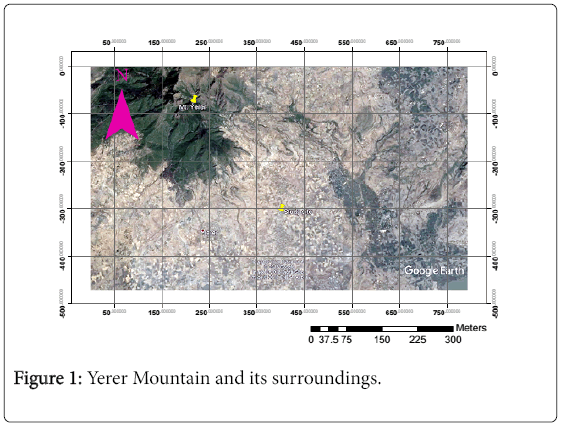
Figure 1: Yerer Mountain and its surroundings.
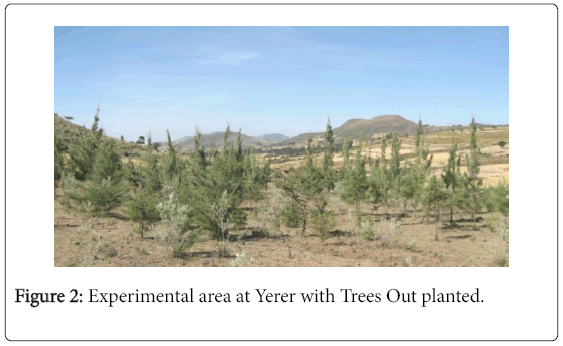
Figure 2: Experimental area at Yerer with Trees Out planted.
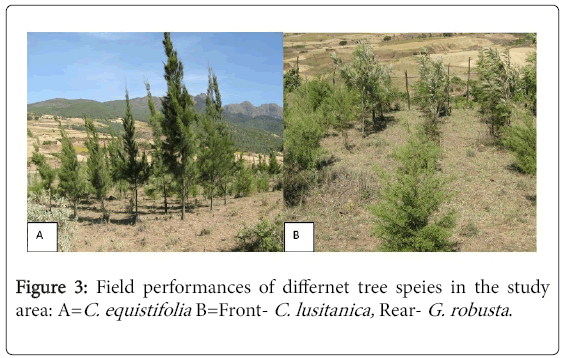
Figure 3: Field performances of differnet tree speies in the study area: A=C. equistifolia B=Front- C. lusitanica, Rear- G. robusta .
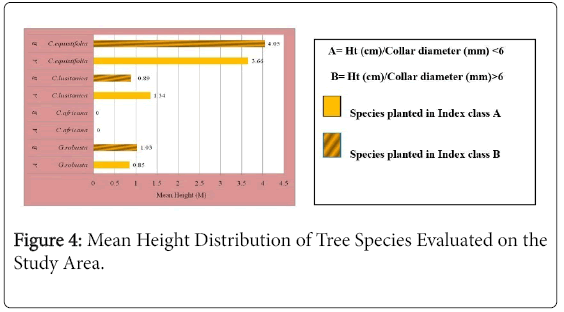
Figure 4: Mean Height Distribution of Tree Species Evaluated on the Study Area.
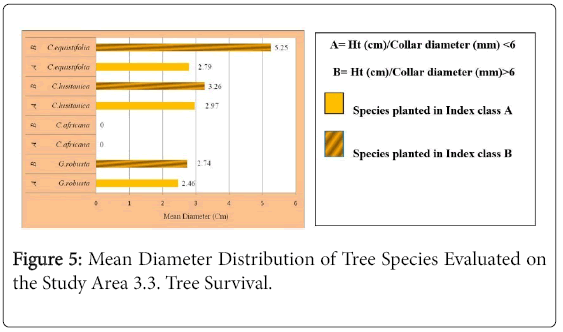
Figure 5: Mean Diameter Distribution of Tree Species Evaluated on the Study Area 3.3. Tree Survival.
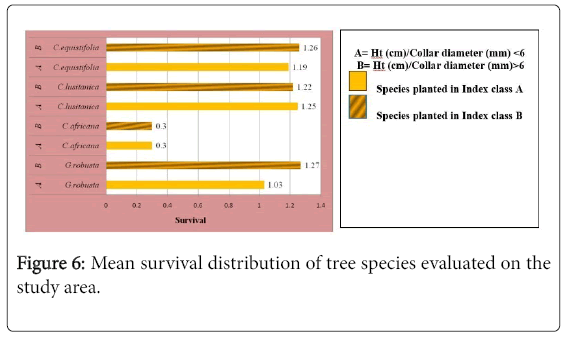
Figure 6: Mean survival distribution of tree species evaluated on the study area.
The research activity was carried out on a relatively plain enclosed area that belongs to the monastery Baheta Mariam situated on a nearby hilltop. The adjacent hillsides are stripped of vegetation and the phenomenon of highland degradation is highly prevalent. Some Euclea and Comboretum species are the most prevalent bushes close to the study site.
Nursery
Tree seedlings of four priority species: Cordia africana, Casuarina equisetifolia, Cupressus lusitania and Grevillia robusta were raised in the nursery of Debre Zeit Agricultural Research Center using recommended substrate mixes of ratio (3% top soil: 2% manure: 1% sand). Quality seeds of the mentioned tree species were obtained from the tree seed unit of Forestry Research Center that has the national mandate of scientific tree seed collection, extraction, storage and distribution. Appropriate nursery calendar was followed to gain enough seedlings for each quotient class: quotient class one (I) comprising height to collar diameter ratio less than 6 and quotient class two (II) height to collar diameter ratio greater than 6. To acquire sufficient seedlings under each quotient class different sowing dates for different species were used in the nursery as the species also vary in their nursery lifespan.
Experimental Design and Field layout
The rectangular shape plain study area was first classified in to three blocks. The two major factors considered were species type and sturdiness index (quotient) class. There were four tree species considered for experimentation, namely Cordia africana, Casuarina equsitifolia, Cupressus lusitanica and Grevillia robusta sorted under two quotient classes: quotient class one (I) that comprised height to collar diameter ratio less than 6 and quotient class two (II) with height to collar diameter ratio greater than 6. Based on this seedling of each tree species were categorized in to two groups prior to planting .
Two factor RCBD was used as an experimental design to handle eight factor combinations that resulted from four species types and two quotient classes. The above eight factor combinations were then randomly assigned to three blocks in three replications. As a result, 24 seedlings of each species per quality class per plot were planted in the field and their growth and survival was evaluated for four years.
Data Collection and Analysis
Starting from one year after planting data on major tree characteristics like height, collar diameter and survival were collected. The raw field data were then summarized by mean values of 24 trees per plot per factor combination for the abovementioned variables and then transferred to data summary sheet of RCBD design prior to subsequent analysis using statistical software. Data collected on survival, height and diameter of trees starting from the onset of the dry season were then subjected to statistical analysis to see if there is significant difference among treatment means at p=0.05. Survival percentage values were subjected to logarithmic transformation (logx+0.5) before parametric tests.
Height growth
As it can be seen from the ANOVA (Table 1) there exists significant difference among treatment means with respect to the variable height of tree species at P= 0.05.However this difference is not attributed to variation in sturdiness quotient .i.e. the variation in height differences among the species tested was not due to the anticipated quality class difference but could be due to the inherent ability of the species to perform differently under the prevailing site condition.
| Source | Degrees of freedom | Sum of square | Mean square | F value | Prob. |
|---|---|---|---|---|---|
| Replication | 2 | 0.25 | 0.12 | 0.73 | |
| Factor A | 1 | 0.005 | 0.005 | 0.03 | |
| Factor B | 3 | 49.54 | 16.51 | 94.23 | 0 |
| AB | 3 | 0.57 | 0.19 | 0.102 | 0.3811 |
| Error | 14 | 2.45 | 0.17 | ||
| Total | 23 | 52.84 |
Table 1: Analysis of Variance Table for Height replication (Variable 1: Block), Factor A (Variable 2: Index), Factor B (Variable 3: Species), Coefficient of Variation: 28.35%.
Once significance has been established the next step would be to find out which of the means are the most significant ones in terms of the variable under consideration i.e. height. This was done through DMRT. Accordingly, the species with significantly higher height performance (4.05cm) was Casuarina equisetifolia though this performance was not statistically different from its height performance in lower quotient class i.e. the threshold that is deduced to contribute to sturdiness (Table 2).
| Species | Index class | Height (M) |
|---|---|---|
| Cordia africana | A | 0.00(c) |
| B | 0.00(c) | |
| Casuarina equsitifolia | A | 3.66(ab) |
| B | 4.05(a) | |
| Cupressus lusitanica | A | 1.34(abc) |
| B | 0.89(bc) | |
| Grevillia robusta | A | 0.85(bc) |
| B | 1.03(bc) |
Table 2: Multiple Mean Height Comparison of Evaluated Tree Species. L.S.D=2.74, S.E.M=0.904 at alpha 0.050, A=Ht(cm)/Dia(mm)<6, B=Ht(cm)/Dia(mm)>6, Different letters in the height column represent significantly different means.
Cupressus lusitanica followed C. equsitifolia in terms of its height performance. Sturdiness quotient did not play a significant role in height performance of C. lusitanica as this was clearly indicated by closely comparable mean heights in the mean separation when the species was out planted under differing quotient classes.
Grevellia robusta with equally comparable means under different quotient classes showed an equivalent height performance with C. lusitanica, Cordia africana was found out to perform least among the species evaluated and most of its seedlings regardless of their quotient classes died two years after planting.
Stem diameter
The ANOVA for the variable diameter also showed that there exists significant difference (Table 3) among the species evaluated. The difference in diameter performance is not however due to the variation in sturdiness quotient as it could be seen from mean diameter values accompanied by identical letters in the mean separation for most of the species (Table 4).
| Source | Degrees of freedom | Sum of square | Mean square | F value | Prob. |
|---|---|---|---|---|---|
| Replication | 2 | 1.027 | 0.514 | 0.3591 | |
| Factor A | 1 | 3.428 | 3.428 | 2.396 | 0.1439 |
| Factor B | 3 | 53.586 | 17.862 | 12.4861 | 0.0003 |
| AB | 3 | 5.888 | 1.963 | 1.3719 | 0.2921 |
| Error | 14 | 20.028 | 1.431 | ||
| Total | 23 | 83.957 |
Table 3: Analysis of Variance Table for Diameter Replication (Variable 1: Block), Factor A (Variable 2: Index), Factor B (Variable 3: Species) Coefficient of Variation: 30.14%.
| Species | Index class | Diameter (cm) |
|---|---|---|
| Cordia africana | A | 0.00(c) |
| B | 0.00(c) | |
| Casuarina equsitifolia | A | 2.79(b) |
| B | 5.2(a) | |
| Cupressus lusitanica | A | 2.97(b) |
| B | 3.26(ab) | |
| Grevillia robusta | A | 2.46(b) |
| B | 2.74(b) |
Table 4: Multiple Mean Diameter Comparison of Evaluated Tree Species. LSD=2.09, S.E.M=0.690 at alpha 0.050, A=Ht(cm)/ Dia(mm)<6, B=Ht(cm)/Dia(mm)>6, Different letters in the diameter column represent significantly different means.
An exception to this is C. equistifolia that revealed a significantly higher diameter growth (5.25 cm) under quotient class- B as compared to its diameter performance (2.79 cm) under quotient class- A. C. lusitanica followed next though there was no significant difference between the mean diameters under the two sturdiness quotient categories considered.
variation in sturdiness index class gave rise to no significant difference between the mean diameters of G .robusta and C. africana. C. africana was not at all preferred to the site for its performances were found out to be the least.
The survival potential of tree species evaluated on the study area was also found out to be significantly different as shown in the ANOVA (Table 5). As in the case of diameter and height performances C. eqistifolia gave a significantly higher mean survival among the species compared but this difference was not attributed to variation in sturdiness quotient as the means under the two quotient classes were accompanied by the same letters in the mean separation (Table 6).
| Species | Index class | Survival |
|---|---|---|
| Cordia africana | A | 0.30 (c) |
| B | 0.00 (c) | |
| Casuarina equsitifolia | A | 1.19 (a) |
| B | 1.26 (a) | |
| Cupressus lusitanica | A | 1.25(a) |
| B | 1.22 (a) | |
| Grevillia robusta | A | 1.03(b) |
| B | 1.27 (a) |
Table 5: Analysis of variance table for survival Replication (Variable 1: Block), Factor A (Variable 2: Index), Factor B (Variable 3: Species) Coefficient of Variation: 8.42%.
| Source | Degrees of freedom | Sum of square | Mean square | F value | Prob. |
|---|---|---|---|---|---|
| Replication | 2 | 0.017 | 0.009 | 1.2603 | 0.3138 |
| Factor A | 1 | 0.032 | 0.032 | 4.6464 | 0.049 |
| Factor B | 3 | 3.701 | 1.234 | 181.776 | 0 |
| AB | 3 | 0.062 | 0.021 | 3.0503 | 0.0636 |
| Error | 14 | 0.095 | 0.007 | ||
| Total | 23 | 3.907 |
Table 6: Multiple Mean survival Comparison of Evaluated Tree Species LSD=0.146, S.E.M=0.048 at alpha 0.050, A=Ht(cm)/Dia(mm)<6, B=Ht(cm)/Dia(mm)>6, Different letters in the survival column represent significantly different means.
The same conclusion holds true for C. lusitanica as it could be seen from the mean separation that the survival of the species is not significantly altered as a result of variation in sturdiness quotient. Neither did small quotient class seedlings out survive over the bigger quotient class seedlings. This does not corroborate the finding that sturdiness quotient should closely parallel diameter in predicting survival and growth in the field and the ideal value for a seedling to be considered sturdy is less than six as stated by Jaenicke [5]. G. robusta showed equally comparable survival with C.eqistifolia under sturdiness quotient class -B. As in the case of height and diameter C. africana was found out to be the least survived and change in sturdiness quotient brought no significant difference in its survival.
No significant correlations were found between sturdiness quotient and the majority of growth parameters at initial stage. Correlation of sturdiness quotient with height, diameter and survival for C. africana at two years of age were found statistically non-significant at P=0.05 (Table 7). The multiple R values for height (0.557), diameter (0.548) and survival (0.166) are the exact same for Pearson R values in the correlation analysis involving two variables. In such analysis the p value is similar to significance F in the ANOVA. Since the significance F for height (0.250),diameter (0.260) and survival (0.752) are >> 0.05 it is justifiable to conclude that the observed correlations between sturdiness quotient and height ( 0.557), diameter (0.548) and survival (0.166) are statistically non-significant.
| Regression Statistics (H-S.Q) |
Regression Statistics (D-S.Q) |
Regression Statistics (S-S.Q) |
|||
|---|---|---|---|---|---|
| Multiple R | 0.55747 | Multiple R | 0.548 | Multiple R | 0.166 |
| R Square | 0.31078 | R Square | 0.3 | R Square | 0.027 |
| Adjusted R Square | 0.13847 | Adjusted R Square | 0.125 | Adjusted R Square | -0.215 |
| Standard Error | 0.50839 | Standard Error | 0.512 | Standard Error | 0.603 |
| Observations | 6 | Observations | 6 | Observations | 6 |
| ANOVA (H-S.Q) | |||||
| df | SS | MS | F | Significance F | |
| Regression | 1 | 0.466 | 0.466 | 1.803 | 0.25 |
| Residual | 4 | 1.033 | 0.258 | ||
| Total | 5 | 1.5 | |||
| ANOVA (D-S.Q) | |||||
| df | SS | MS | F | Significance F | |
| Regression | 1 | 0.45 | 0.45 | 1.717 | 0.26 |
| Residual | 4 | 1.049 | 0.262 | ||
| Total | 5 | 1.5 | |||
| ANOVA (S-xS.Q) | |||||
| df | SS | MS | F | Significance F | |
| Regression | 1 | 0.041 | 0.041 | 0.113 | 0.752 |
| Residual | 4 | 1.458 | 0.364 | ||
| Total | 5 | 1.5 | |||
Table 7: Correlation Between Sturdiness Quotient and Field Performance of C. Africana . Significance level=0.05, H=Height(Cm), D=Diameter(Cm), S=Survival(%), S.Q=Sturdiness Quotient.
Correlations of sturdiness quotient with height, diameter and survival for C. equisetifolia were found statistically non-significant at P=0.05 (Table 8). The multiple R values for height ( 0.613), diameter(0.343) and survival(0) are similar to Pearson R values and the p value is similar to significance F in the ANOVA. Since the significance F for height (0.194),diameter (0.505) and survival (1.00) are > 0.05 it is justifiable to conclude that the correlation between sturdiness quotients and height (0.613), diameter (0.343) and survival (0.00) are statistically non-significant.
| Regression Statistics (H-S.Q) |
Regression Statistics (D-S.Q) |
Regression Statistics (S-S.Q) |
|||
|---|---|---|---|---|---|
| Multiple R | 0.613 | Multiple R | 0.343 | Multiple R | 0 |
| R Square | 0.376 | R Square | 0.117 | R Square | 0 |
| Adjusted R Square | 0.22 | Adjusted R Square | -0.102 | Adjusted R Square | -0.2 |
| Standard Error | 0.483 | Standard Error | 0.575 | Standard Error | 0.547 |
| Observations | 6 | Observations | 6 | Observations | 6 |
| ANOVA(H-S.Q) | |||||
| df | SS | MS | F | Significance F | |
| Regression | 1 | 0.565 | 0.565 | 2.417 | 0.194 |
| Residual | 4 | 0.934 | 0.233 | ||
| Total | 5 | 1.5 | |||
| ANOVA (D-S.Q) | |||||
| df | SS | MS | F | Significance F | |
| Regression | 1 | 0.176 | 0.176 | 0.533 | 0.505 |
| Residual | 4 | 1.323 | 0.33 | ||
| Total | 5 | 1.5 | |||
| ANOVA (S-S.Q) | |||||
| df | SS | MS | F | Significance F | |
| Regression | 1 | 0 | 0 | 0 | 1 |
| Residual | 5 | 1.5 | 0.3 | ||
| Total | 6 | 1.5 | |||
Table 8: Correlation Between Sturdiness Quotient and Field Performance of C. equisetifolia . Significance level=0.05, H=Height (Cm), D=Diameter (Cm), S=Survival(%), S.Q=Sturdiness Quotient.
Correlations of sturdiness quotient with height, diameter and survival for C. lustanica were found statistically non-significant at P=0.05 (Table 9). Since the significance F for height (0.027),diameter (0.870) and survival (0.374) are >> 0.05 the correlation between sturdiness quotients and height (0.861), diameter (0.086) and survival (0.447) are statistically non-significant.
| Regression Statistics (H-S.Q) |
Regression Statistics (D-S.Q) |
Regression Statistics (S-S.Q) |
|||
|---|---|---|---|---|---|
| Multiple R | 0.861 | Multiple R | 0.086 | Multiple R | 0.446 |
| R Square | 0.742 | R Square | 0.007 | R Square | 0.199 |
| Adjusted R Square | 0.677 | Adjusted R Square | 0.24 | Adjusted R Square | 0 |
| Standard Error | 0.31 | Standard Error | 0.61 | Standard Error | 0.547 |
| Observations | 6 | Observations | 6 | Observations | 6 |
| ANOVA (H-S.Q) | |||||
| df | SS | MS | F | Significance F | |
| Regression | 1 | 1.113 | 1.113 | 11.511 | 0.027 |
| Residual | 4 | 0.386 | 0.096 | ||
| Total | 5 | 1.5 | |||
| ANOVA (D-S.Q) | |||||
| df | SS | MS | F | Significance F | |
| Regression | 1 | 0.011 | 0.011 | 0.03 | 0.87 |
| Residual | 4 | 1.488 | 0.372 | ||
| Total | 5 | 1.5 | |||
| ANOVA (S-S.Q) | |||||
| df | SS | MS | F | Significance F | |
| Regression | 1 | 0.299 | 0.299 | 0.997 | 0.374 |
| Residual | 4 | 1.2 | 0.3 | ||
| Total | 5 | 1.5 | |||
Table 9: Correlation Between Sturdiness Quotient and Field Performance of C. lusitanica . Significance level=0.05, H=Height (Cm), D=Diameter (Cm), S=Survival(%), S.Q=Sturdiness Quotient.
Correlation of sturdiness quotient with height and diameter for G. robusta were found statistically non-significant while tree survival was found to be correlated positively significantly (0.842) with sturdiness quotient at P=0.05 (Table 10). Since the significance F for height (0.933) and diameter (0.547) ) are >> 0.05 the correlation between sturdiness quotients for height ( 0.044) and diameter (0.311) are statistically non-significant.
| Regression Statistics (H-S.Q) |
Regression Statistics (D-S.Q) |
Regression Statistics (S-S.Q) |
|||
|---|---|---|---|---|---|
| Multiple R | 0.044 | Multiple R | 0.311 | Multiple R | 0.842 |
| R Square | 0.001 | R Square | 0.097 | R Square | 0.71 |
| Adjusted R Square | -0.247 | Adjusted R Square | -0.128 | Adjusted R Square | 0.637 |
| Standard Error | 0.611 | Standard Error | 0.581 | Standard Error | 0.329 |
| Observations | 6 | Observations | 6 | Observations | 6 |
| ANOVA (H-S.Q) | |||||
| df | SS | MS | F | Significance F | |
| Regression | 1 | 0.002 | 0.002 | 0.007 | 0.933 |
| Residual | 4 | 1.497 | 0.374 | ||
| Total | 5 | 1.5 | |||
| ANOVA (D-S.Q) | |||||
| df | SS | MS | F | Significance F | |
| Regression | 1 | 0.145 | 0.145 | 0.429 | 0.547 |
| Residual | 4 | 1.354 | 0.338 | ||
| Total | 5 | 1.5 | |||
| ANOVA (S-S.Q) | |||||
| df | SS | MS | F | Significance F | |
| Regression | 1 | 1.065 | 1.065 | 9.8 | 0.035 |
| Residual | 4 | 0.434 | 0.108 | ||
| Total | 5 | 1.5 | |||
Table 10: Correlation Between Sturdiness Quotient and Field Performance of G. robusta . Significance level=0.05, H=Height(Cm), D=Diameter(Cm), S=Survival(%), S.Q=Sturdiness Quotient.
It is clearly evident from the results of the study that there is significant difference among the early performances different species tree seedlings tested in the study area. For subsequent tasks of plantation establishment in the proximity of the study area C. eqistifolia is recommended as the most preferable tree species.
C. lusitanica could be considered as the second potential tree species for plantation establishment. However, planting seedlings of the same species using different sturdiness categories as a treatment did not show significant differences in terms the tree variables height and diameter for most of the species under consideration at P=0.05. Neither did small quotient class seedlings significantly out survive and perform over the bigger quotient class seedlings. In this regard C. equistifolia gave a significantly different mean diameter value at P=0.05 with index category-B and G .robusta resulted in significantly different mean survival with index category-B at P=0.05. Survival of C. equistifolia was not significantly changed due to variability of indices as treatment. C. africana was found out to be the least preferred for future tree establishment and plantation activities in the area since all of its seedlings died two years after planting regardless of the quotient classes with in which they were planted G. robusta showed a comparable survival (under bigger quotient class) with C. equistifolia and C. lusitanica (regardless quotient classes) and it could equally be preferred for the site.
In general, the experimental results were found out to be indicative of the less significant role that quotient categories (height/collar diameter) play to induce significant improvement in tree seedling survival and establishment and hence are less rigorous. Though small quotient classes are theoretically regarded as rigorous quality indicators for seedling survival, yet other more realistic quality parameters ought to be used to reliably disclose about the correlation between seedling vigor (as explained by sturdiness quotient) and the resulting field performance of tree seedlings for successful plantation establishment activities at Yerer and other similar areas. The most adaptable tree species prioritized in this study however could be used for plantation activities in the study area though evaluation results on the role of quotient categories to survival and early stage tree performances did not imply any significant changes.