Journal of Aeronautics & Aerospace Engineering
Open Access
ISSN: 2168-9792
ISSN: 2168-9792
Research - (2020)Volume 9, Issue 2
Civil aviation industry has been in a significant growth trend. This trend have increased with using of customs area which is prohibited for unauthorized personnel and uncommercial situations named as apron or rat area (runway apron+taxiways as a customs area) since the beginning of 1970’s. Between the years of 1968-1972, 272 aircrafts were hijacked. After customs area started operating in airports, this unsafety event has been decreased rapidly. Moreover, the absence of comprehensive literature on the Turkish civil aviation industry and its relationship to economic growth perceived in Turkey is encouraged for preparing this paper. So the development of civil aviation industry has been in a gradual trend by the way. In this paper, high reliability organizations (HROs) are described in the introduction part. Next, an overall literature is explained about the business models used in civil aviation. In third and fourth stage; models are used for to evaluate reliability factors such as freight, domestic and international flights, classification of aircrafts with the scope of passenger and cargo flights. In methodology and results on relation between passengers versus freight part, stationary of time series data is analysed for interpreting the relationship between passenger and freight air transportation.
Civil aviation; High reliability organizations; Economic development and regulations; Turkey; ARIMA model predictions
Stability generalizations are especially major themes with regard to our understanding of high-reliability organizations (HROs) that need to be cautious when struggling with potentially dangerous technical processes that could lead to shattering failures with containing lots of life [1,2]. The emphasis on change and flexibility that claim contributed to skewed interpretations and the foundations for the performance of these organizations [3]. It also tends to distract from our ability to distinguish identified changes from situations in which regional adjustments really become detrimental in the detection of higher privacy and safe objectives [4,5].
In civil aviation industries; safety conditions which there is one only foremost element to provide high reliability factors to constitute a HRO are still could not be guaranteed and any member of this industry might end up with unbearable losses such as undesirable accidents with fatalities and financial losses on industry or beyond the stock markets all around the world. For this purpose regardless of ground service or any aircraft maintenance, the civil aviation industry has placed stringent reliability standards on itself in order to mitigate the potential implications. Corporations interact with state aviation authorities, such as Federal Aviation Regulations (FAR) in the United States or General Directorate of State Airports Authority (DHMI) in Turkey to receive a regulation certificate of operational requirements and qualifications.
In the qualification of these authorities, reliability is an essential condition that must be ensured to a significant degree and with consistency. Although, meeting the high-reliability conditions implemented by the authorities with respect to growing values of flights and destinations is harder day by day for the civil aviation industry, particularly given the size and complexity of modern aircraft. This viewpoint on uncertainty and sustainability, especially in the sense of growing social and ecological complexity, has become highly conceptual and descriptive. The definition of what constitutes resilience has hardly been explained by the explosion of theorizing and individual empiric cases [6,7]. For instance, Boeing 777 is one of the most demanded cargo and transportation aircraft type designed by Boeing company, consists of 4.5 million parts built and assembled in more than 10 countries within 6500 workers and engineers are involved in research and construction as Pettersen [8] described how to 10 million hours of research applications and tests total of are expended. Moreover since 1993 when the first Boeing 777 entered commercial service in USA on today, Boeing firm spend more than 5 Billion US $ for minimizing transport costs due to decreased travel times and expanded reliability factors are detected from accidents or limit-value stability tests [9]. Decreased transport costs not only minimize the overall expenses of airline companies, but also provide some new investments areas in airports related to airline ground operations, ground handling companies, customer or airline servicing, repair and overhaul facilities and other commercial activities.
Beyond all these related industries affiliated each other, how does the civil aviation industry ensure to achieve a success that high in terms of reliability? Therefore, in this paper it is focused on this question by providing various status reports of the common practices for reliability assurance in civil aviation industry. Thus, a synthesis of common industrial practices will be revealed and valuable interpretations will enlighten the future perspectives. Moreover, it is encouraged by the absence of comprehensive literature on the Turkish civil aviation sector and its relationship to economic growth perceived in Turkey between the years 1970- 2017. Since 1970 the airports have customs area which named as apron, so it is examined in this research paper the year 1970 as a beginning.
This research paper is organized as follows. In section 1 starts from the introduction part which explains the high reliability organizations (HROs) in general. In Section 2, it is presented an overall evaluation of civil aviation business models such as low cost and full service carriers as an overview. In Section 3, literature review on reliability measurements with database substructure is given with models that used. In Section 4, reliability factors with analysis and design are performed in order to provide a reliable data for discussion. In this section, correlating the results with the following parameters as; freight, domestic and international flights, types of airplanes and purpose of the flight (passenger or cargo) are examined. In Section 5 at methodology, verification and validation of reliability is focused with the analysis of dataset and stationarity of time series data. In Section 6, the figures are given. In Section 7, the results on relation between passengers versus freight are evaluated as demand to the civil airlines’ terms related with the amount of passenger and freight (per passenger). In Section 8 at the discussion and conclusion, it is presented lessons learnt and perspectives for the reliability organizations’ practice in civil aviation industry by stimulating the future research that applies qualitative or mixed methodologies to further investigate the civil aviation-economic growth connection.
The business models used in civil aviation
The history of civil aviation industry began at 17 December 1903 with the Wright Brothers first engine flight. After 1903 flight trials were done a few years. Between 1914-1918, World War I happened. After World War I, in 7 October 1919 first commercial airline was established which named as KLM Airlines? This was the year of beginning of the airline industry and also full service carrier (traditional or legacy carrier) strategy. With the development of Southwest Airlines in 29 March 1971 (firstly established in 15 March 1967 but took the name of Southwest Airline Company in 29 March 1971) low cost carrier (LCC) strategy began. After this strategy started, other flag carrier airlines’ (like KLM Airlines) strategies were named as full service carrier (FSC). Several LCC model airlines were set up in the European Continent during the late 1990’s to the early 2000’s. Furthermore, Ryanair which is the biggest scale LCC was established in 1985 as FSC, but changed its strategy as LCC in 1991. However, other numerous LCC model airlines were established during the late 1990’s to the early 2000’s. During the mid-2000’s, LCC model entered into Asian continent after that China and Indonesia. At the last period of 2000’s, LCC model spread all over the world. The years of 2000’s civil aviation industry has seen too many samples about LCC model airlines, but most of these airlines centered on the USA and European Continent [10,11] (Table 1).
Table 1: Strategic comparison between FSC and LCC models.
| Variables | FSC model airlines | LCC model airlines |
|---|---|---|
| Business Model | Global strategy and high costs. | Niche strategy and low costs. |
| Network | Hub and Spoke Strategy and Centre Airports with Global Alliances. | Point to Point Strategy and Secondary Airports. |
| Fleet | Various types of aircrafts such as wide body aircrafts for long haul flights and narrow body aircrafts for short haul flights. | Standardization in types of aircrafts such as one to three types narrow body aircrafts for solely short haul flights. |
| Product | Full Service Strategy with high comfort service level. | Low Cost Strategy with low comfort self-service level. |
| Sales Policy | Global Distributions System (GDS), sales departments, direct sales, call centres and internet. | Sales departments, direct sales, call centres and internet. |
LCC model came late to China, so several researches could center on China which has one of the most developing air transport market in the world since the last period of 2000’s. With making attentive analysis, a technique that named as importance performance analysis (IPA) examined the differences between customers’ exceptancies and perceptions about the initial LCC model in China, Spring Airlines and development strategies that was preferential and suggested [12]. In LCC model the significant factors that affected passenger intentions does not examined in detail because in this model solely cheap ticket fare strategy is important. To reach a more successful LCC model like Ryanair, airlines should find reasons which affected passenger decisions in a more detailed way. Decision making processes should be well done and enforceable. In this way LCC model has similarities between FSC models. These similarities are; service expectancy, service perception, service worth, passenger pleasure, airline image, and behavioral intentions. These factors are confirmed the status of an airline as can take outcomes and get feedbacks from passenger intentions in a planned system [13].
Civil aviation industry declined substantially primarily in the USA and all over the world during the economic recession which affected many nations. First of all, business industry was affected from this international economic recession which ends up with significant reduction in foreign currencies. Civil aviation industry is affected primarily from all economic crisis and developments all over the world simultaneously [14]. The first decade of the 21st century was a period overlapped as a session of development for LCC model and reduction for FSC model [15].
Primarily, LCC model focused on leisure passengers that travel for the purpose of holiday, spare time and entertainment, however, LCC model also seized the business passengers that travel for the purpose of labour, working and significant job descriptions. Especially, this trend has been more evident in European countries and Brazil which has the growing country in civil aviation [16]. During regressions when business passengers’ price susceptibility rises, this situation directs business passengers to be close to leisure passengers related with their purchasing decisions. In this way, LCC model charms business passengers and these passengers start to intrude the market niche anciently commanded by FSC model [17].
The strategic collation among FSC and LCC model is first of all the fare of tickets. LCC model airlines are mainly characterized by integration avoid from implementing use of network effects. They carry out point to point strategy instead of network strategy. While FSC model airlines use the center airport of a country, LCC model airlines use the secondary airport of a country like Charleroi for Brussels, Hahn for Frankfurt and Stansted for London. Their mission is applying inexpensive costs, decrease delays, shorter turnaround times (the time which an aircraft stand in the apron before taking off) and lower distribution costs than FSC model airlines [18,19].
Reliability measurements with database substructure
Identifying the specifications for reliability is the first and most important task in template estimates on civil aircraft processes. The reliability requirements are often expressed in reliability models in terms of quantitative reliability indexes. For this purpose, different based studies and their variables were used to explain the demand to detect reliability for civil aviation. Moreover, detect using dynamics techniques such as ARIMA model, VAR (Vector Auto Regressive) model and Vector Error Correction Model (VECM) are also available for previous studies to demand estimations related to civil aviation.
Within the process dynamics Suryani et al. [20] projected runway and terminal values and factors were selected at this time influencing airfare, service level (LOS), GDP, population, number of daily flights and their turn-arounds. In order to predict demand, there is a problem that requires prediction of various variables. Andreoni et al. [21] predicted air demand through the ARIMA model without the comparison. In this paper, compared models are derived by applying the per capita income and the number of flights to the ARIMA model. Hur et al. [22] have seasonal VAR model for analyzing the relationship between time series than seasonal ARIMA model which is univariate time series analysis. Passenger Demand Model was estimated by Baik et al. [23] within simple time series model and partial adjustment model using monthly time series on total dataset. Demanded Model is using the time series takes into external factors such as social and economic conditions without any limitation. Lee YH et al. [24] predicted international air traffic demands on regression analysis were with based passenger demand by applying the weight ratio. These regression analyses were performed to detect and consume the characteristics of time series data for the existing air demand forecasting methodology. The UK Department for Transport (2011) studied not only on aeronautical estimations in the UK, but also predicted CO2 emission to describe how the aviation industry affected the UK environment. So in this paper, fluctuations on civil aviation reliability level depends in each region, the explanatory power of previous air demand estimations was high and the coefficient of determination (R²) values of 0.6-0.9 are shown.
Reliability factors
The identification of the reliability factors is the fundamental parts for the engineering developments (e.g. technological innovations regarding physical, aerodynamic and economic conditions of build-up materials and software) of the civil airplanes and planning of the ground control units and airport utilities. These various classifications are often expressed in terms of quantitative reliability indexes. In case of this paper, passenger increment correlations due to time dependent variance provide a quantity relation in terms of reliability in civil airplane usage in Turkey; one of the most growing acceleration levels of airplane usage observed in Europe. Furthermore, operational reliability indexes (ORIs) are used to determine the anomalies of the airplane preferences regarding to actual operational, environmental and maintenance factors of the airplanes. In Turkey, airline preferences of the customers were expressively increasing within the last two decades (Figure 1) with significant model slope rates around 36° (Figures 2 and 3) and this increment also be irresponsive no matter what on reliability factors (e.g. a terrorist attack to İstanbul Airport in 2016, major earthquakes occurred in Marmara Region 1999, 2000 and unstable political conditions with one military coup.

Figure 1: Amount of passenger and freight over the 50 years of history in Turkey.

Figure 2: Ratio between passenger/freight for each year in the time between 1960-2017 for Turkey. Note that, passenger cluster contains both domestic and international flights and the freight cluster covers cargo, post and baggage clusters (Dataset is proved by TACA).

Figure 3: Display of seasonal periods in passenger ratio from 1970 to 2017.
However, the increment is not only time dependent but it is also fluctuated by the particular events and newly developed airplane and airport designs (Figures 1-3). Although Turkish customers did not seem to care which model of the airplane is in the past, it became a habit or trend to choose the airplane and the inflight services especially within the last decade (Figure 1). Therefore, the method here is to construct a time dependent variance of the passengers throughout almost 60 years by correlating the results with the following parameters: (1) freight, (2) domestic and international flights, (3) types of airplanes and (4) purpose of the flight (passenger or cargo).
Methodology adopted
The characteristics of the time series data noted are largely related to and can be distinguished from the balance between the stability and the data variables themselves. So that, this part therefore discusses both theories whereas developing on civil aviation demand measuring economic model with discuss characteristics of time series dataset and analysis on how data changes over time. The balance of variables is determined for to analyse the strength of linear relations between variables. If any significant connection or correlation persists, it is possible to develop the model more precisely.
Datasets
The national flag carrier with main investment area of Turkey, Turkish Airlines Corporation (THY) was established in 1933 under the name of “Airline State Administration” and have not any competitor in 1933-1991 period on domestic routers. In 1991 which have rapid economic growth in local region; private companies are invested on airline and ground control units has now reached 55 airports, 156 aviation businesses and 13 airline companies on domestic or international services. Time dependent annual datasets of the passenger and cargo unit values are construed for the model estimations are composed from the Turkish Authority of Civil Aviation (TACA; TUIK, 2019).
Stationary of time series data
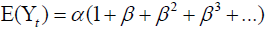
Stationary time series data mean that, variability, etc. will not change in time series over time while nonstationary time-series data is equivalent to t data. A time series whose mean and variance vary according to the data of the year over time. If regression analysis with unstable time series data with time trends, dependent and independent variables is performed. Although no causal relationships exist, the coefficient of regression is important and the determination coefficient may be also strong and referred to as spurious regression [25]. In time series models, it is used Auto Regressive Model (ARM) to verify the stability on these relationships. In Eqn (1), Y is multiplied by the year t’s y value (t-1), that is the amount of α (drift) and the year’s β and Y ‘ value (t-1). The estimates α and β and parts that cannot be explained by ε are included in Eq (1) and Eq (2) derivate from Eq (1) within the Y value of year t is used as the previous year value.
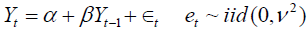 (1)
(1)
 (2)
(2)
Since the mean of the error value of each year multiplied by the square of β is finally 0, the mean of Y values in year t is Eq (3). In other words, if the absolute value of β is greater than 1, the average value of Y in t is different and if less than 1, it is similar to Eq (5) and derivate from Eq (4).
 (3)
(3)
 (4)
(4)
 (5)
(5)
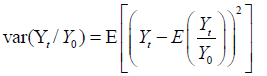
For “reliability” estimation, cases are chosen and evaluated for the constant length and the time pattern exists. As the features of the raw data can be established, the unit root analysis and unit root test should be done. Because of this reason, Augmented Dickey-Fuller (ADF) test is performed. Figures about Air Passenger and Freight Numbers are given in Figures 1-7.

Figure 4: Monthly air passenger boxplot from 1970 to 2017 and decomposition of multiplicative time-series based dataset.

Figure 5: Decomposition of multiplicative time-series based dataset from 1970 to 2017.

Figure 6: A derived correlogram and passenger vs. aircraft of domestic and international passengers with the numbers from 1970 to 2017.

Figure 7: Display of seasonal periods and prediction in passenger numbers from 1970 to 2022 based ARIMA forecast function.
Relation between passengers versus freight
Demand to the civil airlines is monitored in terms of the amount of passenger, freight (per passenger) in spatial expand of 60 years of history (Figure 2). Exponential increment of airplane transportation demand has some major fluctuations as seen in Figure 1, however, in variance dependent time series approach fluctuations are rather robust (Figure 3). These systematic fluctuations represent the 1st-6th and 7th-12th months of periods at the same time with the summerwinter cycles in 50 years of history (Figure 3). In Turkey, airplane transportation was increased somehow in exponential trend from 1960 to 2010s. At least 30 times more passengers have chosen civil airlines instead of maritime or domestic bus transportation between the 1960 and 1999 (Figures 1 and 2). After the 2000 increment has reached to inclination point, therefore exponential trend is much more significant in last 20 years (1999 to 2017) (Figures 1 and 3). Number of demand for airplane transportation reached up to almost 200 million people per year (Figure 1) [26-29]. Even though the trend is undoubtedly increasing in such fashion, there are few points that the trend was oscillating in terms of the number of passengers. Between 1993 to 1995, 2000 to 2003 and 2006 to 2008, the trend was fluctuating and decreasing in 1-2% percentage total amount of passengers. Almost similar exponential trend can be seen for freight per year (Figure 1). However, the fluctuations in the number of passengers are not compatible with the amount of freight showing that the freight accumulation over the years was more stable than the increasing number of passengers (Figure 1 and 2). Fluctuated time intervals (1993-1995, 2000-2002 and 2006-2008) had the same increasing trend in terms of freight (Figure 1). When the passenger and the freight clusters were correlated year by year the freight amount seem to be decreasing to the point of year 2001. The freight accumulation was slightly increased regardless to the exponential increase in passenger demand after 2001 (Figures 1 and 2).
The constant increase of passenger demand on the airline transportation somehow connected with the demand of technological impact over the last 30 years. People demand more rapid and uncomplicated methods in their daily lives in general. Even though transportation though the airports can be problematic in megacities like İstanbul, demand of airlines is definitely becoming popular when the number of passengers is concerned (Figures 1 and 3). It is safe to state that Turkish passengers became much more accustomed to the airlines after 2000 (Figures 1 and 3). More sophisticated airline services and the eligible options of the airline companies were enough to draw the attention of Turkish customers over the years. According to the ratio between domestic and international passenger suggests that domestic passenger demand is higher than international demand over the years (Figures 1 and 3). Therefore, people started to choose airplane transportation compared to land transportation and marine transportation (Figures 1 and 5). Moreover, the secondary airport in İstanbul (Sabiha Gökçen) has been activated in 2001 thus, the inclination point of the amount of passenger increment is directly related with the availability of the airport number in İstanbul (Figures 1, 3 and 5).
When the amount of freight is nearly having the same trend with the amount of passengers, there are distinct differences between the increment ratio over the last 50 years (Figures 1 and 5). While people accustomed to the usage of airplane transportation, they hereby acknowledged the airplane transportation. Therefore, more spontaneous vacations and occasions have been considered with the airline transportation. So that, passengers used airplanes with less and less freight started until 2000s (Figures 1 and 2). Accumulated increment is rather indisputable; however, there are several periods that passenger and freight ratios have minor decrease around the years between 1993-1995, 2000-2002 and 2006-2008 (Figures 1 and 2). Even though Sabiha Gökçen Airport has been active since 2001, between the years 2006-2008 have also the similar outcome in case of passenger-freight decline similar between the years 1993- 1995 and 2000-2002. Major decreases could not be related with the reliability factors or the developments of airplane companies; however, there should be external parameters that manipulate the demand of passengers. In Turkey’s most recent historical political and economic trend is directly affecting the inflation and the ratio of the price hikes, thus, these decreases very well correlated to the most recent economic crises in Turkey’s history (Economical crisis or contractions in the years of 1994, 2001 and 2007).
The liberalization about flow of capital in 1989 was another consequence of instability for the Turkish economy. As unsustainable short-term capital inflows due to high real interest rates have contributed to overvaluation, domestic currency has diminished the profitability of exporting companies. This was a major matter for Turkey’s economic dynamics such as growth strategy was constructed on export profits. In order to Arı describes for these existing expenditures (as in almost 5% of GDP prior to the 1994 and 2000-01 crises), the world needed more capital inflows, which continuously raised the ratio of short-term foreign debt to international reserves.
Airplane transportation is not restricted by the demand of passenger but also demand of fast delivery is also made a tremendous impact on the ratio of total freight trend in 60 years (Figure 2). The exponential increase in freight has an inclination point around 2001 (Figures 1 and 3). That is because after Sabiha Gökçen Airport has been activated in İstanbul, shipping companies have rented huge amount of stock in airplane freight capacities in order to provide faster delivery for their customers. Meanwhile, this development followed the trend of internet shopping as well. Within development conditions and their reflection on population in virtuous indicator levels in Turkey has six airline companies which of them options created the competition between the companies, resulted by campaigns and increasing comfort for possible passengers. Within the last 50 years, Turkish passengers started to choose more abundantly to use airlines could be resulted for both leisure and business trips as shown in Figures 1-3. Therefore, the airline companies have met increasing trend of demand by acquiring more airplanes to grow flight locations, Turkish Airlines still have first place 120 flight locations ongoing among European flagships. These organizational traits are commonly synonymous with lack of productivity, deprived profitability, underprivileged return on investment, inequality and lack of social service activities for customers. These adverse signs can also be reversed, as seen in Figure 5.
As a result, legislators would follow the recommendations and plans of both Turkish Airlines 2020 and Turkey’s Project 2023 by considering upgrading the civil aviation system. National airport development programs extend public private partnership (PPP) initiatives, increase the number of airports in major cities and develop long-term relationships with foreign airlines and carriers. Finally, the advancement and innovation in the fast-growing civil aviation market driven by a steady population growth pattern would have a significant effect on the development of the economy as a whole and will have a much more favorable influence on rivals such as Heathrow, United Kingdom (Figure 5) with private sector partnerships. This will eventually contribute to a diversified and prosperous economy. Beyond all this kind of advice and interventions with respect to foreign markets, the civil aviation market in Turkey has even more prevalent innovations and has more than 220 million passengers forecasted by the ARIMA model in Figure 7.
The required short and annual time series are a significant constraint that may influence the accuracy of the findings of this analysis. This is attributed to the lack of long-range data available for Turkey in general and for the civil aviation sector in particular. This thesis invites potential studies using qualitative methodology to further explore the connection between civil aviation and economic development.
The author would like to thank the incorporated critics for their precious suggestions that prominently advanced the paper related with high reliability organizations (HROs) in civil aviation industry for to analyze domestic developments between the years of 1970- 2017 in Turkey.
Citation: Inan TT (2020) Application of High Reliability Organizations (HRO) in Civil Aviation Related With Civil Aviation Business Models as an Overview. J Aeronaut Aerospace Eng. 9:222. doi: 10.35248/2168-9792.20.9.222.
Received: 11-Apr-2020 Accepted: 27-Jul-2020 Published: 03-Aug-2020 , DOI: 10.35248/2168-9792.20.9.222
Copyright: © 2020 Inan TT. This is an open access article distributed under the term of the Creative Commons Attribution License, which permits unrestricted use, distribution, and reproduction in any medium, provided the original work is properly cited.