Journal of Fundamentals of Renewable Energy and Applications
Open Access
ISSN: 2090-4541
ISSN: 2090-4541
Research Article - (2021)
With the aim of developing a process of biodiesel production that is environmentally benign greater interest is been focused on the use of solid base catalysts, such as calcium oxide, for the transesterification of vegetable oils. Snail shell was subjected to calcination–hydration–dehydration treatment to obtained CaO. The resulting CaO catalyst was characterized using XRF, XRD and FTIR analysis. The optimization process was carried out using Box-Behnken design on Design Expert (version 6) software. The effect of reaction variables such as temperature (˚C), reaction time (min), methanol to oil ratio and catalyst concentration (g) on the transesterification process was investigated. The model developed showed optimum conditions for biodiesel production as follows: Catalyst concentration of 0.5 g, temperature of 60˚C, methanol to oil ratio of 9:1 and reaction time of 120 min. The optimal yield of methyl esters obtained is 94.62%. The study revealed that the crucial fuel properties of the biodiesel produced at the optimum conditions met the ASTM biodiesel specifications.
Marula seeds; Snail shell; Optimization; Biodiesel
Materials
The sample fruits of Sclerocarya birrea were obtained from Maniya village of Tambuwal local government, Sokoto state. The seeds kernel were expose mechanically, dried and then grinded. The snail shells were procured from local supplier in Sokoto state, Nigeria. All other chemicals used were of analytical grade.
Catalyst preparation
The CaO catalyst was obtained via calcination–hydration– dehydration treatment of snail shell. Snail shells were washed thoroughly in tap water to remove unwanted material on its surface, and then rinsed severally with distilled water. The washed snail shells were then dried in oven. The dried snail shell was powdered and calcined in a muffle furnace under static air conditions at 800˚C for 3 h to transform the calcium species in the shell into CaO particle. It was then refluxed at 60˚C for 6 hour, the paste was filtered, dried in hot air oven at 105˚C overnight. The solid product was dehydrated by performing calcinations at 800˚C for 3 h to change the hydroxide formed to oxide Yoosuk et al. [8]. The calcined sample was kept in closed vessel to avoid reaction with carbon dioxide in the atmosphere before used and was referred to as CSS in subsequent discussion.
Catalyst characterization
XRD, FTIR and XRF analyses were performed to evaluate the structure, functional group and composition of the prepared catalyst. XRD measurements were carried out on a PAN- analytical England Empyrean diffractometer with Cu-Kα radiation of wavelength 1.54060 Á at the National Geological Research Laboratory (NGRL), Barnawa Kaduna. Functional groups were identified in the samples using FTIR analysis using Carry 630 model spectrophotometer. The transmission rate was set at the range of 4000-650 cm-1, using Transmittance method. Catalyst constituents were determined using X-Supreme 8000 Fluorescence Machine at Department of chemistry Multi-user Science Laboratory Ahmad Bello University, Zaria.
Oil extraction
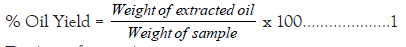
Oil from marula seeds was extracted using Soxhlet extractor (with n-hexane). The grounded seeds sample (50 g) was placed in thimble plugged with a piece of cotton wool and inserted into Soxhlet extractor. A reflux condenser was fitted onto Soxhlet extraction column and the set up was placed on heating mantle, heated to a temperature of 60˚C to vaporize the solvent. The extraction lasted for six hours after which the flask was allowed to cool and the thimble was removed. The set up was reassembled to recover the solvent. The flask containing the extracted oil was dried in air oven at 65˚C for 30 minute to expel the remnant solvent [9]. The flask was then weighed and percentage oil yield calculated using equation 1.
Design of experiment
The experiment was designed using Response Surface Methodology (RSM) Box-behnken design on DesignExpt-6. The four reaction variables considered are: Reaction time, methanol to oil ratio, reaction temperature and catalyst concentration. Table 1 lists the levels of the four reaction variables. The complete design matrix corresponding in terms of real reaction variable and biodiesel yield is given in Table 2, as presented.
| Factors | Name | Type | Low level | High level |
|---|---|---|---|---|
| A | Temperature (˚C) | Numeric | 55 | 65 |
| B | Time (min) | Numeric | 60 | 120 |
| C | Cat amount (g) | Numeric | 0.5 | 1.5 |
| D | MeOH/Oil | Numeric | 6 | 12 |
Table 1: Design summary.
| Std | Run | A: Temperature (˚C) | B: Time (min) | C: Catalyst amnt (g) | D: MeOH/Oil ratio | Actual yield(%) | Predicted yield (%) |
|---|---|---|---|---|---|---|---|
| 25 | 1 | 60 | 90 | 1 | 9 | 77 | 75.93 |
| 11 | 2 | 65 | 90 | 1 | 12 | 75.01 | 75.32 |
| 18 | 3 | 60 | 90 | 0.5 | 6 | 91.26 | 90.84 |
| 27 | 4 | 65 | 90 | 0.5 | 9 | 90.5 | 89.91 |
| 13 | 5 | 60 | 120 | 1.5 | 9 | 87.2 | 87.49 |
| 22 | 6 | 60 | 90 | 0.5 | 12 | 88.49 | 88.09 |
| 10 | 7 | 60 | 90 | 1 | 9 | 74.89 | 75.93 |
| 16 | 8 | 60 | 90 | 1 | 9 | 75.89 | 75.93 |
| 9 | 9 | 65 | 90 | 1.5 | 9 | 75.79 | 76.16 |
| 15 | 10 | 55 | 90 | 1 | 6 | 78.72 | 79.18 |
| 4 | 11 | 60 | 60 | 1 | 12 | 73.27 | 73.35 |
| 20 | 12 | 55 | 90 | 1 | 12 | 73.56 | 74 |
| 5 | 13 | 60 | 120 | 0.5 | 9 | 94.62 | 96.31 |
| 7 | 14 | 65 | 60 | 1 | 9 | 78.38 | 78.5 |
| 21 | 15 | 55 | 90 | 0.5 | 9 | 87.99 | 87.11 |
| 17 | 16 | 65 | 90 | 1 | 6 | 76.19 | 76.52 |
| 6 | 17 | 60 | 120 | 1 | 12 | 85.82 | 85.23 |
| 26 | 18 | 60 | 120 | 1 | 6 | 84.92 | 84.33 |
| 3 | 19 | 65 | 120 | 1 | 9 | 81.23 | 80.69 |
| 12 | 20 | 60 | 90 | 1.5 | 6 | 80.86 | 81 |
| 19 | 21 | 60 | 60 | 0.5 | 9 | 89.49 | 89.97 |
| 14 | 22 | 60 | 60 | 1 | 6 | 80.54 | 80.62 |
| 8 | 23 | 60 | 90 | 1.5 | 12 | 77.21 | 77.37 |
| 1 | 24 | 55 | 60 | 1 | 9 | 73.3 | 73.57 |
| 23 | 25 | 55 | 90 | 1.5 | 9 | 80.22 | 80.3 |
| 24 | 26 | 55 | 120 | 1 | 9 | 87.35 | 86.97 |
| 2 | 27 | 60 | 60 | 1.5 | 9 | 79.27 | 78.23 |
Table 2: RSM Design matrix with actual and predicted biodiesel yield from marula seeds oil.
Transesterification reaction and analysis of methyl esters
The transesterification reaction was carried out with methanol/ oil ratio (6: 1, 9: 1 and 12: 1), using 0.5, 1.0 and 1.5 g of CSS as solid catalyst. The oil was preheated in a beaker at 100˚C to remove any moisture. The required proportion of methanol and catalyst were added to the heated oil, the mixture then placed in a water bath for a specified period of time and temperature with constant shaking. The reaction was carried out at 55˚C, 60˚C and 65˚C reaction temperature and the reaction times were 60, 90 and 120 min. The choice of said variables and their levels were based on literatures. The reaction product was allowed to settle overnight in a separating funnel, in order to collect the biodiesel layer.
FAMEs were analysed using GC-MS 7890B, Agilent Tech. 0.5 cm3 of the sample was transferred into a 15 cm3 plastic centrifuge tube and to it, n-hexane (1.0%) was added and then votex mixed for 10 min. The mixture was centrifuge at 3500 rpm for 10 min. The supernatant (1.0 uL) was injected into GC. The oven temperature was initially set at 80˚C, hold time 0 min with an equilibration time 0.5 min and maximum temperature of 325˚C.
Increased demands for energy and consciousness about the environment have led to the search for an alternative fuel. Biodiesel is considered to be one of the most alternative fuels for diesel engines [1]. Transesterification is the most oftentimes employed technique for biodiesel production by usage of acid or base catalyst. Transesterification reaction can be catalyzed with the aid of homogeneous or heterogeneous catalysts (Figure 1). The major contributor to the biodiesel production cost is the expenses of feedstock. The type of catalyst used in biodiesel production is observed to contribute more than 50% of the production cost hence a pressing need to undertake a less expensive and superb catalyst [2].

Figure 1: Mechanism of CaO catalyzed transesterification reaction.
The conversion of triglycerides by homogeneous catalysis increases cost of biodiesel production due to non-reusability of the catalyst, soap formation and problems in handling and separation [3]. To address these problems heterogeneous catalysts have been developed. These catalysts can be separated easily from the reaction mixture, reused severally and are much less corrosive.
However, these streams of heterogeneous catalysts require expensive materials; have complicated synthesis routes and record low catalytic activity. Bio-based catalysts emerged as the leading alternatives owing to their immense advantages. They have an easy synthesis rout, readily abundant and environmentally benign, thereby reducing total cost of biodiesel production [4].
Among these heterogeneous catalysts, calcium oxide has derived researcher’s interest due to the fact it is an affordable, abundantly accessible in the nature and reusable. However, it requires no pretreatment for disposal into the environment [5].
Few studies are reported in the literature on biodiesel production from marula seeds oil [6] and Edward et al. [7]. Currently, no literature is reported on biodiesel production using calcium oxide as a heterogeneous catalyst for the transesterification of marula seeds oil to biodiesel. Hence, the aim of this study is to carry out an optimization study on biodiesel production from marula seeds oil using CaO derived from snail shells. The physical and chemical properties of the catalyst were characterized using X-ray Fluorescence (XRF), X-ray diffraction spectroscopy and Fourier- Transform Infrared Spectroscopy (FTIR).
Catalyst characterization
The compositions of the CSS catalyst were determined using XRF. Calcium oxide was the major component (97.35%) in the CSS catalyst. In addition, 0.053% of elemental chlorine and small amount of oxides such as MgO, Al2O3, SiO2, P2O5, K2O, Fe2O3, ZnO and SrO were also observed (Table 3). XRD spectra of the Calcined Snail Shell (CSS) was also recorded and analyzed. From Figure 2, it can be seen that the peaks due to CaO were observed at 2θ=32.37˚, 37.55˚, 54.03˚, 64.37˚ and 67.65˚. The sharpness of the peaks of the CSS revealed its crystalline nature. The results matched well with papers reported by Hu, Ikbal et al. [8,10]. Moreover peaks due to Ca(OH)2 appeared at 2θ=17.87˚, 28.55˚, 34.18˚, 47.51˚ and 50.71˚. The formation of Ca(OH)2 was due to the absorption of H2O in the air. No any characteristic peaks of CaCO3 were observed. This shows that the conversion of CaCO3 (in the snail shell) to CaO is completed at 800˚C for 3 h. This conclusion is in agreement with that reported by Wuttichai et al. [11], that temperature of at least 800˚C is required to transform CaCO3 to CaO.
| Oxides | Concentration (wt%) |
|---|---|
| MgO | 0.055 |
| Al2O3 | 0.631 |
| SiO2 | 1.579 |
| P2O5 | 0.079 |
| K2O | 0.097 |
| CaO | 97.352 |
| Fe2O3 | 0.045 |
| ZnO | 0.006 |
| SrO | 0.1 |
Table 3: XRF Composition of CSS.

Figure 2: XRD diffractogram of CSS.
FTIR spectra were also recorded for calcined snail shell at 800˚C and uncalcined snail shells powder to determine the absorption bands of the materials present. The FT-IR spectra of the uncalcined snail shells and calcined shells are presented in Figure 3 and Figure 4. For the uncalcined snail shells the major band found at 1468.6 cm-1 may be ascribed to asymmetric stretching of CO3 2- molecules and the other two bands at 711.9 and 857.3 cm-1 could be due to out-plane and in-plane modes of vibration for CO3 2- molecules [12]. These bands might be attributed to the presence of CaCO3 in the snail shell. The calcination causes loss of CO3 2- ion which leads to shift in the absorption band to high energy (875.9 cm-1). This is due to a decreased in the mass of the functional group associated with the CO3 2- ions [12]. The presence of CO3 2- ions decreased with an increase in heat, this is confirmed by FT-IR spectrum in which the band at 1468.6 cm-1 broader in uncalcined shell and weaker at 1420.1 cm-1 after calcination. The appearance of a new peak at 3461 cm-1 in the calcined shell spectrum implied the presence of Ca(OH)2 due to airing of CaO [10].

Figure 3: FT-IR Spectrum of Snail Shell Powder.

Figure 4: FT-IR Spectrum of CSS.
Generation of regression model
In order to choose the suitable model, a fit test was carried out. The quadratic model was chosen due to its insignificant lack of fit and secondly the model was not aliased as seen in Table 4.
| Source | SS | DF | MS | F-Value | Prob˃F | |
|---|---|---|---|---|---|---|
| Linear | 503.88 | 20 | 25.19 | 22.61 | 0.0432 | |
| 2FI | 437.5 | 14 | 31.25 | 28.05 | 0.0349 | |
| Quadratic | 8.14 | 10 | 0.81 | 0.73 | 0.7015 | Suggested |
| Cubic | 1.84 | 2 | 0.92 | 0.83 | 0.5475 | Aliased |
| Pure error | 2.23 | 2 | 1.11 | |||
Table 4: Lack of fit test.
Optimization of transesterification conditions
The correlation between the experimental process variables and the response (% FAME Yield) was evaluated using the Response surface method. Twenty seven experiments were performed in a randomized order. The results of actual and predicted biodiesel yield are presented in Table 2. The ANOVA results showed that the quadratic model is suitable to analyze the experimental data. The model equation in terms of the coded values of the reaction variables is given by:
YIELD (%)=+76.15–0.34A+3.90B–5.14C–1.59D+4.24B2+7.67C2– 2.80AB–1.73AC+2.04BD
The data was evaluated using the Analysis of Variance (ANOVA) to find out the quality of the fit. The significance of each coefficient parameter was determined by probability value (��-value) as shown in Table 5. At the 95% confidence level, the model F-value of 84.86 implies the model is significant. Values of “Prob>F” less than 0.0500 indicate the model terms are significant while values greater than 0.1000 indicate the model terms are not significant. From Table 5, the significant model terms are B, C, D, B2, C2, AB, AC and BD.
| Source | Sum of squares | DF | Mean square | F–Value | Prob>F | |
|---|---|---|---|---|---|---|
| Model | 1026.91 | 14 | 73.35 | 84.86 | <0.0001 | significant |
| A | 1.36 | 1 | 1.36 | 1.57 | 0.2336 | |
| B | 182.29 | 1 | 182.29 | 210.88 | <0.0001 | |
| C | 317.04 | 1 | 317.04 | 366.77 | <0.0001 | |
| D | 30.5 | 1 | 30.5 | 35.28 | <0.0001 | |
| A2 | 0.52 | 1 | 0.52 | 0.6 | 0.4544 | |
| B2 | 99.42 | 1 | 99.42 | 115.01 | <0.0001 | |
| C2 | 320.85 | 1 | 320.85 | 371.18 | <0.0001 | |
| D2 | 2.18 | 1 | 2.18 | 2.53 | 0.1379 | |
| AB | 31.36 | 1 | 31.36 | 36.28 | <0.0001 | |
| AC | 12.04 | 1 | 12.04 | 13.93 | 0.0029 | |
| AD | 3.96 | 1 | 3.96 | 4.58 | 0.0536 | |
| BC | 2.13 | 1 | 2.13 | 2.47 | 0.1423 | |
| BD | 16.69 | 1 | 16.69 | 19.3 | 0.0009 | |
| CD | 0.19 | 1 | 0.19 | 0.22 | 0.6445 | |
| Residual | 10.37 | 12 | 0.86 | |||
| Lack of fit | 8.14 | 10 | 0.81 | 0.73 | 0.7015 | not significant |
| Pure error | 2.23 | 2 | 1.11 | |||
| Std. Dev. | 0.93 | R-Squared | 0.99 | |||
| Mean | 81.44 | Adj R-Squared | 0.9783 | |||
| C.V. | 1.14 | Pred R-Squared | 0.9499 | |||
| Adeq precision | 33.129 | |||||
Table 5: ANOVA results of biodiesel yield from marula seeds oil.
The testes model was satisfactory for predicting the yield within the range of experimental variables. The lack of fit is not significant relative to the pure error. Significant lack of fit is an indication that there might be a contribution to the relationship that is not taken into account by the model [13]. Therefore, there were enough experiments to study the effect of variable factors on the yield [14]. The pred. R-squared of 0.9499 is in reasonable agreement with the Adj R-Squared of 0.9783. The predicted values versus actual values for biodiesel yield with adj-R2 value (0.9783) indicated the model with 97.83% of variability as shown in Figure 5. A normal probability plot of residuals shows that the errors are normally distributed in a straight line (Figure 6).

Figure 5: Predicted versus actual biodiesel yield (%).

Figure 6: Normal probability plot of residual.
Effect of transesterification variables on biodiesel yield
The effects of reaction time and temperature on biodiesel yield is presented in Figure 7a and Figure 7b. The two dimensional interaction plot revealed the longer the reaction time, the higher the yield when catalysts concentration and methanol to oil ratio ares fixed at 1.0 wt% and 9: 1. However at longer reaction time and higher temperature, the yield decreases as high reaction temperature causes vaporization of methanol as time prolong. However, the contour plot showed high yield was prefered at higher levels of reaction time with low to intermediate levels of reaction temperature.

Figure 7: Effects of reaction time and temperature on biodiesel yield (a) two dimensional interaction plot and (b) contour plot.
The effects of reaction time and methanol to oil ratio when temperature and catalyst concentration were fixed at 60˚C and 1.0 wt% is presented in Figure 8a. As seen from the figure at a molar ratio of 12: 1 (D+) the yield of FAME increases rapidly with longer reaction time from 73.35%-85.82%. However, the increase in the yield of FAME with reaction time is much slower at molar ratio of 6:1 (D–), only from 80.54%-84.33%. This trend shows that the higher the molar ratio, the facter the reaction rate. Excess methanol shift the transesterification reaction forward resulting in higher conversion of FAME. From the contour plot (Figure 8b), the shape of contour plot revealed that more than 75% of FAME content was yielded at low to intermediate methanol to oil ratio while reaction time at intermediate and high levels.

Figure 8: Effects of methanol to oil ratio and reaction time on biodiesel yield (a) two dimentional interaction plot and (b) contour plot.
The interaction of catalyst concentration and reaction temperature is shown in Figure 9, the interaction plot (Figure 9a) revealed that at lower level of catalyst amount biodiesel yield increases with reaction temperature. Lee et al. (2011) reported that high temperature enhanced the dispersion of catalysts particle in a liquid medium which improved the yield. At catalyst amount of 1.5 g, biodiesel yield decreases with increased in reaction temperature. This could be due to saponification of the triglycerides at high catalyst loading and temperature [15]. This observation was in agreement with the pattern from the contour plot (Figure 9b) which showed increased of biodiesel yield at high reaction temperature (60˚C) with low level of catalyst concentration.

Figure 9: Effects of reaction temperature and catalyst amount on biodiesel yield (a) two dimensional plot and (b) contour plot.
Methyl esters profile of the biodiesel
GC-MS was used to determine the methyl esters composition of the biodiesel. The methyl esters detected in the biodiesel (B) in comparison with some previous studies A, C and D as reported by Christopher et al. [6], Gandure et al. [16] is shown (Figure 10). The fatty acids methyl esters observed in this study were similar to those reported in previous researche. The oleic and palmitic acid methyl esters were predominant, having percentage area of 45.40% and 22.9% respectively. The percentage area observed for stearic, arachadic, palmetoleic and myristic acid methyl esters were 9.5%, 1.3%, 1.2% and 0.1% respectively. As evident from Figure 10, some researchers reported the presence of linoleic methyl ester but are not observed in this study. The growth condition, quality of the feedstock and the location in which the plant grown may affect the composition of the fatty acid [17].

Figure 10: Fatty Acid Methyl Esters Profile of the Biodiesel in Comparison with 
Physicochemical properties of marula seeds oil biodiesel
The results of physicochemical properties of marula seeds oil and methyl esters produced using calcined snail shell as catalyst are shown in Table 6. The percentage of marula oil extracted is 42.97 ± 7.79 as shown in Table 5. The yield obtained is comparable to 43.24% and 44.10% reported by Gadissa et al. [7,18], but lower than 58.55% reported by Gandure et al. [19]. The difference in yield could be ascribed to variation in climate, plant species, soil condition, extraction techniques and prolong exposure of the seeds to sunlight which is capable of reducing the yield considerably [20]. The result indicates that the seeds are good source of oil for commercial extraction. The fuel properties of marula oil biodiesel were compared with ASTM specification. The characteristics of the biodiesel produced from marula seeds oil (Table 6) adequately satisfied the relevant standard for biodiesel quality with exception of kinetic viscosity, which slightly exceeded the specified limit (1.9-6 cst) [21].
| Properties | ASTM Limit | Values | Method |
|---|---|---|---|
| Oil yield | - | 42.97 ± 7.79 | - |
| Specific gravity | 0.86-0.90 | 0.890 ± 0.001 | - |
| Kinetic viscosity (cst) | 1.9-6.0 | 7.6 ± 0.026 | ASTM-D93 |
| Flash point (˚C) | 100-170 | 170 ± 0.333 | ASTM-D93 |
| Pour point (˚C) | -15 to -10 | -4 ± 0.000 | ASTM-D93 |
| HHV (kJ/kg) | - | 38.29 | - |
| Moisture content (%) | Max (0.05) | 0.01 ± 0.004 | ENISO1293 |
| Sulphated ash (%) | Max (0.02) | 0.02 ± 0.000 | ASTMD874 |
| API gravity | - | 27.5 | - |
| Cetane number | 48 to 65 | 61 ± 0.800 | - |
Table 6: Fuel properties of marula seeds oil biodiesel.
The results obtained in this work shown that highly active CaO solid catalyst was successfully obtained through calcination- hydration-dehydration treatment of snail shells. The study revealed that the performance of CaO (derived from the snail shells) in transesterification of marula seeds oil gave an optimal yield of 94.62% of FAME at 60˚C, under an optimized condition of 120 min reaction time, 0.5 g catalyst amount and methanol/ oil ratio of 9:1. The fuel properties of the biodiesel produced at the optimum conditions were within the ASTM biodiesel specifications.
Citation: Muhammad C, Almustapha MN, Tambuwal AD, Idris B, Abdullahi BH (2021) Application of Green Catalyst Synthesized from Snail Shell in Conversion of Marula Seeds Oil to Biodiesel. J Fundam Renew Energy Appl. S1:002.
Received: 08-Nov-2021 Accepted: 22-Nov-2021 Published: 29-Nov-2021
Copyright: © Muhammad C, et al. This is an open-access article distributed under the terms of the Creative Commons Attribution License, which permits unrestricted use, distribution, and reproduction in any medium, provided the original author and source are credited.