Journal of Clinical Trials
Open Access
ISSN: 2167-0870
ISSN: 2167-0870
Research Article - (2016) Volume 6, Issue 5
Purpose: Blinded independent central review (BICR) is advocated by regulatory authorities as a means of minimizing bias and independently verifying endpoints based on medical imaging when the data is intended to support pivotal trials. However, discordance between reviewers at the BICR raises concern with regulators. There are few published metrics related to discordance rates at the BICR. Methods: We analyzed BICR data from 79 oncology clinical trials including interpretations by 23 different radiologist reviewers of 23,476 subject cases. Results: The proportion of cases requiring adjudication across all trials was 42% (95% CI: 41-42%). There is variation based on the indication. There is a significant tendency for the Adjudication Fraction (AF) to increase as the number of adjudication variables increases (p<0.001). There is also a relationship between the average number of target lesions and the AF. In trials for which there were at least 2 targets lesions per patient, the AF decreases as the number of target lesions increases (p=0.020). The data suggests a pattern whereby the AF increases as the number of assessment time points for a subject increase until approximately 7 time points and then decreases (p=0.001). The AF is independent of the response criteria. Conclusion: The AF has multiple dependencies and can be predicted based on modeling of those factors.
Keywords: Blinded independent central review (BICR); Adjudication rates; Discordance rates; Reader metrics; Inter-reader variability
BICR: Blinded Independent Central Review; FDA: United States Food and Drug Administration; DIA: Drug Information Agency; IHP: International Harmonization Project; IWG: International Working Group; ORR: Objective Response Rate; PCA: PChart Analysis; PFS: Progression Free Survival; R1: Radiology Reviewer#1; R2: Radiology Reviewer#2; RECIST: Response Evaluation Criteria in Solid Tumors; TTP: Time to Progression; WHO: World Health Organization
Blinded independent central review (BICR) is the process by which radiographic exams and selected clinical data performed as part of a clinical trial protocol are submitted to a central location for blinded review by independent physicians not involved in the treatment of the patients. Regulatory authorities recommend BICR for oncology registration studies when the primary study endpoint is based on tumor measurements, such as progression-free survival (PFS), time to progression (TTP), or objective response rate (ORR) [1]. Clinical trial sponsors have also used BICR in Phase I and II studies to assist in critical pathway decisions including in licensing of compounds.
There are different BICR review paradigms that are employed; however current United States Food and Drug Administration (USFDA) guidance recommends that multiple independent reviewers evaluate each subject [2]. Consequently, BICR of industry-sponsored pivotal oncology studies generally includes the use of two independent radiologists evaluating each subject blinded to treatment arm, investigator assessments, and all clinical data. In the event there is discordance between the two reviewers on the outcome variable, a third radiologist, the adjudicator, reviews the assessments by the first two radiologists and determines which of the two is most accurate. If the third reader does not agree with either of the two assessments, the third reviewer will read the entire case from the beginning. This third read is considered the definitive assessment. This is commonly referred to as the “Two Readers and Adjudicator Paradigm”.
Although there have been several studies evaluating the differences between investigator review and BICR [3,4] the literature describing variability among radiologists in a BICR is more limited. Discordance between BICR reviewers raises concern among sponsors and regulators because the reasons for discordance are poorly understood and there are few published metrics related to BICR discordance rates.
Here we analyze data from BICRs on a relatively large number of clinical trials with the goals of describing discordance among BICR readers and exploring factors which may be associated with this discordance.
Clinical trial inclusion criteria
This analysis includes 79 oncology clinical trials on which one Imaging Core Laboratory performed a BICR. The criteria for a study to be included in this analysis was the use of a two reader and adjudicator reading paradigm (as described above) and the availability of the data in a particular format in a company database that could be queried. There were no other selection criteria considered and all trials satisfying these criteria were included. This review received an Institutional Review Board waiver as all data was blinded with respect to study sponsor, study protocol number, therapeutic agent under study, subject demographics and identifying information as required by the Health Insurance Portability and Accountability Act. The review was not blinded to indication; however, all trials within a particular indication were blinded.
Definitions of potential modifying factors
For this analysis, information on individual patients was omitted and the data was aggregated at the trial level only. For each clinical trial the following information was queried from the database:
• Indication: The cancer diagnosis for which the treatment was evaluated.
• Average number of time points: The total number of time points at which participants were scanned and for which scans were received by the BICR divided by the total number of participants in the trial.
• Average number of exams per time point: The total number of exams of all types (such as Chest Computerized Tomography (CT), Abdominal CT, or Pelvic CT) received divided by the total number of time points in the trial.
• Average number of target lesions: The total number of target lesions selected at baseline across all participants divided by the number of the total number of participants.
• Charter adjudication variables: Variables that are related to the study endpoints and determine whether adjudication is required during the BICR. For each trial, data was analyzed and subset analyses were conducted to determine the number and type of adjudication variables employed. The adjudication variables used were one or a combination of the following Date of Progression, Best Overall Response, Date of First Response, Best Unconfirmed Response, Best Time Point Response, and Difference in Time Point Response or Subject Level Progression Status.
• Response Criteria: The criteria used for determining tumor response.
Statistical methods
Proportions were estimated for key variables of interest and are presented with 95% confidence intervals estimated using a normal approximation. Patients who contributed exams only at baseline were excluded from the presented analysis; however, we repeated all analyses including these patients and found no substantive differences from the presented results. To evaluate whether there was a statistically significant association between each variable of interest and the proportion of patients requiring adjudication, we fit generalized linear models (GLM) using weighted least squares where the weights reflect the number of patients on each trial and specified a quasibinomial family to account for observed overdispersion. An F test was used to formally test associations. The effect of the average number of target lesions was explored in a piecewise linear model using a threshold of 2, such that the model only regressed the proportion of patients requiring adjudication on the average number of target lesions per trial for trials where there was at least an average of 2 target lesions. The model evaluating the average number of time points included a quadratic term. We estimated the turning point for the average number of time points from this model by taking the local extremum estimated as - b1/(2b2) where b1 is the coefficient estimate for the linear term and b2 is the coefficient estimate for the quadratic term. Multivariable models were built by including all variables significant at the p<0.05 level. There was one trial missing data on the average number of time points, exams per time point, and target lesions; this trial is excluded from analyses involving these variables. Analyses were performed in Stata/SE 12.1 for Windows (College Station, Tx), and in R.
There were 23,596 patients in the 79 oncology clinical trials contributing to this analysis. The median number of patients per trial was 198 (range 20-1,218). As shown in Table 1, while there are a significant number of trials studying therapies for breast cancer, lung cancer and lymphoma, there are also a wide range of indications represented in the data. Most trials used either RECIST 1.0 or RECIST 1.1 [5,6] to evaluate tumor changes, but several other response criteria are included.
| Number of Trials | Number of Patients | Adjudicated | |||
|---|---|---|---|---|---|
| Number of Patients | Proportion | 95% CI | |||
| Total | 79 | 23,476 | 9,744 | 42% | (41%, 42%) |
| Indication | |||||
| Adrenal | 1 | 38 | 19 | 50% | (34%, 66%) |
| Advanced cancer | 1 | 131 | 32 | 24% | (17%, 32%) |
| Basal cell | 2 | 222 | 153 | 69% | (63%, 75%) |
| Breast | 18 | 8497 | 3571 | 42% | (41%, 43%) |
| Colorectal | 7 | 3225 | 1342 | 42% | (40%, 43%) |
| Endometrial | 1 | 43 | 14 | 33% | (19%, 47%) |
| Glioblastoma | 3 | 607 | 258 | 43% | (39%, 46%) |
| Gastrointestinal stromal tumor | 2 | 311 | 119 | 38% | (33%, 44%) |
| Giant cell bone | 2 | 225 | 84 | 37% | (31%, 44%) |
| Head & Neck | 3 | 379 | 189 | 50% | (45%, 55%) |
| Kidney | 3 | 963 | 427 | 44% | (41%, 47%) |
| Lung | 11 | 2806 | 1077 | 38% | (37%, 40%) |
| Lymphoma | 13 | 1692 | 638 | 38% | (35%, 40%) |
| Melanoma | 3 | 526 | 211 | 40% | (36%, 44%) |
| Neuroendocrine tumor | 1 | 286 | 101 | 35% | (30%, 41%) |
| Ovarian | 3 | 1901 | 1051 | 55% | (53%, 58%) |
| Pancreatic | 1 | 154 | 58 | 38% | (30%, 45%) |
| Prostate | 1 | 748 | 215 | 29% | (26%, 32%) |
| Renal cell | 1 | 509 | 108 | 21% | (18%, 25%) |
| Sarcoma | 1 | 44 | 10 | 23% | (10%, 35%) |
| Thyroid | 1 | 169 | 67 | 40% | (32%, 47%) |
| Response Criteria | |||||
| Cheson 1999 | 4 | 303 | 152 | 50% | (45%, 56%) |
| Cheson 2007 | 6 | 667 | 217 | 33% | (29%, 36%) |
| Macdonald | 2 | 491 | 206 | 42% | (38%, 46%) |
| RANO | 1 | 116 | 52 | 45% | (36%, 54%) |
| RECIST 1.0 | 44 | 16384 | 6887 | 42% | (41%, 43%) |
| RECIST 1.1 | 18 | 4681 | 1894 | 40% | (39%, 42%) |
| Average number of time points | |||||
| Less than 4 | 26 | 5,444 | 1,678 | 31% | (30%, 32%) |
| 4-4.9 | 16 | 5,362 | 2,168 | 40% | (39%, 42%) |
| 5-5.9 | 20 | 7,693 | 3,478 | 45% | (44%, 46%) |
| 6-6.9 | 8 | 2,611 | 1,337 | 51% | (49%, 53%) |
| 7 or more | 8 | 1,713 | 798 | 46% | (44%, 49%) |
| Average number of target lesions | |||||
| 0 | 1 | 116 | 52 | 45% | (36%, 54%) |
| 1 | 7 | 1,459 | 504 | 35% | (32%, 37%) |
| 2 | 20 | 6,499 | 2,979 | 46% | (45%, 47%) |
| 3 | 31 | 11,367 | 4,598 | 40% | (40%, 41%) |
| 4 | 13 | 2,500 | 950 | 40% | (38%, 42%) |
| 5 | 6 | 882 | 331 | 38% | (34%, 41%) |
| Average number of exams per time point | |||||
| Less than 2 | 7 | 1,232 | 531 | 43% | (40%, 46%) |
| 2-2.9 | 18 | 6,072 | 2,414 | 40% | (39%, 41%) |
| 3-3.4 | 19 | 6,622 | 3,026 | 46% | (44%, 47%) |
| 3.5-3.9 | 20 | 6,139 | 2,296 | 37% | (36%, 39%) |
| 4 or more | 14 | 2,758 | 1,192 | 43% | (41%, 45%) |
| Number of charter adjudication variables | |||||
| 1 | 36 | 10,521 | 3,702 | 35% | (34%, 36%) |
| 2 | 21 | 6,405 | 2,766 | 43% | (42%, 45%) |
| 3 or more | 23 | 6,670 | 3,299 | 49% | (48%, 51%) |
| Charter adjudication variable | |||||
| Date of progression only | 26 | 9,130 | 3,173 | 35% | (34%, 36%) |
| Time to progression only | 5 | 690 | 329 | 48% | (44%, 51%) |
| Best response only | 5 | 701 | 200 | 28% | (25%, 32%) |
| Multiple variables | 43 | 12,995 | 6,042 | 44% | (46%, 48%) |
Table 1: Characteristics of Trials Contributing to the Analysis.
Seventy-eight percent (n=62) had an average of less than six timepoints at which scans were included in the BICR and most trials (81%) averaged fewer than four exams per time-point. The number of target lesions measured in a trial averaged between two and four for 82% of the trials.
There was one glioblastoma trial which used RANO read criteria and had an average of zero target lesions per patient. The median number of adjudication variables used in a trial was two (range 1-6). The date of progression was the most frequently used adjudication variable. It was the only adjudication variable in 26 trials, and was included as an adjudication variable in all but two of the trials that had more than one adjudication variable. Further details of the trials included in this analysis are presented in Table 1.
Table 1 and Figure 1 show the proportion of cases requiring adjudication by trial characteristic. The proportion of cases requiring adjudication across all trials was 42% (95% CI: 41-42%).
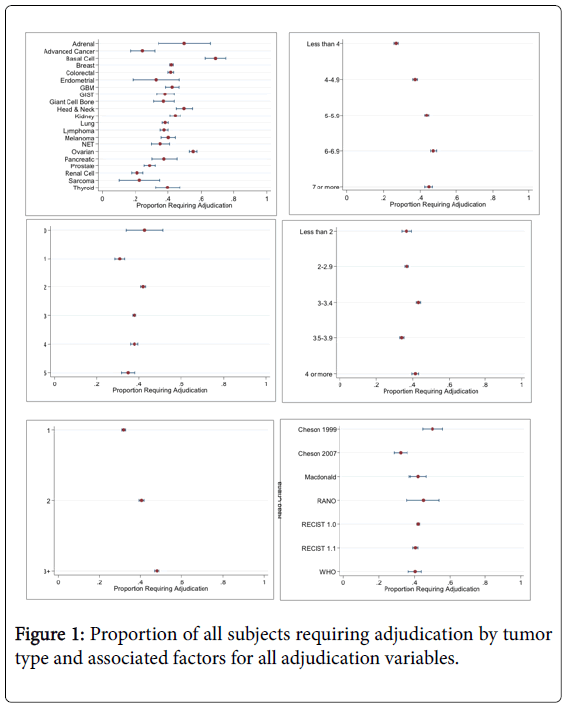
Figure 1: Proportion of all subjects requiring adjudication by tumor type and associated factors for all adjudication variables.
Depending on the indication, there was significant variation with the proportion of participants requiring adjudication ranging from 21% for a single trial of adrenal carcinoma to 55% for a group of 3 ovarian cancer trials (p=0.017, Tables 1 and 2). Of note, ovarian cancer and basal cell carcinoma trials had significantly higher AFs than breast trials (ovarian: OR=1.71, [95% CI=1.21, 2.42], p=0.004; basal cell: OR=3.06, [95% CI=1.17, 9.01], p=0.032).
| OR | 95% CI | |
|---|---|---|
| Breast | Ref | --- |
| Colorectal | 0.98 | (0.74, 1.31) |
| Glioblastoma | 1.02 | (0.57, 1.81) |
| Giant cell bone | 0.82 | (0.30, 2.08) |
| GIST | 0.85 | (0.36, 1.89) |
| Head & Neck | 1.37 | (0.67, 2.82) |
| Lung | 0.86 | (0.63, 1.16) |
| Lymphoma | 0.83 | (0.57, 1.21) |
| Melanoma | 0.92 | (0.49, 1.71) |
| Ovarian | 1.71 | (1.21, 2.42) |
| Renal/Kidney | 0.79 | (0.53, 1.17) |
| Basal cell | 3.06 | (1.17, 9.01) |
| Other | 0.65 | (0.43, 0.96) |
| p-value=0.017 | ||
Table 2: Association of the Proportion of Trial Participants Requiring Adjudication by Tumor Type.
Table 3 shows the association of factors with the proportion of trial participants requiring adjudication. There is a wide range of AFs across indications. There is a significant tendency for the AF to increase as the number of adjudication variables increases (p<0.001, Table 3).
| Univariate | Multivariate | |||||
|---|---|---|---|---|---|---|
| Factor | OR | 95% CI | p-value | OR | 95% CI | p-value |
| Overall | ||||||
| Average of time points | ||||||
| Linear term | 2.02 | (1.50, 2.75) | 0.001 | 1.50 | (1.09, 2.09) | |
| Quadratic term | 0.95 | (0.93, 0.98) | 0.98 | (0.95, 1.01) | ||
| Average of exams per time | 1.00 | (0.88, 1.14) | 0.989 | |||
| Averageof target lesions, lesions ≥ 2 | 0.79 | (0.88, 1.14) | 0.020 | 0.80 | (1.52, 2.13) | |
| Number of charter adjudication variables | ||||||
| 1 | Ref | --- | Ref | --- | ||
| 2 | 1.43 | (1.16, 1.76) | <0.001 | 1.61 | (1.32, 1.97) | |
| 3+ | 1.80 | (1.48, 2.20) | 1.80 | (1.52, 2.13) | ||
| Adjudicated only on date of progression | ||||||
| Average of time points | ||||||
| Linear term | 1.92 | (1.46, 2.52) | 0.001 | 1.92 | (1.46, 2.52) | 0.001 |
| Quadratic term | 0.96 | (0.94, 0.98) | 0.96 | (0.94, 0.98 ) | ||
| Average of exams per time | 1.00 | (0.82, 1.23) | 0.981 | |||
| Average of target lesions, lesions ≥ 2 | 0.97 | (0.72, 1.29) | 0.826 | |||
Table 3: Association of factors with proportion of trial participants requiring adjudication.
lesions per patient, the AF decreases as the number of target lesions increases (p=0.020). The data suggests a pattern whereby the AF increases as the number of assessment time points for a subject increase up until approximately 7 time points and then decreases (p=0.001). In contrast, aside from the International Working Group Response Criteria [7] which are specific to lymphoma trials, the AFs are very similar across the different response criteria (p-value=0.747).
We explored whether these same trends existed in trials where the date of progression was the only adjudication variable used (Table 2 and Figure 2). The results in Figure 1 and Figure 2 demonstrate similar tendencies, however the average number of target lesions was no longer statistically significantly associated with discordance between readers (p=0.826). Among the eight trials that used RECIST 1.1 and had the date of progression as the only adjudication variable, the radiologists disagreed 37% of the time (95% CI: 35%-39%).
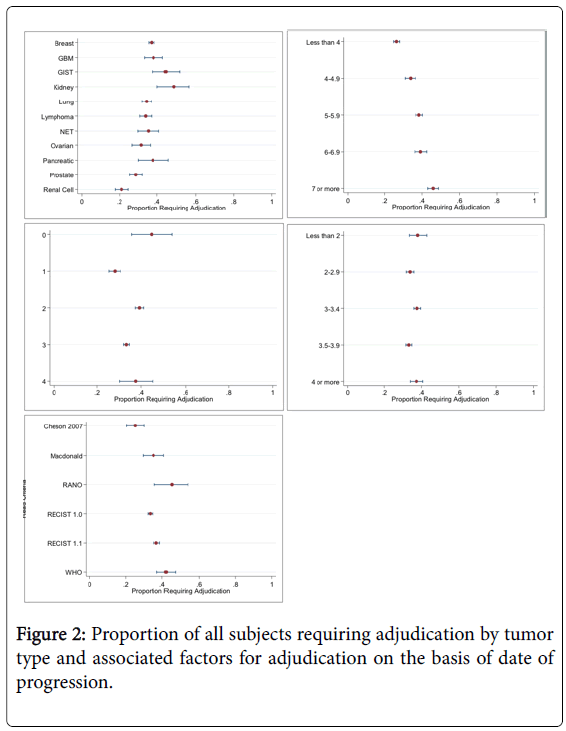
Figure 2: Proportion of all subjects requiring adjudication by tumor type and associated factors for adjudication on the basis of date of progression.
Monitoring reader performance in the setting of a BICR has been addressed in prior FDA Guidance Documents [8,9]. Discordance between BICR reviewers has raised concern among sponsor companies and regulators. An example is the discussion on this point in the FDA Briefing Document for the Oncology Drugs Advisory Committee Meeting on New Drug Application (NDA) 21801 Orplatna® [10]. This topic has also been discussed in public forums and is a major initiative of the Pharma Imaging Network for Therapeutics and Diagnostics. Some have implied that the rate of discordance between reviewers is inversely correlated with the quality of the review, however, the reasons for discordance are poorly understood and there are few published metrics related to BICR discordance rates.
To put the rate of discordance in outcome between 2 independent radiologist reviewers into prospective in the clinical trials arena, one needs to look at other examples where independent reviews performed under similar conditions (same dataset and same process) may differ in outcome. A literature search was conducted using Pubmed and Google Scholar. Keywords and phrases included “interobserver variability,” “clinical trial,” and “radiology”. The results were refined to primarily include the years 1995-2015, pertain to the clinical domains in question, and emphasize high impact journals or frequent citations. Therefore, 46 of the most relevant papers were included in the final summary review. Interobserver variability, as measured by outcome agreement, kappa statistic, and interclass correlation coefficient ranged from fair to excellent, depending on a number of factors including complexity of the object/process being measured, [11] lesion morphology [12], number of measurement dimensions, [13] imaging modality [14] and technical factors (such as slice thickness) [15]. Additionally, observer setting (community vs . academic) [16] and experience level [17] contributed to interobserver variability. Variability was noted to improve with quantitative vs. qualitative measurements [18] and increased training [19].
Within radiology, there was fair agreement in 2D measurement of high grade gliomas [20] fair agreement in 2D measurement of high grade gliomas[21] and CT findings following subarachnoid haemorrhage [18]. There was moderate agreement between observers for the classification of Acute Respiratory Distress Syndrome on chest radiographs, [22] Magnetic Resonance Imaging staging of cervical cancer, [14] Response Evaluation Criteria in Solid Tumors (RECIST) vs. World Health Organization (WHO) criteria for tumor response [23] and classification of glioma response to chemotherapy using the MacDonald Criteria, [24] as well as moderate to substantial agreement in measurements of nodule size on Chest CT [15]. Substantial interobserver agreement was noted in semiautomated measurement of pulmonary nodules, [25] 3-Dimensional (3D) CT measurements of abdominopelvic metastases, [12] CT quantification of aortic calcification, [26] the BI-RADS US lexicon, [27] change in glioma size following chemotherapy, [21] and grading of carotid stenosis on contrast enhanced MRA exams [28]. One study deconstructed the contributing factors to interobserver variability in volumetric CT measurement of laryngeal tumors, and noted that radiologist interpretation was the largest contributing factor (89.3%) [29].
With regard to pathology, there was fair to moderate observer agreement between first and second opinions after brain or spinal cord biopsy [30]. Otherwise, agreement was generally substantial in the final pathologic diagnosis of lymphoma, [31] final pathologic diagnosis of glioma, [11,16] histologic classification of gliomas, [32] histologic grade of endometrial carcinoma according to the FIGO criteria, [33] and diagnosis of non-small cell versus small cell lung cancer [34].
Agreement in clinical observation studies ranged widely, with fair agreement in Apgar scores at birth, [35] endoscopic diagnosis of crypt dysplasia in Barrett’s esophagus, [36] and assessment of ventilator associated pneumonia by infection control personal [37]. There was, however, substantial agreement among clinical observers with respect to site and central classification of myocardial infarction in the PURSUIT and PARAGON-B trials [38,39].
Among the subset of clinical trials, examples of fair observer agreement included cervical cytology and histology during the ASCUS-LSIL trial, [40] quality control review for colposcopy during the ATLS trial, [41] histologic features of pediatric brain neoplasms during the CCG-945 study, [42] and clinical observation of ulcerative colitis according the UCDAI criteria [43]. There was also substantial agreement in the histologic interpretation following radical prostatectomy during the TAX 3501 trial [44].
In 2009 in an attempt to further understand this specific issue, we performed a review of 31 oncology clinical trials across 10 different indications involving 8,752 subjects. We determined that R1 and R2 agreed on the best radiographic response in 77% of the cases reviewed and on the date of radiographic progression in 76% of the cases reviewed (unpublished RadPharm data) [45]. Furthermore, we performed and reported [46] statistical modeling studies that indicated the agreement rates between R1 and R2 for best radiographic response and the date of radiographic progression have specific dependencies that include factors such as (but not limited to) therapeutic indication, average number of target lesions identified at baseline, average number of time points per subject, and the types of imaging exams required in the protocol. There are additional dependencies including lesion selection, inter-reader measurement variability, drug efficacy, duration of treatment, perception differences between reviewers, missing scans, missing clinical data (if included as part of the review), and image quality issues. This work motivated our current effort involving a larger database of 23,476 subjects in an effort to further understand, clarify and define this issue.
Our review confirms that in a multivariable model, the number of adjudication variables, the number of target lesions, and the number of time points were all significantly associated with the AF. These dependencies are outside of the quality of the review and more inherent in the specifics of the trial. Interestingly, the response criteria used do not seem to correlate with the AF. It seems intuitive that drug efficacy may be a dependency not yet studied as more efficacious drugs particularly cytostatic agents prolong the progression free interval, hence resulting in more time points for evaluation, therefore a higher AF. However, this has not been directly studied. Image quality could also be a theoretical dependency. Poor quality images produced by the site can lead to more inherent reviewer disagreement as does changes in imaging technique (contrast dose or type, imaging study –CT or MRI) between time points as the subjectivity of the response assessment may vary. Additional dependencies for consideration could be the number of readers, the number of time points read per session or the presence of expedited time lines. However, these would need to be formally tested.
Notwithstanding the results, it also seems intuitive that a component of the AF could be related to differences between reviewers, including experience, training, understanding of the application of the response criteria, and prior experience in clinical trial reviews. Additionally, the extent and detail of the quality process being followed by the Imaging Core Lab can also be a dependency as more detailed quality assurance processes and derivation algorithms with real time edit checks will eliminate response outcome errors.
Prospectively, an expected AF can be modeled from this data with setting of prediction intervals based on the specifics of the trial as indicated in Table 4.
| Warning Limits | Observed % Adjudicated | Sample Size of Future Study | ||||
|---|---|---|---|---|---|---|
| Indication | N=25 | N=50 | N=100 | N=200 | N=500 | |
| Adrenal | 0.5 | 0.7 | 0.64 | 0.6 | 0.57 | 0.54 |
| Advanced Cancer | 0.24 | 0.42 | 0.37 | 0.33 | 0.31 | 0.28 |
| Basal Cell | 0.69 | 0.87 | 0.82 | 0.78 | 0.75 | 0.73 |
| Brain | 0.29 | 0.47 | 0.41 | 0.38 | 0.35 | 0.33 |
| Breast | 0.42 | 0.62 | 0.56 | 0.52 | 0.49 | 0.47 |
| CNS | 0.51 | 0.71 | 0.65 | 0.61 | 0.58 | 0.55 |
| Colorectal | 0.42 | 0.61 | 0.56 | 0.51 | 0.49 | 0.46 |
| Endometrial | 0.33 | 0.51 | 0.46 | 0.42 | 0.39 | 0.37 |
| GBM | 0.38 | 0.57 | 0.52 | 0.48 | 0.45 | 0.42 |
| GIST | 0.38 | 0.58 | 0.52 | 0.48 | 0.45 | 0.43 |
| Giant Cell Bone | 0.37 | 0.57 | 0.51 | 0.47 | 0.44 | 0.42 |
| Head & Neck | 0.5 | 0.7 | 0.64 | 0.6 | 0.57 | 0.54 |
| Kidney | 0.44 | 0.64 | 0.58 | 0.54 | 0.51 | 0.49 |
| Lung | 0.38 | 0.58 | 0.52 | 0.48 | 0.45 | 0.43 |
| Lymphoma | 0.36 | 0.56 | 0.5 | 0.46 | 0.43 | 0.41 |
| Melanoma | 0.4 | 0.6 | 0.54 | 0.5 | 0.47 | 0.44 |
| NET | 0.35 | 0.54 | 0.49 | 0.45 | 0.42 | 0.4 |
| Ovarian | 0.55 | 0.75 | 0.69 | 0.65 | 0.62 | 0.6 |
| Pancreatic | 0.38 | 0.57 | 0.51 | 0.47 | 0.45 | 0.42 |
| Prostate | 0.29 | 0.47 | 0.42 | 0.38 | 0.35 | 0.33 |
| Renal Cell | 0.21 | 0.38 | 0.33 | 0.29 | 0.27 | 0.25 |
| Sarcoma | 0.23 | 0.39 | 0.35 | 0.31 | 0.25 | 0.26 |
| Thyroid | 0.4 | 0.59 | 0.53 | 0.49 | 0.47 | 0.44 |
Table 4: Modeling of Predicted Warning Limits for Adjudication Rate by Indication and Study Sample Size.
In conclusion, this larger dataset confirms the initial hypothesis that the AF has dependencies that are in part inherent to trial characteristics and is not entirely dependent on the quality of the BICR review. Modeling, based on compiled data can be used to predict a threshold that may be important for monitoring review performance along with other previously reported metrics [45].
Special thanks to Robert W. Ford, MD for performing the literature analysis. There was no specific funding for this project.