Journal of Clinical Trials
Open Access
ISSN: 2167-0870
ISSN: 2167-0870
Research Article - (2013) Volume 3, Issue 5
Purpose: To model the effect of accuracy and precision on hazard ratios, sample size and overall trial cost in Progression-Free Survival (PFS) trials using different Blinded Independent Review (BICR) paradigms.
Method: PFS times were simulated based on a tumor growth model using a median 180 days in the treatment arm; the control arm varied according to Hazard Ratios (HR) from 0.7-0.85. False positives were added for varying accuracy (1-False positive rate) and a log normal distribution of measurement error was used for varying precision. Local Evaluation (LE) accuracy of 70% and measurement error’s standard deviation of 0.30 were compared to different BICR paradigms with varying accuracy and precision (i.e., accuracy =70,90% & precision .30,.25,.20).
Results: Compared to LE, all BICR paradigms decreased overall trial costs by $ 0.0037 - 26.6.3×106 and sample sizes by 12-435 with effect magnitude being greatest at higher HRs, higher accuracy and lower measurement error.
Conclusion: Our study indicates that for trials with PFS based on a radiological assessment, BICR can be a cost-effective strategy by decreasing sample sizes and trial costs. More importantly, the study provides a quantitative indication of how changing accuracy and precision can alter sample size projections and trial cost.
Keywords: Accuracy, Precision, Blinded independent central reviews, Progression-free survival, Cancer, Biostatistics, Cost effective, Local evaluation
In oncology clinical trials, the primary endpoint of the registration studies are often Progression Free Survival (PFS) [1], which is by nature a subjective assessment as compared to the more definitive and objective assessment of overall survival [2].
Regulatory agencies suggest that registration trials with subjective endpoints such as imaging could benefit from a Blinded Independent Central Review (BICR) of the clinical data [3-6]. The BICR is a mechanism to eliminate bias in open labeled trials and to potentially increase accuracy and precision over site evaluation by providing better control of the review process. Process control is a major concern when dealing with a subjective and often complex assessment of imaging data, which are often the deterministic factors in PFS studies.
A major advantage of a BICR is its ability to perform multiple independent reads of the same data by central reviewers who are usually more experienced and consistent, as compared to the site assessment, which is usually read once and often performed by multiple readers at multiple centers. The multi-reader BICR process increases the precision of the estimate [7]. In addition, the BICR should result in a decrease in inter-reader variability and may increase the accuracy of the assessment correspondingly.
Multiple meta-analysis of imaging data from PFS studies showed strong correlation between site reviews and BICR [6,8-12]. However, the type of BICR performed and the similarities between data collected at the site and by the independent reviews have not been clearly articulated.
Another outstanding issue resulting from these analyses was the incremental value of the BICR in light of additional cost. We have modified the tumor growth model introduced by Stone et al. [10] and expanded upon by Hong et al. [13] to model the effect of different precisions, accuracies and reading paradigms on sample size estimates and trial costs.
True PFS times were simulated for both control and treatment arms using an exponential distribution with a median of 180 days for the treatment arm, while the median for the control arm varies according to the specified hazard ratios. Sample sizes were calculated via the logrank test using PASS 2011 software [14,15], with the power 0.80 and the two-sided type I error 0.05.
In the model we assumed no dropouts and all subjects began the study together. The followed-up duration was three years and PFS is the primary endpoint. Images were taken at baseline and every 45 days afterwards for a period of approximately three years.
Tumor size was defined as the sum of longest tumor diameters. The tumor size at baseline (LDi0) was assumed to follow a log-normal distribution with mean 4 cm and standard deviation 1.9 cm [10].
1. For the ith subject at the jth visit, the tumor size (LDij) was defined as LDij = (LDi0)*(exp(-btj) + (baitj), where b was a constant with the value 0.4 and tj was the time in months of the jth visit. ai was a patient-specific parameter that was calculated such that the ith patient would progress at the desired visit (i.e., Jth visit) in the simulations. Progression would be defined as at least 20% increase of tumor size from nadir. The calculation of ai was done through the Newton-Raphson method.
2. Patients not progressing by 36 months would be censored at that visit.
Measurement error was incorporated into the model to measure a reader’s precision of lesion measurements. “False positives”, normal tissue seen by the reader as a tumor at baseline and staying constant over time, were incorporated to measure “accuracy,” defined as 1-False Positive Rate (FPR). It was estimated that readers would see false positives (25% of patients baseline tumor burden) in roughly 30 percent of patients. A FPR of 10% was also added to demonstrate the effect of a training testing program combined with clinical experience. The precision component involves introducing log-normally distributed measurement error at each time point, with mean Eij and standard deviation σ. For the purposes of this simulation, the value of σ will increase from 0.05 to 0.50 in increments of 0.05. Thus, the reader’s measurement for the ith patient at the jth timepoint can be defined as:
Mij = exp(LDij + N(Ei, σ))
LDij represents the “true” sum of the longest diameters, and Ei is equal to either .25*LDi0 or 0, depending on whether a false positive was seen. Once the measurements are calculated, the reader’s timeto- progression is determined at the point where the increase of Mij was equal or greater than 20 percent above nadir. Hazard ratios were calculated and averaged over 1000 simulations, for each value of σ.
Table 1 illustrates the four read algorithms that were compared in this study. The impact of adding more imaging timepoints for review beyond where the site reader called progression was also explored. In these instances, a site read was simulated, and then followed with a BICR read where only timepoints “read” by the site reader were available to the BICR.
| Paradigms | Accuracy and Precision | Details |
|---|---|---|
| Single Read | 30% False positives, SD = 0.30 | LE (local evaluation) determined by site evaluator(s). |
| Blinded, Independent, Central Read (BICR) – Base Case | 30% False positives, SD = 0.30 for all readers | Blinded central readers with an un-blinded adjudicator for discrepancy judgment. |
| BICR – Better Precision | 30% False positives, SD = 0.25 Blinded Readers, 0.15 Adjudicator | Same as BICR base case except readers are trained and have better precision than LE with best precision for un-blinded adjudicator. |
| BICR – Better Precision and Accuracy, called “BICR Best” | 10% False positives, SD = 0.25 Blinded Readers, 0.15 Adjudicator | BICR team made up of expert central readers who posses increased accuracy and precision. |
Table 1: Assumptions for different reading paradigms.
Costs for performing a BICR were estimated based on pricing models developed by WorldCare Clinical, which are consistent with actual pricing for PFS trials using RECIST 1.1 criteria. Per patient costs for enrollment were estimated based upon projections proposed for Phase 3b oncology trials [16].
The following assumptions were made:
1. Per patient cost is $65,900
2. Quality control process for imaging data is the same regardless of the type of imaging review being performed (i.e., LE vs. BICR ). Below is a list of those procedures.
a. Image acquisition guidelines, imaging charter and all applicable manuals
b. Imaging quality control
c. Imaging data anonymization
d. Maintaining a Picture Archiving and Communication systems (PAC system) for imaging archiving and display
3. The image evaluation costs an incremental $110/visit and consists of a chest, abdomen and pelvis CT read using RECIST 1.1.
4. BICR costs were calculated using the following formula:
Cost = $110*(Sample Size*#Readers*Visits/Patient)
Where Visits/Patient was dependent on true HR and ranged from 5.2-5.5, and # Readers was fixed at 2.3, assuming 2 blinded readers and a 30% rate of adjudication.
Figure 1 demonstrates how increased measurement error can inflate the hazard ratio towards non-significance and therefore attenuate the treatment affect. Note that, although the “true” Hazard Ratio in this example is 0.75, because patients are only observed every 45 days, only a rough estimate of the true time to progression can be obtained. As a result, the “visit-based” Hazard Ratio is 0.76.
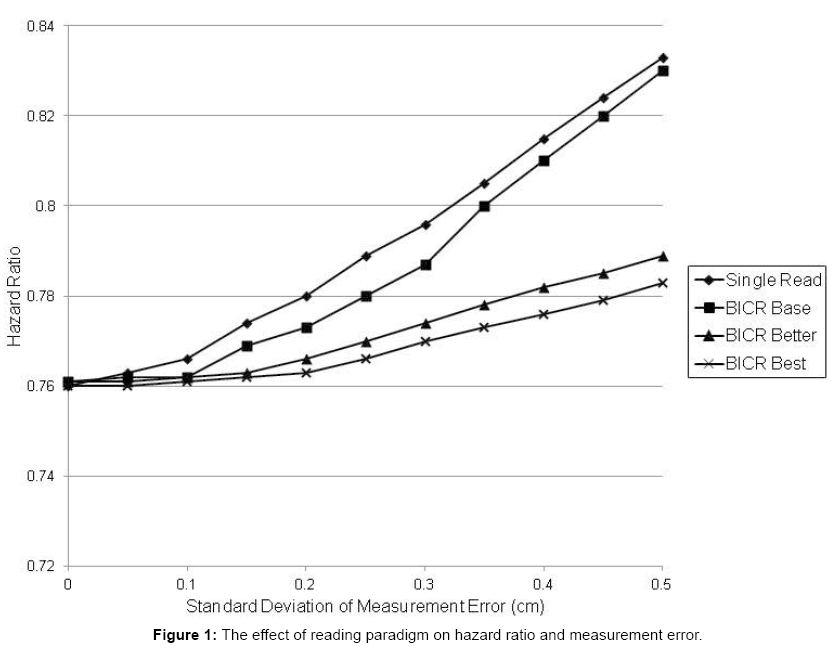
Figure 1: The effect of reading paradigm on hazard ratio and measurement error.
The LE and, to a lesser extent, BICR Base Case with measurement error of greater than 40 percent will result in HR, which are of borderline clinical significance particularly in trials in which PFS in control arm is less than 6 months (i.e., approximately 1 month difference between treatment arms). Improved precision of Better Case and Best Case (BICR) results in much less attenuation of treatment effect even with large increases in measurement error.
Figure 2 shows that, as variability increases, the discrepancy between BICR recorded events and site events will increase (informative censored events). This effect can be successfully mediated (less than 10 percent discrepancy in recorded events) with up to a variability of 25% SD by the addition of up to 2 extra imaging session after the site concludes that the patient has progressed. Without additional scans even small variability will result in > 10 percent of the patients being censored.
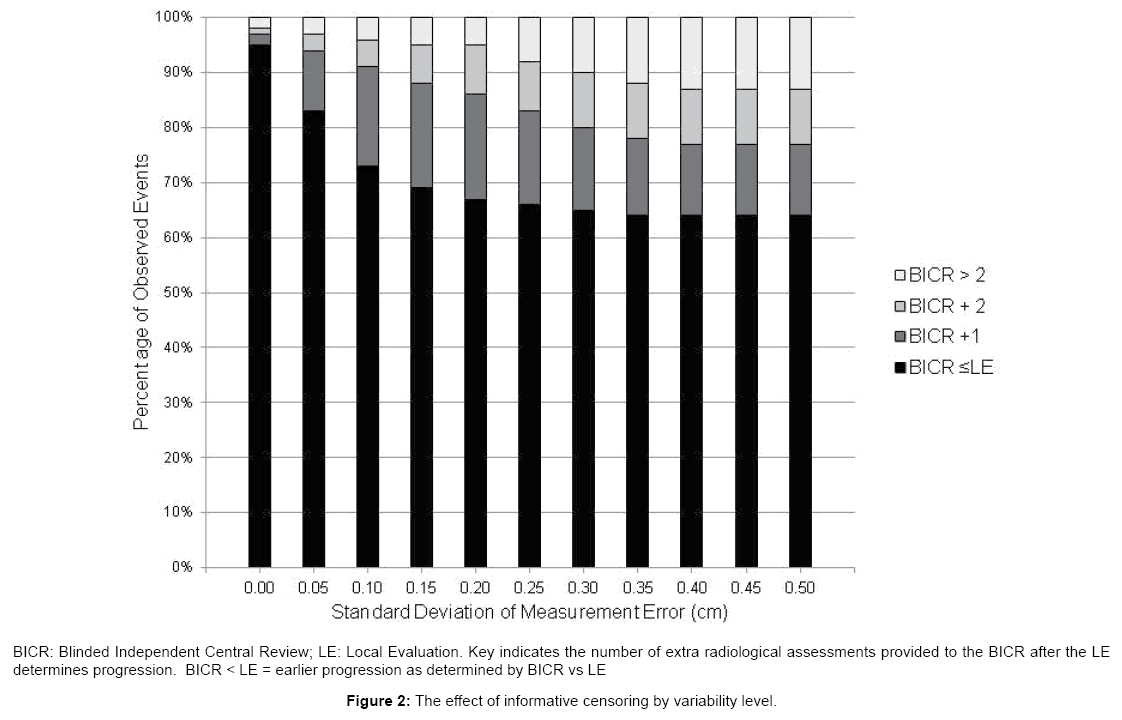
Figure 2: The effect of informative censoring by variability level.
In order to quantify the potential benefit of improving accuracy and precision through the use of a BICR, power calculations were performed utilizing the assumptions from Table 1. Table 2 shows that the increased precision obtained by performing a multi-reader assessment (BICR-Base Case) as compared to the LE will result in a decrease in sample size of 64 patients at a HR of 0.85. Assuming that the precision and accuracy of the BICR Independent Reviewers (IRs) are superior to the LE, large decreases in estimated sample size can be realized. In this model, the decrease in sample size is mostly driven by the increase in precision (30 to 25 percent for primary reviewers and 15 percent for adjudicators) of the independent reviewers rather than their increase in accuracy (30 percent to 10 percent false lesions).
| Total Sample Size | |||||||
|---|---|---|---|---|---|---|---|
| True Hazard Ratio | LEa | BICRb | |||||
| Base Case | Better Precision | Best Case Accuracy and Precision | |||||
| N | N | % Decr. | N | % Decr. | N | % Decr. | |
| 0.70 | 407 | 393 | 3.4 | 328 | 19.4 | 310 | 23.8 |
| 0.750 | 599 | 587 | 2.0 | 495 | 17.4 | 463 | 22.7 |
| 0.800 | 1011 | 985 | 2.6 | 838 | 17.1 | 790 | 21.9 |
| 0.850 | 1912 | 1848 | 3.3 | 1571 | 17.8 | 1477 | 22.8 |
Table 2: The effect of different reading paradigms on sample size estimations.
Table 3 shows that for most simulations where the hazard ratios are between 0.70 and 0.85 the potential exists for significant cost savings regardless of the BICR paradigm. The estimated cost savings become large when HR is ≥ 0.8 or greater under BICR better and BICR Best reading paradigms.
| True HR | Design | Sample Size | Trial Cost ($1000) | BICR Cost ($1000) | Trial and BICR Cost ($1000) | Trial Cost Saving vs LE |
|---|---|---|---|---|---|---|
| 0.70 | LE1 | 407 | 26821.3 | 0.0 | 26821.3 | |
| BICR2 base | 393 | 25898.7 | 517.0 | 26415.7 | 405.6 | |
| BICR better | 328 | 21615.2 | 431.5 | 22046.7 | 4774.6 | |
| BICR best | 310 | 20429.0 | 407.8 | 20836.8 | 5984.5 | |
| 0.75 | LE | 599 | 39474.1 | 0.0 | 39474.1 | |
| BICR Base | 587 | 38683.3 | 787.1 | 39470.4 | 3.7 | |
| BICR Better | 495 | 32620.5 | 663.7 | 33284.2 | 6189.9 | |
| BICR Best | 463 | 30511.7 | 620.8 | 31132.5 | 8341.6 | |
| 0.80 | LE | 1011 | 66624.9 | 0.0 | 66624.9 | |
| BICR Base | 985 | 64911.5 | 1345.7 | 66257.2 | 367.7 | |
| BICR Better | 838 | 55224.2 | 1144.9 | 56369.1 | 10255.8 | |
| BICR Best | 790 | 52061.0 | 1079.3 | 53140.3 | 13484.6 | |
| 0.85 | LE | 1912 | 126000.8 | 0.0 | 126000.8 | |
| BICR Base | 1848 | 121783.2 | 2571.5 | 124354.7 | 1646.1 | |
| BICR Better | 1571 | 103528.9 | 2186.0 | 105714.9 | 20285.9 | |
| BICR Best | 1477 | 97334.3 | 2055.2 | 99389.5 | 26611.3 |
Table 3: The effect of different reading paradigms on estimated trial costs.
The results of these simulation studies demonstrate that a multireader BICR can be a cost- effective tool when radiological assessment is the determinate of PFS. The magnitude of this effect is dependent on multiple factors, primarily: 1) The number of assessment timepoints, which dictates the temporal resolution of the measurement; 2) The magnitude of the treatment effect (HR expected); 3) The precision and accuracy assumptions for determining tumor progression.
The simulation studies focused on demonstrating the cost effectiveness of performing a BICR. No attempt was made to estimate cost savings associated with smaller sample sizes, which should drive shorter trial durations/less clinical trial sites. The double read with adjudication paradigm used in these simulations are similar to the BICR design used in registration trials [17]. Since these trials are usually rate limiting for filing NDA/MAA, the sample size reduction attributed to a BICR could result in a significant decrease in trial in-life phase as compared to sample size estimated from LE. Regulatory agencies also view a BICR process as “critical” to controlling bias in open labeled trials [17] and has commented on concerns of un-blinding in double blinded trials due to different treatment arm toxicity [3,6]. The FDA goes further in a recent guidance document by stating that the BICR process helps ensure that imaging interpretation “is accurate and that bias and variability are minimized” [5]. At the same time regulatory agencies are evaluating the potential for bias in PFS studies to be introduced by BICR process due to informative censoring [3,18,19]. The censoring could result in an underestimation of the treatment effect due to a greater dropout rate in the control arm, presumably due to site determined progression as compared to the treatment arm. As suggested by Dodd (13) and the results of Figure 2, censoring can be mitigated by performing one or two extra imaging visit(s), thus increasing the probability that the BICR reviewers will demonstrate progression. Modeling the effects of differential informative censoring is very complex and were not explored [20]. The trial cost estimates in this simulation model focused on the HR and precision and accuracy assumptions since these parameters are known to be variable and can be directly modeled. The model is intended to separate out the effect of a BICR on increasing accuracy from its effect of decreasing variability. The term accuracy is being used, rather than bias, to define the ability of imaging to over or underestimate the treatment effect on PFS.
In this study we made a conservative assumption that the interreader variability between sites is no greater than the variability between central readers (BICR base case), which is usually not the case. If taking this fact into account, we expect BICR can further decrease the sample size and reduce the trial cost compared to LE. When precision and accuracy are increased the effect on sample size becomes substantial and the observed HR becomes more stable over a wider range of measurement errors. A major component of these model assumptions is the improved performance of the BICR attributable to the adjudicator. This effect can be maximized when the adjudicator makes the assessment after reviewing the results of the other two reviewers and has the flexibility to select a response that is the same or different than either of the primary reviewers.
The model estimates for variability (standard deviation of error) of lesion measurements between readers are similar to Stone et al. [10] regarding range of variability (0.08 - 0.23 for Stone et al., compared to 0.05 - 0.5). In contrast to Stone et al. [10] an accuracy component and multiple smaller HR (0.70 - 0.85 compared to 0.5) were added. This was an important consideration since larger HR would dictate smaller trials and diminish the impact of failing to identify a small, but presumably clinically relevant change in HR. An obvious implication of decreasing tumor measurement variability is the ability to decrease type II error rate if sample size is keep constant [13]. This maybe a more conservative approach for most trial sponsors. Although the assumptions regarding the magnitude of the variability modeled is not known with great precision, a meta-analysis consisting of 40 solid tumor trials and 12,299 subjects provides some guidance [21]. In this analysis, a mean adjudication rate of 31 percent for inter-reader variability for response characterization was determined. Similar rates of discordance (between 24-29 percent) have been reported between LE and BICR. This degree of variability consists of both measurement error, estimated at 15 percent [22], and differences in lesion selection and evaluation bias. Evaluation bias refers to the joint probability that if two IRs are conditionally independent and that the nominal read accuracy is, for example, 90 percent, the adjudication rate would be 19 percent. The magnitude of the measurement error in this model takes into account all factors that account for discrepancy in reviews, including missed target lesions. To better understand measurement variability observed between local readers and between BICR readers and the BICR adjudicator, efforts are in process to obtain site data and independent BICR data for readers.
One limitation of the model is it does not account for new lesions seen, which would lead to an automatic call of progression according to RECIST 1.1 [23]. This is not a concern when lesion burden is quantitated using methodologies developed for immunotherapeutics such as irRC [24], since a new lesion does not result in automatic progression. Another element unaccounted for is the concept of a “batch read” where readers read all timepoints in a single session rather than in real-time. This adds precision and is far more likely to occur in a BICR than at a site. The measurement error would be correlated across timepoints, which is important in a trial where the endpoint is determined by change over time. At a site where reads are performed in real-time, and often by different readers, the measurement error would behave more randomly as it does in the model. While this approach may seem conservative, it underscores the strength of the BICR paradigm. Adjudication rates between readers in the BICR may be inflated at even lower variability levels, due to the fact that both readers’ errors were randomly scattered around the “truth” value and not correlated with each other.
In conclusion, these simulation studies indicate that for trials with a PFS endpoint, a BICR of imaging data can be a cost-effective strategy. The modeling parameter used to simulate the different imaging read environments represent summed (measurement error, inter-reader variability) estimates of variability, which is consistent with trial results. More importantly, the study provides a quantitative indication of how changing accuracy and precision can alter sample size projections and trial cost.
WorldCare Clinical, LLC, a CRO that provides imaging services, funded all work described in this paper. Dr. Duan receives consulting fees from WorldCare Clinical, LLC.
All work described in this paper was funded by WorldCare Clinical. The authors thank Patrick Chokron from WorldCare Clinical for help with design of the simulation model and G. Scott Gazelle, MD from Massachusetts General Hospital for review and comments on an early version of the manuscript.