Pancreatic Disorders & Therapy
Open Access
ISSN: 2165-7092
ISSN: 2165-7092
Research Article - (2015) Volume 0, Issue 0
The treatment of glucose metabolism disorders in critically ill or in diabetic patients remains sometimes arduous because the serum glucose concentration does not reflect in real time the tissues metabolic situation. We hypothesized that the difference Dt between core (Tc) and subcutaneous (Ts) temperatures of the body can reflect the tissues energy balance (which glucose metabolism ensures for 70%) and hence be used to monitor glucose metabolism. A device – ADD-CIT - was elaborated and patented. It includes a thin rectal catheter with two temperature captors at a distance of 4.5 cm, a temperature analyser, a computer which commands an insulin pump according to an algorithm linked with the recorded evolution of Dt values. The results of its first tests are presented here.
The device technical liability was tested in thermostat according to standard methods. The feasibility of temperature registration was verified in animal experiments on rats. From 1998 till 2012, the device was tested in13 healthy volunteers and 58 diabetic patients type 1 with a more than 24 hours lasting blood glucose level above 11.1 mM/l (200 mg/dl) in spite of usual insulin therapy, 19 from them undergoing only Dt investigation with traditional treatment continuation. Ethic Committee agreements were obtained. Range of glycaemia normalization delays after the observation beginning, per cent of failure (glycaemia remaining above the hyperglycaemia threshold), hypoglycaemia and “yo-yo” episodes were analysed.
Acceptable stability and reproducibility of the Dt measures were shown in thermostat, in animals and in healthy human volunteers. Compared with the traditional treatment, new feedback monitored insulin treatment has demonstrated: some acceleration of the glycaemia decrease during the first 3-4 hours, less treatment failures, yo-yo events, and deep hypoglycaemia episodes. In most cases, a 3-4 hour session significantly improved the patient condition.
These first results suggest the validity of the new feedback for insulin therapy control.
<Keywords: Glucose metabolism; Energetic balance; Hyperglycaemia; Hypoglycaemia; Insulin delivery control; Artificial pancreas
ADD-CIT: Apparatus for Diabetes Diagnosis – Complex Insulin Treatment; BW: Body Weight; DM: Diabetes Mellitus; DM 0: No Diabetes Known; DM 1: Diabetes Type I; DM 2 – Diabetes Type 2; Dt: Difference of temperatures between core and subcutaneous layer of the body; Mg/Dl: Milligram/Decilitre; Mm/L: Mini Moles Per Litre; Tc Or Ti: Core Or Internal Temperature; Ts: Superficial Temperature
Presently it is admitted that severe, acute glucose metabolism disorders frequently observed in Intensive Care Units patients, are signs of a bad prognosis and must be corrected [1-37]. However, the efficacy of a strong control of hyperglycaemia is controversial because of the increase of dangerous hypoglycaemic and yo-yo episodes risk [5-12]. A part of the mentioned difficulties are linked with the fact the glucose blood level does not reflect in real time the glucose utilization by central and peripheral tissues because glycaemia is determined by the balance between supplies (external – from food, and internal from neo glycogenesis) and utilization, both being under control of insulin and counter-insular regulation hormones [13,14].
In order to improve the glycaemia control, different kinds of “artificial pancreas” were created. Up to now, whatever insulin source (injection or even cell cultures) may be used, their principle has been based on an insulin delivery conditioned by a blood glucose monitoring [13-20]. The results have remained controversial.
Considering that the energetic needs of the organism are covered for 70% by glucose metabolism [21], the evaluation of the energetic balance of the body may appear as a direct testimony of the carbohydrate use. We hypothesized that measures of energetic consumption of the organism might be used to ensure glucose metabolism monitoring. With this aim, the body core temperature (Tc), reflecting thermogenesis, and the subcutaneous adipose layer temperature (Ts), reflecting balance between the body peripheral layers temperature and the external one, were measured. Their difference (Tc-Ts = Dt), reflecting the organism energetic expenditure/consumption, was calculated. *The variation of the obtained values (Dt) was used for programming the insulin delivery by a pump according to a determined algorithm. The concept was validated [22] and successfully tested in experiments, as well as in isolated clinical situations [23-31]. Further the use of ADD-CIT was required by USI clinicians to help them in the management of patients with threatening hyperglycaemia, persisting in spite of usual treatment.
The aims of the present work were to describe the device ADD-CIT (Apparatus for Diabetes Diagnosis – Complex Insulin Treatment), to analyse the first results of its in vitro and in vivo testing, as well as its use in USI patients with Diabetes type 1, in spite of their heterogeneity, in order to draw first conclusions about the possibilities, limits and perspectives of using the new feedback.
*In normal conditions Tc must be higher than Ts. If Tc decreases, Ts also decreases but not necessarily in the same proportions (possible role of ambient temperature and subcutaneous fat energy production as well as changes in energy utilization). A Dt decrease may be due either to Tc decrease or Ts increase. Inversely Dt increase may be due to Tc increase or Ts decrease. So it is supposed that a low Dt, especially a negative one, is due to thermogenesis failure and must be corrected either by insulin injection (that improves glucose utilization), or, in case of further Dt decrease, by glucose injection (to boost thermogenesis by reconstitution of glycogen reserves, for instance, after excessive insulin income).
The ADD-CIT device used in this work is described in Figure 1. It includes a rectal catheter, an analyser, a computer and an insulin pump (Figure 1a and b).
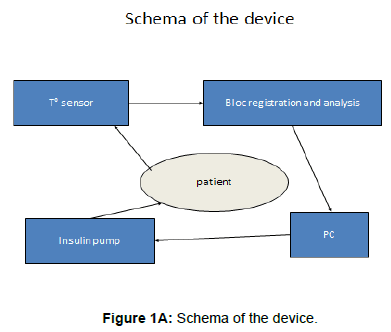
Figure 1a: Schema of the device.
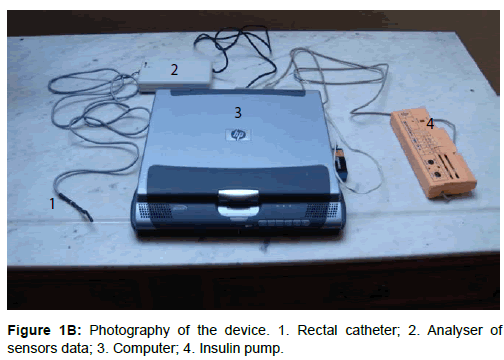
Figure 1B: Photography of the device. 1. Rectal catheter; 2. Analyser of sensors data; 3. Computer; 4. Insulin pump.
The rectal catheter, enclosed into a thin, hermetic, waterproof and one-using polyethylene membrane, is 4 mm in diameter, includes two temperature sensors at 4.5 cm from each other. The inner sensor at the top of the catheter is placed at the level of the deep haemorrhoidal venous plexus and registers the core temperature (Tc) reflecting thermogenesis. The lower sensor is then situated just above the external anal sphincter and reflects the superficial temperature (Ts) of the subcutaneous para-rectal fat (Figure 1c).
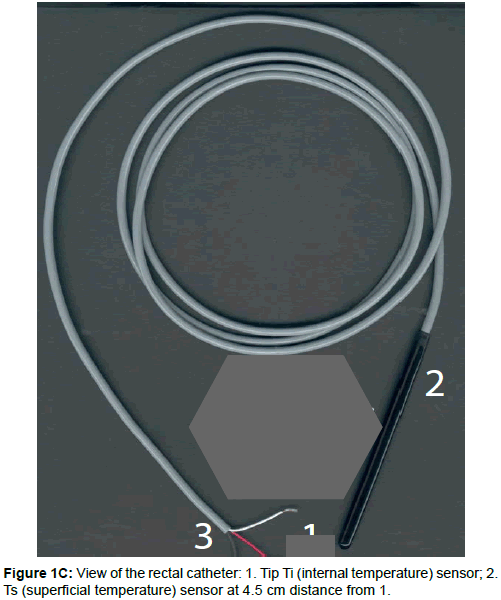
Figure 1C: View of the rectal catheter: 1. Tip Ti (internal temperature) sensor; 2. Ts (superficial temperature) sensor at 4.5 cm distance from 1.
The catheter is fixed in place thanks to an enlargement of the catheter external layer in form of an 8 mm diameter globe just above the Ts sensor. Better if the rectum is wide. Contraindication to the catheter placement and the use of ADD-CIT will be rectal ulcerations or haemorrhoid inflammation.
The sensors data are cabled to an analyser which calculates Dt, and the information is delivered to a computer. On the basis of the evolution of Dt an appropriate program was elaborated which allows the computer command an adapted in consequence impulse pump. Fast action Insulin – Aktrapid or Humulin -, diluted to 20 or 40 UI/ml, is delivered from a 1 ml syringe through a short (<20 cm) catheter to the patient venous access to avoid insulin adsorption and degradation (Figure 1d). Insulin delivery may be operator programmed (for instance, 30 impulses/min usually during 30 minutes at the session beginning while sensors adapt) or automatized according to Dt values evolution. 1 impulse of the pump represents from 0.00001 to 0.001 UI according to the insulin pre dilution. The program regulates the number of impulses/min. A visual control of the Dt, Tc and Ts ciphers, insulin delivery impulses is ensured through the computer (Figure 1e).
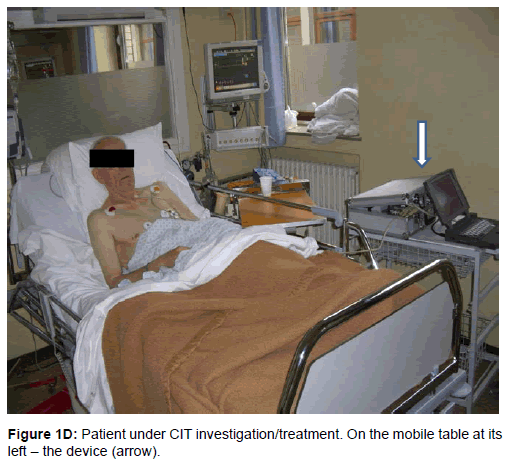
Figure 1D: Patient under CIT investigation/treatment. On the mobile table at its left – the device (arrow).
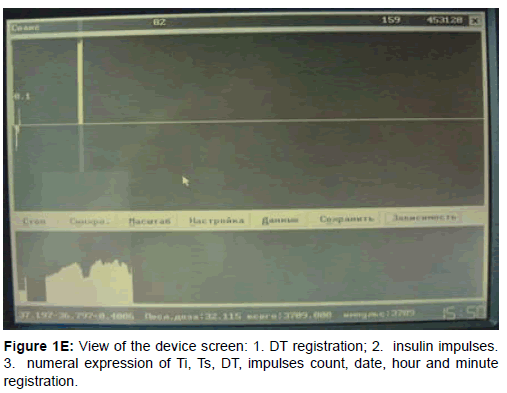
Figure 1E: View of the device screen: 1. DT registration; 2. insulin impulses. 3. numeral expression of Ti, Ts, DT, impulses count, date, hour and minute registration.
Technical tests
Technical tests were provided in laboratory with special standard thermostat equipment: special copper container plunged into another container with water maintained at homogenous temperature by a mixer device. Exposition of the catheter to the heath generated by a lamp situated at 40 cm of each sensor in a room with constant temperature and without air movement was also used. For isolated heating of one or other sensor, application of warm or cold cotton was used. The stability in measuring constant temperature, including during a long period of time, the capacity of simultaneous derivation of the 2 sensors during temperature changes, the reactivity of each sensor and Dt to local temperature modifications was tested.
In animals
In animals - 10 rats, males and females, body weight (BW) from 200 up to 300 g, in a room with constant temperature during the whole test period (according to the schedule either 18°C, or 24°C), Ts, Ti, Dt and glycaemia were recorded. The animals were anesthetized (gas induction, then intra peritoneal injection of Nembutal (0.045 mg/100 g BW). Catheter with temperature sensors was introduced into the rectum in the same way as in humans (Figure 3a). At the end of the session the animal underwent euthanasia by anaesthetics overdoses. Experimental protocol was approved by local Ethic Committee.
Clinical sessions
Clinical sessions were provided in a hospital (USI) room (CHU Brugmann, Brussels, Belgium; Sklifassovski Institute of Emergencies, Moscow, Russia) at temperature 2I +/- 1°C, under the permanent observation and responsibility of an intensive care physician after receiving the patient’s own informed consent or his family’s (see annexe). The responsible physician mildly introduced the catheter with the sensors into rectum at a depth of 6.5 cm (mark on the catheter) so that the sensors were placed correctly. An intravenous line was placed independent or connected with the patient injection system for intravenous insulin providing (Figure 1d). Usually patients did not receive any food except in the case when session duration exceeded 4 hours and the patient was conscious. In the last case standard hospital meal was delivered.
At the end of the session, rectal catheter was carefully taken out the organism and pump insulin delivering removed. When necessary, further insulin treatment was provided under endocrinologist supervision.
The session duration varied from 2 to 10 hours, depending on the clinical conditions (severity of the glucose disorder, rapidity of the patient’s condition improvement). The session might be interrupted in the case of emergency procedures, defecation or disagreeable anal feelings (the last was an exception). Criterion for ending a session were objective significant decrease of blood glucose level (< 11.1 mM/l) and/ or Dt >0.05°C with subjective improvement of the patient’s general condition.
In control USI patients the procedure was the same except the continuation of insulin delivery according to the standard schedule (i.e. without CIT activity of the pump).
In control healthy volunteers no insulin or glucose delivery was provided and the session duration was 4 hours.
71 persons have participated to this work (Table 1).
| Series | Number (patients) | Sex M/F |
Age (M±SD, Max, min) |
BW ( M±SD, Max, min) |
Height (M±SD, Max, min) |
|---|---|---|---|---|---|
| Control: healthy | 13 | 7/6 | 35.15±8.3 (23-50) | 62±11 (60-110) |
171.9±9.89 (160-185) |
| CD1 (glycaemia> 11.1mM/l) |
58 | ||||
| Observation & TIT | 19 | 7/12 | 35.8±14.4 (17-59) |
60.9±9.5 (42-78) |
165.2±9.6 (152-189) |
| CIT treatment | 39 | 12/27 | 31.5±14.2 (16 – 65) |
62.6±13.4 (42-112) |
166.4±7.8 (154 – 185) |
| Total patients | 71 | 26/45 |
Table 1: Cohort of involved persons in the present retrospective test study.
Inclusion criteria were:
• Age from 16 to 80 years
• Sex female and male
• Body weight from 40 to 115 kg, BMI from 20 to 35
• Request from endocrinologist and/or USI or reanimation physician in case of persistent hyperglycaemia above 11.1 mM/l (200 mg/dl) persistent in spite of usual insulin treatment during 24 hours and more, or necessity to rapidly improve a patient’s situation before or after surgical intervention.
• Pathology: diabetes type 1 patients without major systemic complications (Table 1).
Exclusion criteria were:
• Absence of patient consent,
• Age < 16 years
• Gravidity > 4 months
• Rectal inflammation or ulcerations
• Traditional insulin treatment before ADD starting:
Variant 1: (Harrison/ 32/ and as practiced in our hospitals)
(Variant Table 1)
In case of coma: 5 UI delivered directly intra venous; then 5 UI/h or 10 UI during the first hour and later according to the preceding schema (see higher)
Variant 2: when glycaemia > 150 mg/dl, insulin is delivered as calculated:
(Variant Table 2)
| Time (hour, minute, second) | Т internal | Т superficial | Dt |
|---|---|---|---|
| 16 53 23 00 | 36,8179 | 36,6710 | 0,1470 |
| 16 54 23 00 | 36,8134 | 36,6755 | 0,1380 |
| 16 55 23 00 | 36,8067 | 36,6687 | 0,1380 |
| 16 56 23 00 | 36,8022 | 36,6665 | 0,1358 |
| 16 57 23 00 | 36,7978 | 36,6620 | 0,1358 |
| 16 58 23 00 | 36,7933 | 36,6597 | 0,1336 |
| 16 59 23 00 | 36,7865 | 36,6710 | 0,1156 |
| 17 00 23 00 | 36,8157 | 36,6755 | 0,1402 |
| 17 01 24 00 | 36,8179 | 36,6710 | 0,1470 |
| 17 02 24 00 | 36,8134 | 36,6732 | 0,1402 |
| 17 03 24 00 | 36,8090 | 36,6665 | 0,1425 |
| 17 04 24 00 | 36,8022 | 36,6552 | 0,1470 |
| 17 05 24 00 | 36,7978 | 36,6507 | 0,1471 |
| 17 06 24 00 | 36,7933 | 36,6485 | 0,1448 |
| 17 07 24 00 | 36,7865 | 36,6395 | 0,1471 |
| 17 08 24 00 | 36,7798 | 36,6417 | 0,1381 |
| 17 09 24 00 | 36,7865 | 36,6732 | 0,1133 |
| 17 10 24 00 | 36,8202 | 36,6800 | 0,1402 |
| 17 11 24 00 | 36,8202 | 36,6822 | 0,1380 |
| 17 12 24 00 | 36,8157 | 36,6687 | 0,1470 |
| 17 13 25 00 | 36,8112 | 36,6687 | 0,1425 |
| 17 14 25 00 | 36,8067 | 36,6710 | 0,1358 |
| 17 15 25 00 | 36,8022 | 36,6732 | 0,1290 |
| 17 16 25 00 | 36,7955 | 36,6530 | 0,1426 |
| 17 17 25 00 | 36,7910 | 36,6440 | 0,1471 |
| 17 18 25 00 | 36,7843 | 36,6417 | 0,1426 |
| 17 19 25 00 | 36,7910 | 36,6890 | 0,1021 |
| 17 20 25 00 | 36,8224 | 36,6777 | 0,1447 |
| 17 21 25 00 | 36,8224 | 36,6777 | 0,1447 |
| 17 22 25 00 | 36,8179 | 36,6800 | 0,1380 |
| 17 23 25 00 | 36,8112 | 36,6710 | 0,1402 |
| 17 24 26 00 | 36,8090 | 36,6575 | 0,1515 |
| 17 25 26 00 | 36,8022 | 36,6575 | 0,1448 |
| 17 26 26 00 | 36,7978 | 36,6485 | 0,1493 |
| 17 27 26 00 | 36,7933 | 36,6530 | 0,1403 |
| H – hour; Min – minute; Ti - Internal temperature of the body; Ts – superficial temperature of the body; Dt – difference of temperatures (Ti – Ts) | |||
Table 2: Results of technical tests of ADD: evolution of temperature records in isothermal conditions (thermostat).
1 UI/100 m/dl + 0.5 UI/ for each 10 mg/dl more
Variant 3: Pump delivering in syringes with 50 UI fast acting insulin (Actrapid or Humulin Regular) in 50 ml NaCl 0.9% (stable during 24 hours). The pump delivery is stopped during 4 hours for enteric feeding or during investigations (surgery, MRI and other).
(Variant Table 3)
| Blood glucose | H0 | H1 | H2 | H3 | H4 | H5 | H6 |
| N | 11 | 10 | 11 | 9 | 4 | 3 | 3 |
| M | 4,886 | 4,85 | 5,25 | 4,954 | 3,98 | 4,24 | 5,89 |
| SD | 0,504 | 0,841 | 0,694 | 1,295 | 0,611 | 0,919 | 1,303 |
| Max | 5,53 | 6 | 6,03 | 7,24 | 4,58 | 4,82 | 6,82 |
| Min | 3,82 | 3,38 | 3,87 | 3,09 | 3,13 | 3,18 | 4,4 |
| SD/M % | 10,3 | 17,3 | 13,2 | 26 | 15,3 | 21,6 | 22,1 |
| Dt | H0 | H1 | H2 | H3 | H4 | ||
| N | 6 | 5 | 4 | 3 | |||
| M | 0,2005 | 0,135 | 0,035 | -0,045 | |||
| SD | 0,222 | 0,122 | 0,171 | 0,2? | |||
| Max | 0,634 | 0,309 | 0,28 | 0,07 | |||
| Min | 0,026 | 0,005 | -0,106 | -0,113 | |||
| SD/M% | 111 | 90,3 | 480 | 9? | |||
| Lact.M+F | H0 | H1 | H2 | H3 | |||
| N | 6 | 7 | 5 | 5 | |||
| M | 16,3 | 18,4 | 19,6 | 20,88 | |||
| SD | 3,67 | 8,08 | 3,49 | 9,09 | |||
| Max | 20,6 | 30,4 | 16,5 | 12,6 | |||
| min | 11,6 | 10,1 | 24,4 | 33,8 | |||
| SD/M % | 22,5 | 43,9 | 17,8 | 43,5 | |||
Table 3: Results of blood glucose (in mM/l), Dt (in °C) and lactate (in mg/dl) values measuring once an hour (H) in healthy people. NB each subject has not undergone each investigation at each moment.
Adoption of one or other schema depended on circumstances (severity, responsiveness, aim of treatment and other factors). Glucose administration was provided in case of hypoglycaemia. We were not informed about previous modalities of insulin therapy and preferred to stop it at the beginning of the session, common condition being lack of success of this therapy.
In the case of CIT use the algorithm of insulin/glucose delivery was the following:
(Variant Table 4)
| Series | N patients | Hypoglycaemia events | Yoyo Events | |
|---|---|---|---|---|
| N / % | MSD ± (min-Max) | N / % | ||
| TIT | 19 | 5/26 | 2.43 ± 0.72 (1.82-3.67) |
4/21 |
| CIT | 39 | 10/25 | 3.25±0.32 (2.72-3.63) |
3/7.69 |
| p | 71 | No significant | p=0.05 | Significant |
| TIT – traditional insulin treatment; CIT – Complex insulin treatment; N – patients number | ||||
Table 4: Complications during treatment of DM 1 patients
In our cases insulin was injected immediately after the catheter insertion at the rate of 30 impulses/min.
Considering the frequent severe fall of glycaemia during the first hour and a low Dt registered later, glucose was also injected at the rate of 5-10 g/hour (covering half of delivered insulin) according to Dt evolution. Preliminary test has shown no difference between action of Aktrapid and Humulin.
Investigations
Evaluation of the capillary or arterial glycaemia was performed once an hour by strip method (One Touch, USA) and controlled each 3 hours by arterial glucometer (“Glucose and lactate Analyser”, Eco Basic United, Moskau).
Glycaemia was considered as normal if included between 3.88 and 7.7 mM/l (70 and 140 mg/dl), increased but acceptable between 7.71 and 11.1 mM/dl (141and 200 mg/dl).
So glycaemia < 3.88 mM/l (70 mg/dl) was considered as hypoglycaemia, between 3.88 and 11.1mM/l (200 mg/dl) - normal till 7.7 mM/l, or acceptable, higher 11.1 – hyperglycaemia; maximum observed was 33 mM/l (599.4, i.e. 600 mg/dl).
Dt < 0.05 and > 0.2°C was considered as pathologic [22,27,28].
In healthy subjects blood lactate level was also evaluated in order to test the possible harmfulness of the Dt investigation (same device as for blood glucose measure).
The patients underwent usual in ICU clinic investigations (laboratory, ECG, blood pressure monitoring). They were under our observation during the ADD-CIT procedure, after what they returned to ICU responsibility or were transferred into other units. Late observation was not provided by our teams and the further follow up of the patients out of ICU was not considered.
Our investigations were allowed by the Health Ministry of Russian Federation and by Ethic Committee of CHU Brugmann, Brussels (NN° 20/2011 and 23/2013).
Statistic evaluation was provided using Average or Mean +/- Standard Deviation (M+/- SD) calculation and Td against Tst Student criterion determination of liability (p). Involvement of other not parametric statistic was considered but did not change the results. Correlation between Dt and glycaemia were calculated on the basis of Dt and glycaemia at the same hour( 1-2-3 …), glycaemia at hour 0 and Dt at hour 1, and glycaemia at hour 2 against Dt at hour 1 considering the possible discordance in time of the two parameters [13,14]. NB at hour 0 that is at the moment of introducing the rectal catheter Dt cannot be registered because a 30 min time is necessary for adaptation of temperature sensors to organism conditions.
Technical tests
A good stability of Dt = - 0.006°C +/- 0.0001°C, was shown at room isothermal conditions when both sensors were submitted to the same external temperature under a lamp in constant air temperature without air movement (Figure 2a). This not significant difference has shown no tendency to change in relation to the exposition duration (6, 12 hours) or during the time (tests provided each 6 months).
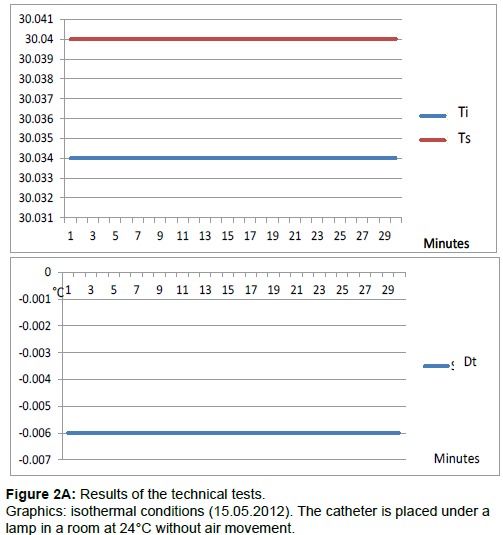
Figure 2A: Results of the technical tests. Graphics: isothermal conditions (15.05.2012). The catheter is placed under a lamp in a room at 24°C without air movement.
The sensitivity of Dt was also satisfactory: the reaction to any provoked isolated temperature change at the level of one or the other sensor was immediate (< 1 min) and appropriated (that is: the increase of temperature on the Tc sensor led to Dt increase and on the contrary, increase of temperature on Ts sensor led to Dt decrease).
Calibration tests were provided in a copper container plunged in water at a fixed by rotation mixing temperature of 36.85°C. The temperatures registered by the sensors, differed from that observed in the water and varied with a periodicity of 10 min (Table 2 and Figure 2b). Dt variations did not excess 0.038°C (0.1515 – 0.1133), were repetitive without significant variations. That was compatible with CIT session providing,
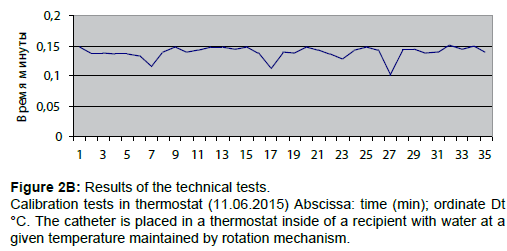
Figure 2B: Results of the technical tests.
Calibration tests in thermostat (11.06.2015) Abscissa: time (min); ordinate Dt °C. The catheter is placed in a thermostat inside of a recipient with water at a given temperature maintained by rotation mechanism.
Animal tests
In vivo the Dt registration line was fluctuant (Figure 3b). There were 2 kinds of oscillations: very small amplitude ones, representing about 0.001°C, being present during the whole observation, and more important ones that may be linked with the excessive sensibility of the sensors to the natural metabolic oscillations (for prove, after death the line is smooth). The amplitude of these oscillations may reach 20-50% and more of the mean value that must influence statistics evaluations.
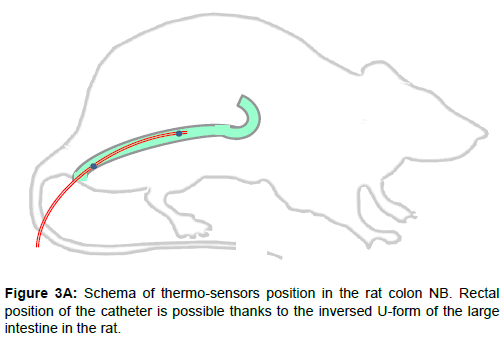
Figure 3A: Schema of thermo-sensors position in the rat colon NB. Rectal position of the catheter is possible thanks to the inversed U-form of the large intestine in the rat.
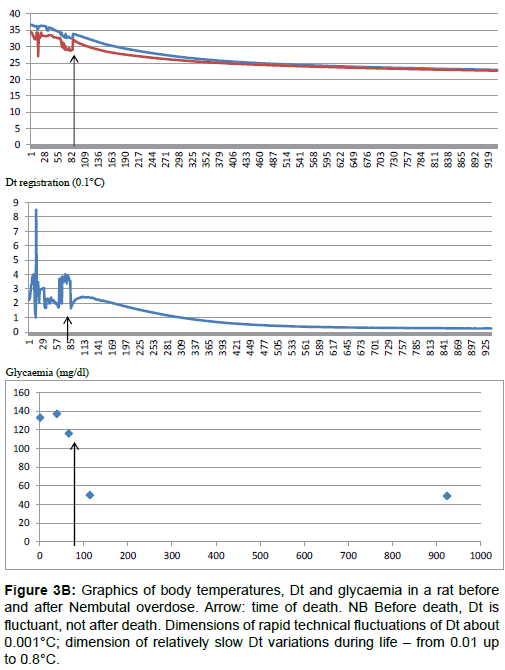
Figure 3B: Graphics of body temperatures, Dt and glycaemia in a rat before and after Nembutal overdose. Arrow: time of death. NB Before death, Dt is fluctuant, not after death. Dimensions of rapid technical fluctuations of Dt about 0.001°C; dimension of relatively slow Dt variations during life – from 0.01 up to 0.8°C.
Clinical tests
Healthy subjects (Table 3 and Figure 4)
As seen in Figure 4a, during a session in healthy man, Dt is represented by a fluctuant line with a tendency to decrease with the time. It is to be noted that glycaemia has also decreased.
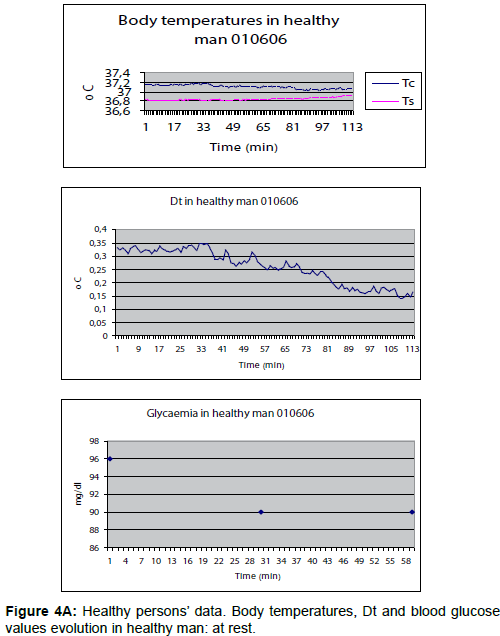
Figure 4A: Healthy persons’ data. Body temperatures, Dt and blood glucose values evolution in healthy man: at rest.
During physical exercise, Dt presented negative values corresponding to the duration of the effort (Figure 4b).
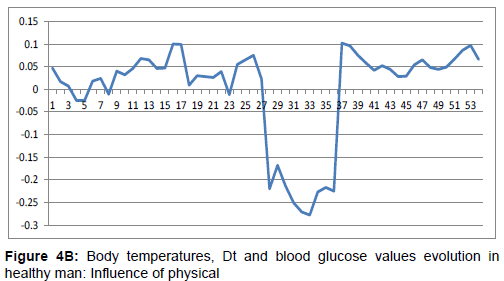
Figure 4B: Body temperatures, Dt and blood glucose values evolution in healthy man: Influence of physical
The results of 4 hour sessions in 13 healthy patients are shown on Table 3 and Figure 4c.
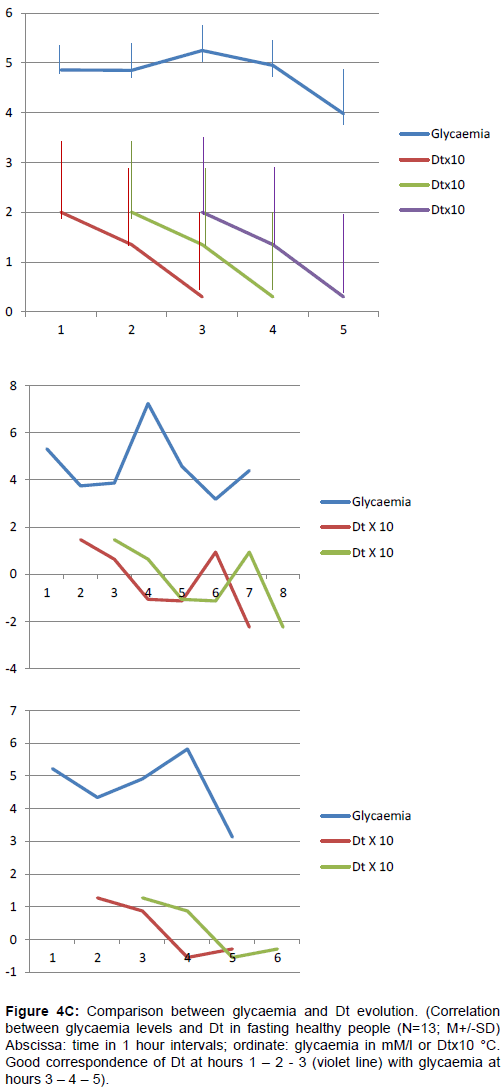
Figure 4C: Comparison between glycaemia and Dt evolution. (Correlation between glycaemia levels and Dt in fasting healthy people (N=13; M+/-SD) Abscissa: time in 1 hour intervals; ordinate: glycaemia in mM/l or Dtx10 °C. Good correspondence of Dt at hours 1 – 2 - 3 (violet line) with glycaemia at hours 3 – 4 – 5).
The average each hour glycaemia values never excessed 5.9 +/- 2.2 mM/l and never fell under 3.98 +/- 0.66 mM/l with variability from 11 to 21%. In some cases episodes of hypoglycaemia were observed (but no lower 3.2 mM/l).
Dt was 0.20+/- 0.025°C at the beginning of the session and has fallen to 0.035+/- 0.1°C at the end. The variability of the Dt results has reached 100% and more. In some cases a decrease of Dt down to negative value was observed preceding from 1-2 hours the hypoglycaemia episodes (Figure 4c).
In conditions of simultaneous registration of all the parameters realized in 3 healthy subjects, the average results of glycaemia evaluation show no significant difference with the preceding ones. The observations were similar for Dt average values with a variability above 50%. Four sessions provided on the same volunteer have shown compact repetitive data for both glycaemia and Dt at hour 0 (variability < 5%). During the 2 sessions provided before breakfast Dt was low (0.127 and 0.026°C). Average lactate levels in capillary blood remained under 21 mg/dl. So these data might be used as a basis range for the comparison with ICU patients. Correlation between same time Dt and glycaemia were practically inexistent, whereas it is much better when comparing Dt at hours 1- 2- 3- with glycaemia at hours 2-3-4… i.e. when difference of 1 hour is observed (Figure 4c). But the curves may be different, depending on the subjects (Figure 4c).
Patients with severe hyperglycaemia
Between the two groups of patients with DM 1 no significant difference in values of initial glycaemia range (higher 11.1), sex repartition, age and BW (Table 1). The average of session duration was analogous in the 2 series – respectively: 6.73 +/- 2.18 and 5.79+/- 2.66 hours.
The results are presented in Figure 5, Tables 4 and 5.
| Series | N patients | N failures | Glycaemia increase | Glycaemia decrease % | ||
|---|---|---|---|---|---|---|
| (%) | N / % | M±SD [min-Max] |
N / % | M±SD [min-Max] |
||
| TIT | 19 | 12 (63.1) | 5 (26) | 32.76 ± 25.63 +[4.3-48.9] |
7 (36.8%) | 17.4 ±19.3 -[0.8 - 51.1] |
| CIT | 39 | 3 (7.69) | 4 (10) | 44.75±8.91 +[7.5-93] |
6 (15.3%) | 28.2 ±18.8 -[0.7-32.6] |
| p | 71 | Significant | Significant | No significant | Significant | No significant |
| TIT – traditional insulin treatment; CIT – Complex insulin treatment; N – patients’ number | ||||||
Table 5: Analysis of treatment failures (glycaemia > 11.1 mM/l at the end of the session).
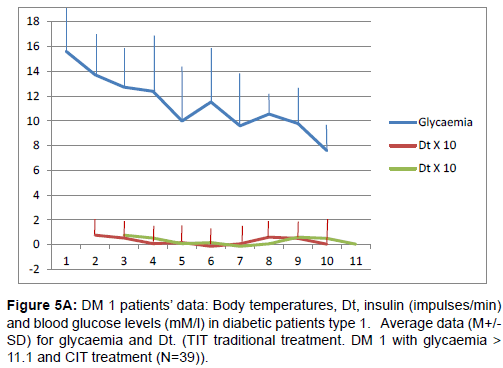
Figure 5A: DM 1 patients’ data: Body temperatures, Dt, insulin (impulses/min) and blood glucose levels (mM/l) in diabetic patients type 1. Average data (M+/- SD) for glycaemia and Dt. (TIT traditional treatment. DM 1 with glycaemia > 11.1 and CIT treatment (N=39))
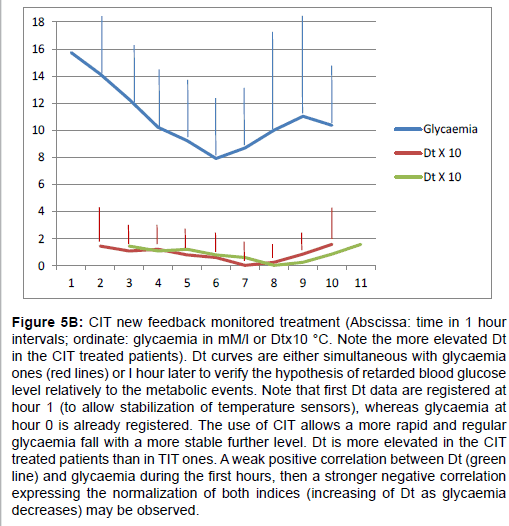
Figure 5B: CIT new feedback monitored treatment (Abscissa: time in 1 hour intervals; ordinate: glycaemia in mM/l or Dtx10 °C. Note the more elevated Dt in the CIT treated patients). Dt curves are either simultaneous with glycaemia ones (red lines) or I hour later to verify the hypothesis of retarded blood glucose level relatively to the metabolic events. Note that first Dt data are registered at hour 1 (to allow stabilization of temperature sensors), whereas glycaemia at hour 0 is already registered. The use of CIT allows a more rapid and regular glycaemia fall with a more stable further level. Dt is more elevated in the CIT treated patients than in TIT ones. A weak positive correlation between Dt (green line) and glycaemia during the first hours, then a stronger negative correlation expressing the normalization of both indices (increasing of Dt as glycaemia decreases) may be observed.
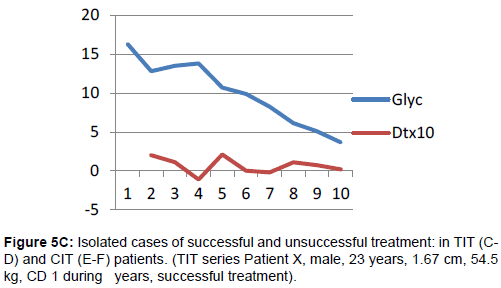
Figure 5C: Isolated cases of successful and unsuccessful treatment: in TIT (CD) and CIT (E-F) patients. (TIT series Patient X, male, 23 years, 1.67 cm, 54.5 kg, CD 1 during years, successful treatment).
In the group “TIT” insulin and glucose were administrated intravenously according to usual schemas depending on glycaemia records and their total amount delivered during ADD observation was not registered (it may be calculated). Acceptable glycaemia level (<11.1 mM/l) was observed after the hour 4 in 36.8% of the cases, but was not quite stable (Figure 5). 12 patients (63.1%) might be considered as unsuccessfully treated at the end of the session (between 3 and 9 hours).
In the group “CIT” insulin was delivered intravenously by the device in impulses from 0.00005 to 0.0002 UI each according to Dt evolution. The mean total amount of Humulin (13 patients) or Aktrapid (26 patients) was 32+/- 20 IU, i.e. about 5.54 IU/ hour. Individual average insulin delivery varied from 2.5 IU/h up to 10 IU/h. Glycaemia < 11.1 mM/l was obtained after 4 hours in 73.5% of the patients and stable. 10 patients (25.6%) might be considered as unsuccessfully treated at the end of the procedure (between 2 and 9 hours).
Concerning complications, hypoglycaemia was encountered similar in both series but was less important with CIT, and yo-yo events were significantly less frequent in CIT series (Table 4). Treatment failures were most frequent in the TIT series (Table 5).
The Figure 5 graphics also show, that in both series Dt curves were parallel to glycaemia ones during the first hours. Later a negative correlation was to be noted. Dt was also significantly higher during CIT sessions than during TIT ones. In CIT series generally, if positive issue was not obtained after the 3-4 hours procedure, chances to obtain it later were minimal. Moreover the individual analysis has shown that later the condition of the patient seems to degrade: stress due the discomfort, necessity of food intake or defecation, of other procedure providing.
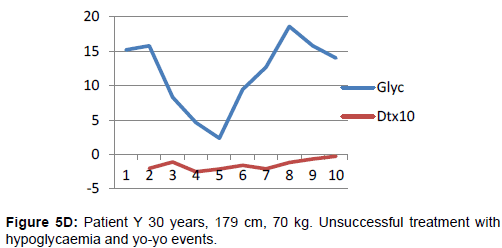
Figure 5D: Patient Y 30 years, 179 cm, 70 kg. Unsuccessful treatment with hypoglycaemia and yo-yo events.
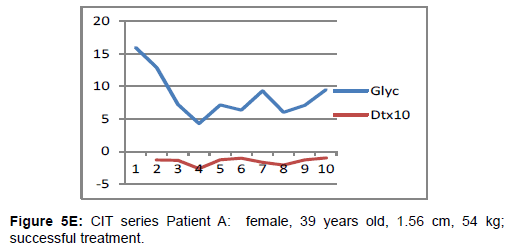
Figure 5E: CIT series Patient A: female, 39 years old, 1.56 cm, 54 kg; successful treatment.
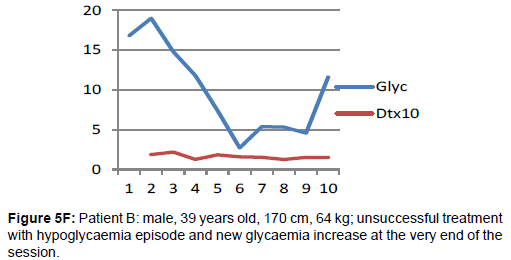
Figure 5F: Patient B: male, 39 years old, 170 cm, 64 kg; unsuccessful treatment with hypoglycaemia episode and new glycaemia increase at the very end of the session.
The analysis of the presented data induces/suggests different commentaries concerning the methods of their obtaining as well as their signification. As to the device itself, the principle seems to be interesting and useful, but the realization may (must) be improved. The future construction must insure a greater stability of the sensors either each of them or the strong parallelism of their evolution. In the present work periodic calibration was provided, the main point to be reached being a stable Dt rather than exact temperature registration by the sensors. It meant that a derivation of the sensor quality may be tolerated unless it is the same for each of them.
The animal investigations had confirmed the feasibility of the method, confirmed the liability of registered parameters as well as their general biological interest. They have shown that the system itself introduces negligible oscillations (<0.01°C) which do not interfere with larger and more important (>0.2-0.5°C) ones) Figure 3b. May Dt be influenced by external room temperature variations? Probably, but it cannot be the cause of the mentioned variations, because external temperature changes would be much slower (not every minute) and because the catheter lies within the body and thus is like thermostat conditions. So the observed waves probably reflect the excessive (?) sensibility of the sensors to the natural temperature oscillations due to metabolic changes during life process. This is corroborated by the fact that they disappeared after death. It is also known that such oscillations in life parameters exist: literature data [35-37], as well as our own experience with continuous glycaemia registration [25] have shown that oscillations are a characteristic of the living organism processes and a condition of their equilibrium. A quick response of Dt to body energetic losses, as shown during fasting or physical exercise (Figure 3b), may be considered as a warrant of tight adaptation possibility of the insulin delivery programmed on the basis of Dt evolution. But the amplitude of these oscillations may reach 20-50% of their mean value that must influence the statistical analysis possibilities. It is to be noted that in our data analysis Dt and glycaemia ciphers were recorded once an hour and the chosen moment could correspond at different hours to different points of the minute Dt oscillation increasing the variability. From this point of view a parallel continuous registration of both Dt and glycaemia parameters would be interesting.
Nevertheless, comparison of DT and glycaemia curves in animal but especially in human observations seem to confirm the suggested “delayed” glycaemia registration relatively to the real situation of the organism [13-15]. Indeed blood glucose values will change immediately after a stress (recirculation time for hormone action is no more than 20-40 seconds if heart beating rate is 80/min), after intra venous glucose solution injection, rather quickly after ingestion of glucose, slowly after ingestion of “slow sugars” which need enzymatic digestion. Dt rather depends on the energetic conversion of new glucose entry or on energetic expenditure and then may react almost immediately. This explains the strange and different correlations between Dt and blood glucose levels during a same session, as well as different reactions and changes of the correlation sign in different people even independently of their health condition. For instance, at the beginning of the session Dt fall may correspond to the increased glucose utilization due to important and rapid insulin injection. Later, parallel to the glucose metabolism normalization and a Dt increase has been registered. But anyway, in “quiet” periods, when none external entry of food or glucose is waited, Dt decrease might remain/become an early and sure indicator of energetic deficit and could be tested for/ in hypoglycaemia prevention. This is supported by ADD-CIT use in DM 1 patients. Sure, in both series TIT or CIT have received rational insulin treatment and in most cases their glycaemia has decreased. The comparison was biased by several moments. First: the preceding treatment was unknown (kind of insulin as well as delivered doses); Second: in CIT series for avoiding total treatment interruption during the first 30-60 min after catheter introduction (time necessary for sensor stabilisation) insulin was injected with a constant speed of 30 impulses/ min and according to the initial glycaemia each impulse meant from 0.00005 to 0.0001 IU (according to the chosen insulin dilution), i.e. up to 3,6 IU/hour. Third: glucose administration was also provided, but monitored by the physician and not by the device program: the signal for its beginning was Dt decrease in spite of glycaemia decrease or stabilization at an acceptable level (algorithm p.5). Nevertheless CIT seems to have insured a little more quick and stable normalization of the patients’ glycaemia and general condition than TIT. It has significantly diminished the yo-yo episode frequency, hypoglycaemia gravity and number of the treatment end failures (Tables 4 and 5). The higher values of Dt during CIT sessions may testify a better energetic balance than in TIT, resulting from a more adequate insulin delivery. Diminishing of total insulin dose necessary for re-equilibration of glucose metabolism is highly probable because of strong adaptation to the needs, but presently not proved enough.
About session duration in ICU patients the data have shown that the benefit of more than 4 hours session was not significant. In the case when acceptable glycaemia level was not obtained, it is probably wiser to provide a second session on the following day (some examples had confirmed it). The harmlessness of Dt investigation has been demonstrated by the results of the lactate measures in healthy volunteers.
The proposed continuous differential measure of the body temperature gradient (Ti-Ts=Dt) and the use of its evolution as a base for insulin delivery monitoring seems to be a high sensibility and liable new feedback for programming an insulin pump and a confirmation of our initial hypothesis. The high variability of Dt does not signify an absence of liability, but mainly a high individual specificity and reactivity that allow a continuous following of the organism energetic situation and an adequate feedback for monitoring minute by minute of insulin delivery. The changing character of the Dt/ glycaemia correlation may depend on the rapidity of the ratio glucose intake/utilization modifications, for instance due to stress during the investigation or food ingestion or other. It may also reflect deep metabolic processes which deserve further investigations. But anyway a Dt reaction will always occur and is supposed to allow adapt the insulin monitoring to the changing situation.
In spite of the low liability level of the present study (retrospective, low matching between series), it is possible to define/ propose the following evaluation:
Advantages of ADD-CIT use
Tiny, adequate, continuous insulin delivery monitoring thanks to a fast feedback, allowing better results of the treatment and less complications.
Limits
Rectal position of the catheter and so limited duration of the monitoring; absence of simultaneous glucose delivery monitoring on the same Dt basis.
Perspectives
Search for other catheter placing, simultaneous insulin and glucose delivery monitoring, adaptation of the device principle to bearable outside or internal insulin pump.
This allows plan of providing more important clinical assay for control and confirmation (or not) of these conclusions, up to multicentre prospective randomized studies in strongly determined conditions that will be possible as soon as several devices will exist.
The authors express their thankfulness to Professor P. Bergmann (head of the ULB Experimental Medicine Laboratory, Brussels, Belgium), Drs A. Bodson and G. Krzentowski (Endocrinology Unit of the Charleroi CHU, Belgium), Dr P. Delrée (IPG Gosselies, Belgium), for their everlasting support and concrete help in collecting and/or discussing the data; to Mr A. Bekkouri for technical occasional support, to Ms M. Leroy (IPG Gosselies, Belgium) and M. J-L Kempeneers for their logistical help.