Journal of Pollution Effects & Control
Open Access
ISSN: 2375-4397
ISSN: 2375-4397
Research Article - (2016) Volume 4, Issue 3
Natural aggregates, represent the main source of construction aggregates in Turkey and throughout the world. The processing of sand and gravel industry is one of the mineral products industries and generally lead the formation of sudden and intense particulate emissions. In this study, the results of the air quality measurements which were followed throughout one year in Istanbul Anatolian Side Sand Cooperative (IASSC) are summarized and the measuring methods are explained briefly. IASSC is a sand and gravel sales cooperative which was established near the residential area in Istanbul. For this reason, air quality measurement results are of great importance in terms of public health. The purpose of this air quality monitoring study is to determine the compliance with regulations taking into account potential impacts on human health and the environment. The suspended particulate matter and the settleable particulate matter parameters were monitored. At the end of the observation period, it is determined that, the average values for both of the parameters from the plant are compatible with the standards, but because of the results of especially settleable particulate matter parameter were under close proximity to the limits, some recommendations were made for increasing the air quality in the plant.
Keywords: Settleable; Suspended; Particulate; Sand; Gravel
Air pollution is one of the major hazards that will affect the future generations. Air pollution in some parts of the world has reached a risky level due to the industrial development [1]. Turkey makes an important effort not to become a part of this air pollution especially in recent years. The first convention entered into by Turkey was the Convention on Long-Range trans-boundary Air Pollution (Geneva 1979, accepted by Turkey on 23.03.1983), which was followed by the Vienna Convention for the Protection of Ozone Layer (Vienna 1985, accepted by Turkey on 08.09.1990), The Montreal Convention (Montreal 16.09.1987, accepted by Turkey in 1990), United Nations Framework Convention on Climate Change (United Nations Framework Convention on Climate Change: 09.05.1992, accepted by Turkey on 11.11.2003) and The Kyoto Protocol to the United Nations Framework Convention on Climate Change (Kyoto Protocol, the United Nations Framework Convention on Climate Change: 11.12.1997, accepted by Turkey on 13.05.2009).
Regulation on Protection of Air Quality (Took effect upon publication in the Official Gazette Issue No.19269 of 02.11.1986) [2], which were directly related to Air Pollution, has entered into force in order to put forth details of control the smoke, dust, gas, steam and aerosol emissions that are discharged into the atmosphere as a result of any kind of activities, and to protect human and environment against any hazard that may arise from pollution of atmospheric environment. This regulation was based for the comparison of the results of this study about settleable and suspended particulate matter parameters arising from sand and gravel industry. Furthermore, Turkish national regulations related to the dust emissions were revised as follows: Regulation of Controlling Air Pollution Caused by Industry (2004), Regulation of Controlling Air Pollution Caused by Industrial Facilities (2004), Assessment and Management of Air Quality Regulation (2008), which was revised again in 05.05.2009. There was no change for the limit values in these regulations for the settleable and suspended particulate material from sand and gravel industries according to the Regulation on Protection of Air Quality (1986).
It should be taken into consideration that the purpose of air quality monitoring before the selection of the sampling and analysis methods. The monitoring purposes of this study can be summarized as; determining the amount and the sources of emissions, the identification of potential impacts on human health and environment, determining the compliance with legal regulations and collection of basic data needed for the development of a realistic program for air quality management [3].
For this case study, monitoring parameters are settleable and suspended particulate matter from sand and gravel industry. The most important effect of the particulate matter in the human body is the effect caused by the respiratory tract. Particulate matter in the respirable size, can act in two different ways; direct mechanical effect(irritant effect) on respiratory system and indirect effects of toxic compounds as carriers. As a result of exposure to respirable particles may be disturbances in lung functions and respiratory disorders [4-7]. Sand and gravel industries are often close to the residential centers in order to minimize the transportation costs, so particulate matter emissions from these industries are too important for human health.
The sand and gravel industry is a mineral industry for the processing and storage of unconsolidated granular media. Generally, granular materials obtained from natural deposits in the sea and the river beds moved in different ways such as, motor buckets, movable loaders, safety carriers and suction pumps depending on the characteristics of from where they were removed. Blasting method can also be used in rare cases like spread dust emissions will be less for low volumes. Air pollution from sand and gravel industry varies greatly depending on the characteristics of dust emissions of the industry [8]. If the source of the material is dry and granular material contains a high proportion of silt, dust emissions will be intense. If the source is wet and if granular material is removed with dredge, the dust emissions because of the moisture content of the material are negligible. Silt is described as small particulate matter less than 75 microns in size. Size reduction may be required for sand and gravel industry in some cases and causes high silt production [9]. However like a reduction in size were not used in (IASSC) so, sand and gravel processed in their native form and silt production was law.
Sand and gravel industries are often close to the residential centers in order to minimize the transportation costs. In addition, they are also close to the shores of the rivers or sea beds which they are formed from, because the main sources of sand and alluvial silt deposits are the seas and the rivers [10,11]. The sand and gravel industry in this study was also near the sea shore and so, the sand and gravel wet and dust emissions from the processes of the plant were generally low.
However, after drying effect of the wind causes the formation of sudden and intense particulate emissions. This type of dust emissions is not toxic but their irritating effect take precedence. PM10 particles are usually large enough to affect these dimensions, even if some of the smaller this effect is negligible. (For the different measurements of PM10’s in sand processing plants it has been found that it constitutes only 1% of the total particulate matter at maximum.) (EPA 1988, Compilation of air pollutant emission factors provides).
The process in IASSC starts with the downloading of sand and gravel from the ships to the shore with moving buckets to be stored in stacks. Usually issued granular material are stored or transported by conveyors taking into account future needs. Dust emissions may occur during transport and storage of sand and gravel because of dry ingredients [12-14].
However, in IASSC, sand and gravel being transported to the plant from a close source and so sand and gravel were wet at the first storage and dust emissions from the first storage is not at high levels. After first storage sand and gravel go to sieves on the moving belts and the process of elimination with water starts. Besides the dimensional separation process, separation of large unwanted objects etc. coming from the sea, takes place here by using different size screens. After the size analysis, high particulate matter emissions created from the sand dunes at the last storage with drying of sand. When sand and gravel on the sales phase some dust emission occurs during loading onto trucks. “Dust emission also occurs during loading onto trucks when sand and gravel on the sales phase.” The equipment used during the measurements were placed taking into account the high particulate matter emission sources in the plant area and dominant winds blowing from the sea.
Settleable and suspended particulate matter parameters were monitored in this study. High volume gravimetric measuring instrument was used for the suspended particulate matter parameter monitoring. The device starts with a filtering system. Then the amount of measuring gas was measured by the air flow meter. There is a vacuum motor at the end of the system. The system operates with electric power. Whatman GF / C type of glass fiber filter is placed into the engine with an electric vacuum filtration system. (Filter paper is dried in 105°C than weighed and cooled in desiccators. This process repeated after each measurement.) The amount of air passed through the meter is determined in the meantime. Measurement instruments were constructed so as to form a circle around the work area in the 10 m eastern, 10 m northern and 15 m northeast directions. Different measuring distances were selected because of electrical installations.
At first test measurements were made and some information was obtained from the workers about the wind directions. In the measurements which were made by western direction very low values were obtained according to northern and eastern values. That was because of the winds blowing from the sea. So, in the assessment of measuring results the northern and eastern values were considered and western values were eliminated. Measurements made at least 5 working days per month in both the northern and eastern directions and measurements were continued for a year.
In this study, settleable particulate matter is observed with the “Directed Precipitation Measuring Device (DPMD)” which was described in Turkish standard named TS 2342 [15]. This device is used in the collection and the determination of impurities in the atmosphere which can settleable with its own weight or rain and so on according to the direction they came.
The device consists of three main parts including support, collection headers and collection bottles. Support has been designed to collect part of the collection titles, a bar of wood or metal. Support rod is 1.5 m up from the floor or ground not be buried in the ground and must be stand on a tripod attached to it with three-or four-legged. It is resistant to chemical agents and wet. Collecting bottles are translucent, high density, polyethylene or glass bottles. Each bottle was used to specify the direction of the local area and marked with the title of collection. According to the Air Pollution Control Regulation Article 2.8, dated November 2, 1986, the measurement of settleable particulate matter must be done monthly basis for each location of measurement. In this study, measurements were carried out as monthly averages. Mesurement device was constructed at the north-eastern direction of the working area. The highest values for settleable particulate matter were obtained in glass signed as south-western direction as well. Whatman GF / C type of glass fiber filter paper was placed into the bottom of each bottle.
The filter paper diameter was chosen in an adjustable diameter equal to the diameter of the bottom of measuring instrument collection bottles and placed in bottom of the bottle after it is made ready for measurement according to standard methods. Filter paper is dried in 105°C than weighed and cooled in desiccators. This process repeated after each measurement. Value for weighing the difference between these two measurements divided to the diameter of the filter paper per day gives the total settleable particulate matter as mg /m2/ day. The results of measurements are given in results and discussion section.
Measurements were continued for one year period to cover four seasons. All measurement results are given in Table 1 for suspended particulate matter and settleable particulate matter parameters. The suspended particulate matter values in Table 1 are monthly average of the measurements of the five business days.
| Suspended Particulate Matter (mg/m3) | Settleable Particulate Matter (mg/m2/day) | |
|---|---|---|
| January | 42 | 124 |
| February | 68 | 194 |
| March | 52 | 210 |
| April | 66 | 288 |
| May | 92 | 342 |
| June | 138 | 405 |
| July | 98 | 416 |
| August | 130 | 378 |
| September | 70 | 340 |
| October | 42 | 235 |
| November | 40 | 272 |
| December | 29 | 151 |
| Winter, the average | 46 | 156 |
| Spring, the average | 70 | 280 |
| Summer, the average | 122 | 400 |
| Autumn, the average | 51 | 282 |
| Annual average | 72 | 280 |
Table 1: Results of the Settleable Particulate Matter Measurements.
Measurements for suspended particulate matter were carried out on the northern and northeastern directions but the higher values were obtained on northern direction. It is thought to be due to the prevailing winds blowing from the sea which is located in the south. The values in the northern direction for suspended particulate matter are given in Table 1. For the settleable particulate matter measurement, the filter paper which has equal diameter with the bottom of the collection bottle diameter mounted on the bottom of the bottle once ready for measurement in accordance with the standard methods as described above. After one month to the filter paper was dried again at 105°C, it cooled in desiccator humidity and then weighed. Weighing difference between the filter paper at the beginning and the end of the month per unit area of the paper on one day gives values for settleable particulate matter as mg / m2 / day. The highest values for this parameter were obtained in the northeastern direction and these highest values are also given in Table 1. Sand and gravel carrying trucks working near this direction are considered to be effective in handling high values for settleable particulate matter parameter.
As can be seen from the Figures 1-3 higher values are obtained during the summer months for two of the parameters. This situation during the summer months due to reduced precipitation and increased evaporation rate. It is thought that the dry sand and gravel cause high dust emission during the summer. Sales of sand and gravel and consequently truck working hours also increase in summer. The minimum values were obtained in winter months for both of the parameters because of increased precipitation and decreased sales.
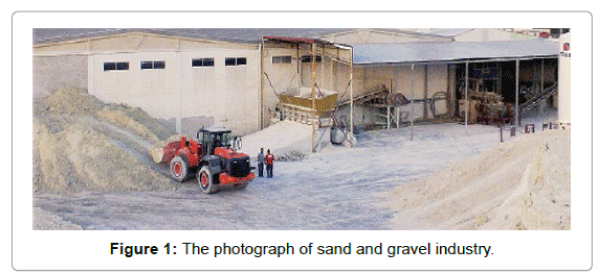
Figure 1: The photograph of sand and gravel industry.
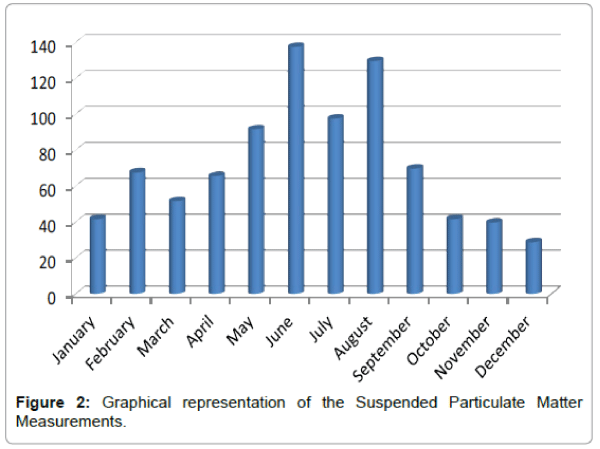
Figure 2: Graphical representation of the Suspended Particulate Matter Measurements.
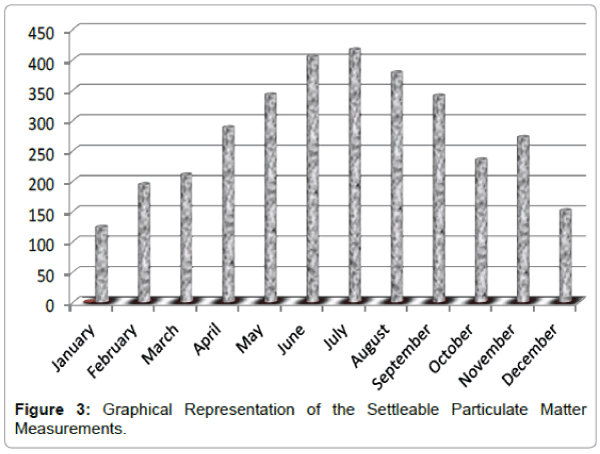
Figure 3: Graphical Representation of the Settleable Particulate Matter Measurements.
Average values obtained for both of the parameters in spring months and in autumn months are similar. In spring and autumn months precipitation is not as high as summer months and sales are more than winter months but less than summer months. So the values obtained in these seasons can be similar because of these reasons, but monthly average of spring is higher than monthly average of autumn as 70 mg/m3 to 51 mg/m3 for suspended particulate matter. It is thought that this is because of higher wind effect in spring months according to the autumn months in Istanbul.
Annual measurement results were evaluated on the basis of average values and compared with Turkish Air Quality Protection Regulation (TABCR) which had been published in the Turkish official gazette which dated as 2 November 1986, and revised on 05.05.2009 [2].
The measurement results as annual averages are compared with the standards for both of the parameters in Table 2.
| Suspended Particulate Matter(mg/m3) | TABCR Item 2-B (mg/m3) | Settleable Particulate Matter (mg/m2/day) | TABCR Item 1-B (mg/m2/day) | |
|---|---|---|---|---|
| Northern Direction | Northeastern Direction | LTL | STL | |
| 72 | 150 | 280 | 350 | 650 |
TABCR: Turkish Air Pollution Control Regulation.
LTL: Long Term Limit (the arithmetic average of all measurements which should not be exceeded).
STL: Short Term Limit (When the measurement results numerically arranged from larger to smaller ones 95% of the results shouldn’t exceed that value).
Table 2: Comparison of Results with Standards.
Table 2 shows that the measurement results for settleable particulate matter and suspended matter parameters in IASSC comply with the Turkish Air Pollution Control Regulation.
Especially for settleable particulate matter emissions in summer months the results are close to the limit values as long term limit. The highest value for settleable particulate matter is 416 mg/m2/day and also this value is less than short term limit.
The main reasons for this compliment with standards can be summarized as follows;
*Water is used in the size separation processes in the plant.
*Sand and gravel are brought to the plant by ships and there is no size reduction in the plant.
Summer average for settleable particulate matter is 400 mg/m2/ day and higher than long term value which is 350 mg/m2/day so some precautions are offered to IASSC;
*Keep loading and unloading work at low levels.
*Don’t store much sand and gravel in the work area (approximately 10 m in height and 2-3 heaps can be found in the industry depending on the operating conditions).
*Facility is installed right by the sea in ships, start processing immediately, without a reduction in the rate of moisture.
*Afforest the surroundings of the plant and reduce the wind effect.
*Overlap the trucks of sand and gravel and reduce the discharge height from the trucks.
IASSC took into account these recommendations within a very short time and made a working plan to make the necessary changes. Figure 4 shows IASSC after surroundings of the plant had been afforested.
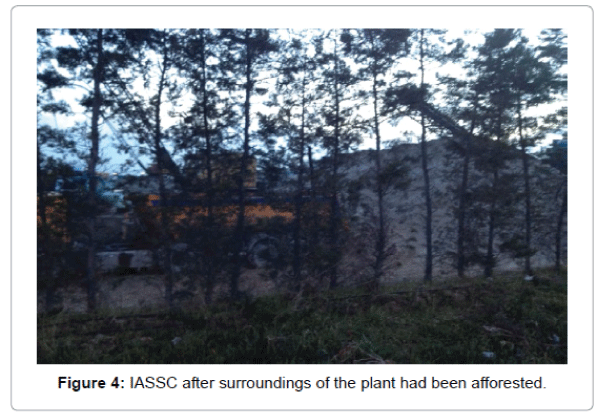
Figure 4: IASSC after surroundings of the plant had been afforested.