Mathematica Eterna
Open Access
ISSN: 1314-3344
ISSN: 1314-3344
Perspective - (2025)Volume 15, Issue 1
In the realm of probability theory and statistics, the concept of a Probability Density Function (PDF) serves as a cornerstone for understanding the likelihood of continuous random variables. As a mathematical tool, the PDF provides a framework for characterizing the distribution of probabilities within a given range. In this article, we delve into the intricacies of probability density functions, exploring their definition, properties and diverse applications across various fields of study.
Defining probability density function
A probability density function is a mathematical function that describes the likelihood of a continuous random variable falling within a particular range. Unlike discrete probability distributions that deal with distinct outcomes, a PDF is associated with continuous random variables, offering a smooth representation of the probabilities over a range of values.
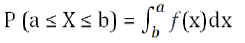
Mathematically, for a continuous random variable x, the PDF is represented by the function f(x), where f(x) ≥ 0 for all x and the total area under the curve of f(x) over its entire range is equal to 1. The probability of X falling within a specific interval
(a,b) is given by the integral of f(x) over that interval:
Properties of probability density function
Non-negativity: The PDF, denoted as f(x), is non-negative for all values of x. That is, f(x) ≥ 0 for all x.
Total area under the curve: The total area under the PDF curve over its entire range is equal to 1. This reflects the notion that the sum of all possible probabilities for a continuous random variable is unity.
Probability within an interval: The probability of a continuous random variable falling within a specific interval (a,b) is given by the integral of the PDF over that interval.
Probability at a point: The probability of a continuous random variable taking a specific value c is zero. Mathematically, P(X=c)=0. This is because the likelihood of hitting an exact point in a continuous distribution is infinitesimally small.
Applications in statistics
Normal distribution: The PDF is prominently used in describing the normal distribution, also known as the Gaussian distribution or bell curve. The normal distribution's PDF is characterized by its symmetrical, bell-shaped curve, providing a robust model for various natural phenomena.
Exponential distribution: The exponential distribution, commonly used in survival analysis and reliability engineering, relies on the PDF to describe the probability of the time until an event occurs.
Uniform distribution: In the uniform distribution, all values within a given interval have equal probabilities. The PDF for a uniform distribution is a constant function.
Beta distribution: The beta distribution, often used in Bayesian statistics, has a PDF that represents the probability distribution of a random variable constrained to intervals between 0 and 1.
Chi square distribution: The chi square distribution, frequently employed in statistical hypothesis testing, utilizes the PDF to model the distribution of the sum of squared standard normal deviates.
Cauchy distribution: The Cauchy distribution, known for its heavy tails, utilizes the PDF to depict the probability distribution of a continuous random variable.
Applications in physics and engineering
Quantum mechanics: In quantum mechanics, the wave function serves as a probability amplitude. The square of the absolute value of the wave function gives the probability density, akin to a PDF, for finding a particle at a particular location.
Signal processing: In signal processing, PDFs are employed to model the distribution of signal amplitudes or noise, aiding in the design and analysis of communication systems.
Reliability engineering: PDFs play a crucial role in reliability engineering by modeling the time until failure of a system or component. This is vital in assessing the reliability and durability of various engineering systems.
Finance and economics: Probability density functions are applied in modeling financial data, such as stock prices and interest rates. They help analysts and economists understand and predict market behaviors.
Citation: George B (2025) Probability Density Function: Illuminating the Spectrum of Statistical Distributions. Math Eter. 15:242.
Received: 28-Dec-2023, Manuscript No. ME-23-28816; Editor assigned: 01-Jan-2024, Pre QC No. ME-23-28816 (PQ); Reviewed: 15-Jan-2024, QC No. ME-23-28816; Revised: 13-Jan-2025, Manuscript No. ME-23-28816 (R); Published: 20-Jan-2025 , DOI: 10.35248/1314-3344.25.15.242
Copyright: © 2025 George B. This is an open-access article distributed under the terms of the Creative Commons Attribution License, which permits unrestricted use, distribution, and reproduction in any medium, provided the original author and source are credited.