Journal of Pollution Effects & Control
Open Access
ISSN: 2375-4397
ISSN: 2375-4397
Review Article - (2015) Volume 3, Issue 3
Forest fires have been serious menace, many times resulting in tremendous economic, cultural and ecological damage to many parts of the United States. One particular area that has been significantly affected is the water quality of streams and lakes in the water thirsty southwestern United States. This is because the surface water coming off burned areas has resulted in very serious and immediate water quality problems in streams, lakes and reservoirs in Arizona and the Southwest by introducing hazardous chemicals into the water bodies. The authors have examined data from two of the biggest forest fires in Arizona, the Rodeo Chediski and Wallow fires, and found the problem negatively affecting the water quality of many streams and lakes some with major fish kill. The results of the study may encourage local, state and federal government agencies and other decision-makers to develop better and more proactive policies, guidelines and funding mechanisms to drastically reduce catastrophic forest fires such as the Rodeo Chediski and Wallow fires that drastically impacted the quality of water and other ecosystem values in many areas of Arizona.
Keywords: Effects of forest fire; Forest fire management; Sediment yield; Water quality; Salt River; Radio-Chediski fire; Wallow fire
This paper is concerned with the effects of forest fires on water quality, especially surface water quality. Generally, the term “water quality” is used to describe the physical, chemical, and biological properties of water, usually in regards to its suitability for a specific use [1]. Surface water constitutes the main source of water for most domestic, industrial and commercial water supplies in the United States. The bulk of the surface water is the product of runoff from precipitation that falls as snow or rain on forested and rangeland watersheds. The nature of the surface flow, the condition of the watersheds it is produced in, its downstream routing mechanisms and the cover type and level of disturbance of the source area and the conduits through which the water flows are the determinants for the seriousness of the water quality problem from forested watersheds [2]. In many areas such as the arid and semi-arid Southwest, the understory vegetation, which is mostly grasses, forbs, and shrubs, is dry and susceptible to wild fires. Oftentimes, fire in the form of prescribed burning is used to protect these areas from wildfire. However, such fire suppression methods have resulted in overcrowded and dense forest vegetation that are sources for the abundant fuels in watersheds. This situation and the frequently recurring drought and the widespread invasive insect infestation have made most of these forest systems susceptible to catastrophic fires that scorch many of the Nation’s forests, rangelands, parks and private real estate properties [3-5]. In 2013, there were a total of 9,230 lightening started fires in the United States burning 1,237,330 hectares (ha). In the same year, there were 38,349 human-caused fires that burned 510,696 ha. This made the total area burned by the two types of fires in 2013 to be 1,748,026 ha 2 [6]. Such fires accounted for a total of $13.7 billion in total economic losses that included the $7.9 billion in insured losses from 2000 through 2011 in the United States [7,8]. These burns also have had tremendous effects on the characteristics of water-producing watersheds and the quality and quantity of the water coming out of them. This paper discusses the effects of wild land fires on water quality and peak flow, and suggests ways of managing fire-prone forested water source areas to prevent or minimize their effects on downstream water resources. The paper uses information from recently occurred large scale catastrophic fires in Arizona to demonstrate the effects of wild land fires on water quality and peak flow.
Recently, the western part of the United States has seen dramatic increases in the number and intensity of wildfires resulting in enormous damage to forests, rangelands and other rural areas of Arizona and the Southwest. For example, in the year 2013 alone, five federal agencies: the Bureau of Land Management, the Bureau of Indian Affairs, the Fish and Wildlife Service, the National Park Service and the Forest Service together spent $1,740,934,000 to suppress wildfires nationwide. The same activity cost the five agencies $1,902,446,000 in 2012 and $1,733,168,000 in 2011 [6]. These costs, though very large, do not include the monetary and material expenditure by other federal, state or local governmental agencies and private sources. State land departments, rural and urban communities’ fire fighters and land management groups also spend substantial amounts of money and materials to suppress wildfires at local levels. The monetary costs of forest fires such as the above are relatively small compared to the total losses in terms of numerous amenity values such as the various components of the ecosystem and other societal and environmental values. Most of the estimated monetary expenditures are related to short term costs incurred to put off the fire and rehabilitate the burned area, estimates for destroyed or damaged physical installations like buildings, and estimated values of burned timber and range and some other indirect short-term and/or long-term losses. We also note that such big fires have many other damaging effects, some immediate and others delayed, on the environment. The effects may also be short-lived or long lasting in their duration. At the time of burning, numerous valuable land resources such as timber, wildlife and wildlife habitat, understory vegetation, soil and soil chemicals, historical artifacts, residential homes and other structures are either seriously damaged, or completely destroyed. The delayed effects include numerous post fire environmental degradations such as loss of vegetation cover that leaves the land exposed to impacts from rainfall, runoff, wind and solar radiation resulting in soil hydrophobicity [9], flooding, soil erosion and off-site downstream degradation of streams, lakes and reservoirs [10,11]. Knowledge and good understanding of these possibilities is important for developing appropriate forest and other landscape management policies and methods to minimize the effects of forest fires on water quality.
The main concerns for hydrologists and water resources managers with wildfires are their impacts on water quality and peak flow. The hydrologic influence of vegetation cover ranges from intercepting and reducing the amount of precipitation reaching the ground to enhancing the rate of infiltration and thereby decreasing the amount and rate of surface flow. Wildfire, on the other hand, not only burns the vegetation cover but also destroys the forest floor and changes soil properties. Soil properties can experience short-term, long-term, or permanent fireinduced changes, depending mainly on soil characteristics, severity and frequency of fires, and post-fire climatic conditions [12]. Fire severity consists of two components: intensity and duration. Intensity is the rate at which a fire produces thermal energy. Although heat in moist soil is transported faster and penetrates deeper than in dry soils, latent heat of vaporization prevents soil temperature from exceeding 95°C until water completely vaporizes [13]; the temperature then typically rises to 200-300°C [14]. In the presence of heavy fuels, temperatures of 500-700°C may be reached at the soil surface [9], while values of up to 850°C can also be occasionally recorded [15]. And high temperatures above 300°C usually decimate the organic matter in the soil leading to the disappearance of soil hydrophobicity. For most fire burns, however, soil temperatures remain below 300°C leading to soil hydrophobicity. The latter slows soil infiltration rate and increases the rate of surface water movement [10,16-19]. Apart from changes in soil characteristics that decrease infiltration capacity and enhance surface flow, the other major effect of forest fires is on water quality, which is the subject of this paper.
The factors that affect the type and severity of post-forest fire water quality are complex and vary significantly from place to place depending on the amount and intensity of effective precipitation, soil and vegetation cover characteristics, and the geologic, topographic, and the nature of fire severity at the time in the area [20]. The water quality concerns related to fire burn may be grouped into physical and chemical related problems. The main physical water quality and associated problems that follow forest fire include erosion and sediment yield, turbidity, flooding, increased water temperature and soil physical characteristics [21]. The chemical water quality problems that may arise following a forest fire may consist of increased production of macronutrients, micronutrients, basic and acidic ions, decreased oxygen level and increased biological demand. Some of these chemicals come from the disturbed and bare ground and others are produced from the burned plant material. Increases in stream flow also change with time following fire disturbance. In general, Hibbert [22] and Hibbert et al. [23] found that first year water yield from various burned watersheds in Arizona increased by as low as 12 percent to one exceeding 1,400 percent of normal flow. Other studies indicate a much larger increase in peak flow following vegetation burn (Table 1). The effects of fires on storm peak flows are highly variable with the magnitude and variability of peak flows being dependent on many factors such as topography, soil and vegetation cover characteristics, burn severity, precipitation regime and temperature. Peak flows over burned areas in the Southwest have shown to increase in magnitude from 45 to 235,000 percent (Table 1) of that occurring on unburned areas during the summer months when highly intensive monsoonal thunderstorms are the norm in the area. The increase in Salt River stream peak flow of about 4,000 percent following the year 2002 Rodeo Chediski fire and by almost the same amount following the 2011 Wallow fire are very significant and fall in the above range [24]. Others have also found that the increase could even be higher as the values from a burned chaparral watershed in Table 1 shows. The increase in peak flow from some burned ponderosa pine (Pinus ponderosa) forested watersheds can reach as much as 235,000%. Now, the concern with the increases in peak flows is that they could lead to channel instability and degradation, and increased property damage in flood-prone urban and rural areas. This calls for careful management that includes thinning and prescribed fire of Southwestern forested watersheds and educating the public to completely put off camp fires to minimize the occurrence of severe wildfires that upset the normal quality and quantity of water in and from the forested areas.
| Location | Vegetation Type | Percent Increase | References |
| Southwestern U.S. | Chaparral | 2000-45,000 | Sinclair &Hamilton, 1955; Glendening et al., 1961 |
| Central Arizona | Mixed Conifer | 500-15,000 | Rich, 1962 |
| Arizona | Chaparral | 15,000 | Rich, 1962 |
| California | Chaparral | 87,000 | Krammes and Rice, 1963 |
| Arizona | Chaparral | 1,421 | Hibbert, 1971 |
| Oregon | Douglas-fir | 140 | Anderson, 1974 |
| Eastern Oregon | Ponderosa Pine | 45 | Anderson et al., 1976 |
| Central Arizona | Ponderosa Pine | 9,600 | Anderson et al., 1976 |
| Arizona | Ponderosa Pine | 2,300-40.000 | Campbell et al., 1977 |
| New Mexico | Ponderosa Pine | 10,000 | Bolin and Ward, 1987 |
| Arizona | Ponderosa Pine | 233-350 | DeBano et al., 1996 |
| Arizona | Ponderosa Pine | 40,660- 223,200 | Ffolliott and Neary, 2003 |
| Arizona | Ponderosa Pine | 9000-235,000 | Gottfried et al., 2004 |
| New Mexico | Ponderosa Pine | 16,000 | Woodhouse, 2004 |
| Northern Arizona | Ponderosa Pine | 200-5,000 | Leao, 2005 |
| Northeastern Arizona | Ponderosa Pine | 1,240-20,800 | Reed et al., 2011 |
Table 1: Percent increases in peak surface water flow following intense vegetation burn.
The level of influence of wildfires on water quality can be substantial depending on the severity of the wildfire, the nature of vegetation cover, and the physical and chemical characteristics of the burned area [9,25]. Large and fast stream flows from burned areas can pick and transport large amounts of debris, sediment and chemicals that significantly affect the quality and use of water downstream. Also, wildfires interrupt or terminate nutrient uptake, increase mineralization and mineral weathering. These were the cases in the recent three largest fires in Arizona. One of them, the Cave Creek Complex fire of 2005 burned 100,486 ha of forest, pastures and private property, generated huge amounts of sediment 5 load in streams and cost $16,471,000 to suppress. The largest fire in Arizona history, the Wallow Fire, which burned 216,519 ha in north eastern Arizona and parts of New Mexico in 2011, has very important environmental, cultural and economic effects on the area. The fire destroyed 72 buildings and hurt 16 people mainly on the Apache Sit greaves national forest in Apache, Greenlee, Graham and Navajo counties in Arizona and Catron County in New Mexico and resulted in a total loss of about $109 (even though, it will take years to estimate the actual cost of the fire). For example, it is difficult to estimate the aesthetic and recreational values lost due to the fire. But, even when we can arrive at some idea using some expert knowledge, such estimates are not included in fire suppression and burned area rehabilitation costs. For example, there were eight sports fisheries, five reservoirs and three stocked streams at risk due to the Wallow fire. Under normal conditions, the sports fisheries alone are expected to contribute 155,000 angler days and over 20 million dollars a year to the local economy. In addition to the possible losses to most of these benefits, the Wallow fire has resulted in lots of serious environmental and ecosystem degradations. The most obvious water quality-related adverse environmental effects of the fire were in the form of bed load and suspended sediment accumulations in lakes, reservoirs and stream flows that affected fish and other wildlife [25]. The persistence of flooding downstream of burned areas may continue to send ashes and sediment into streams, creeks and reservoirs for weeks and months after a fire. This is probably the reason Nelson, River and Luna in the burned area continued to receive large ash flows from the severely burned areas resulting in significant fish kill. Similarly, other lakes such as Helsey Lake and Ackre Lake were filled with sediment and suffered the most with all of their fish population dead. Also, a number of Apache trout (Oncorhynchus apache) and Gila trout (Oncorhynchus gilae) streams suffered significant fish kill. All together about 600 miles of stream were impacted by the Wallow fire. Specifically, four streams on the Apache side of the forest, Black, Little Colorado, San Francisco and Gila had a total of 960 Km (which is 81%) of their total distance significantly impacted by the fire to have their use for fishing remain closed for a while (Table 2). In addition, there were other affected streams that include Bear Wallow Creek, Hannagan Creek, KP Creek, Raspberry Creek and upper Coleman Creek. However, the effects were highly variable with some areas having the greatest impacts on fish population from ash flows and flooding following the Wallow fire. The most destructive of the three big fires was the Rodeo-Chediski fire of 2002. The fire was a part of 2.71 million hectares of forest and wildlife habitat area that burned in the USA in that year. It alone burned 189,648 ha of forest land, and destroyed 491 structures in the White Mountain area of Arizona. Other major environmental damages of the fire were in the form of physical and chemical problems that affected the quality and quantity of downstream water in the Salt River. The chemical water quality parameters measured at the Salt River entrance to Roosevelt Lake, following the Rodeo- Chediski fire, show significant increases in their concentration in the Salt River water. Six of the chemicals are the major macronutrients of calcium, magnesium and potassium shown in Figure 1, and sulfate, phosphorus, and total nitrogen in Figure 2. It is interesting to note that in spite of some increases in the calcium and sulfur concentrations, the values remain about one half of the U.S. EPA drinking water quality standards for the two nutrients, whereas the values for magnesium, potassium, phosphorus and total nitrogen rose about twice, five times, 390 times and 22 times above their EPA standard levels, respectively. Other chemical water quality indicators measured at the point where the Salt River enters Lake Roosevelt are the concentrations of the hazardous chemicals: lead, iron, Copper and arsenic. Their levels of concentration in the Salt River following the Radio Chediski fire are shown in Figure 3. The values are very high and dangerous, constituting of about 460%, 3000%, 300%, and 6850% of the U.S. EPA drinking water standards for lead, iron, copper, and arsenic, respectively. The last four measured water quality indicators represent changes in some physical conditions of the Salt River water following the Radio Chediski fire. The physical properties are flood magnitude, specific conductivity, turbidity and temperature of the Salt River water measured at the point where the River enters Lake Roosevelt. As shown in Figure 4, the flood magnitude there increased by 6000% following the Rodeo-Chediski fire. At the same time, the measured specific conductivity and turbidity levels increased by 422% and 1,020,000% above the U.S. EPA standards, respectively, while temperature rose to an uncomfortable level of 29°C. A summary of the post-Rodeo-Chediski water quality indicators values are shown in column 2 of Table 3. The table also shows a comparison of these values with those of the World Health Organization (WHO) [26] and those of the U.S. EPA drinking water standard values, as shown under columns 3 and 4 of the table, respectively. To summarize, a wildfire can have devastating effects on water quality and on water-dependent living things and the physical environment. This is demonstrated in the post Rodeo-Chediski chemical concentrations and physical water quality levels indicated in column 2 of Table 3. Most of these values when compared with those of the drinking water standards in columns 3 and 4 are very high and dangerous to aquatic life and other living things. For example, the turbidity value of 51,000 NTU, if persisted would make the reservoir water non-transparent and practically too dark for any limnetic and deeper dwelling aquatic organisms to function and thrive properly. Likewise, the high temperature value as well as the highly elevated presence of salts and other chemicals would make the water unsuitable for many organisms for some time like those of Lakes Helsey and Ackre in which all fish died following the Wallow fire. The very high macro- and micronutrient values can also lead to increased algal growth and eutrophication of stream and lake waters making them unfit for drinking and aquatic fish habitat. Luckily, the serious effect of the fire on the various water quality parameters did not persist for long [27,28]. This is demonstrated in Figures 1-4 in which the elevated levels of the various water quality parameters’ values in the Salt River decreased rapidly within a short time after the burn period. The decrease is expected to happen due to the diluting effect of the continuously flowing water in the Salt River. On the other hand, in lakes, where water is relatively stationary with little or no fresh water inputs, especially during drought periods, the adverse effects of forest fires on water quality would be more persistent leading to more lasting fish kill as observed in many of the lakes within the Wallow fire burn area following the fire. In any case, it is very important that the USDA Forrest Service, other federal, state and local land management agencies and private interests proactively work together in collaboration to prevent wildfire as much as possible. Coordinated actions they can take include appropriate forest thinning, occasional prescribed fire burning and preventing human induced fire ignition. Such actions would help avoid the tremendous losses in property, personnel and invaluable environmental and ecosystem damages usually incurred in wild fire burned areas.
| Streams in the Wallow-fire burned area | Lengths of perennial stream impacted by the fire | Lengths of perennial stream NOT impacted by the fire | Proportion of streams affected by Wallow fire | Streams closed to fishing following the Wallow fire |
| Black River | 375 | 11 | 97 | Yes |
| Gila River | 61 | 26 | 70 | Yes |
| Little Colorado River | 209 | 97 | 68 | Yes (85%) |
| San Francisco River | 315 | 85 | 79 | Yes |
| Total | 960 | 219 | 81 |
Table 2: Lengths (in Km) and proportions of Wallow fire-affected perennial streams either within or downstream of the burned area (after Kelly Meyer, 2011).
| Post-Fire water quality levels | Guidelines for Drinking Water Quality | |
| World Health Organization, Y | U.S. Environmental Protection Agency, @ | |
| 2 | 3 | 4 |
| 0.685 mg/L | 0.01 mg/L | 0.01 mg/L |
| 312 mg/L | NI** | 380 mg/L |
| 144 mg/L | 200 mg/L | 380 mg/L |
| 2110 mg/L | 250 mg/L | 250 mg/L* |
| 0.375 mg/L | 2 mg/L | 1.3 mg/L |
| 90 mg/L | 0.3 mg/L | 0.3 mg/L* |
| 0.69 mg/L | 0.010 mg/L | 0.015 mg/L |
| 45 mg/L | 50 /L | 20 mg/L |
| 0.7 mg/L | 0.001 mg/L | 0.002 mg/L |
| 39 mg/L | 0.4 mg/LY | 0.1 mg/L |
| 26 mg/L | 10 mg/LY | 5 mg/L |
| 170 mg/L | 250 mg/L | 250 mg/L |
| 220 mg/L | 50 mg/L | 10 mg/L* |
| 7.4 mg/L | NI | >5 mg/L* |
| 25800 mg/L | 600 mg/L (TDS)*** | 500 mg/L (TDS)* |
| 6970 mS/cm | 250 mS/cm | 1650 mS/cm**** |
| 29°C | NI | 18-20°C (for adult trout & salmon)@ |
| 51000 NTU | <5 NTU | <5 NTU* |
Table 3: Rodeo-Chediski Fire Effects on Water Quality Measured in Salt River at the entrance to Roosevelt Lake, and WHO and U.S. EPA Water Quality Standards.
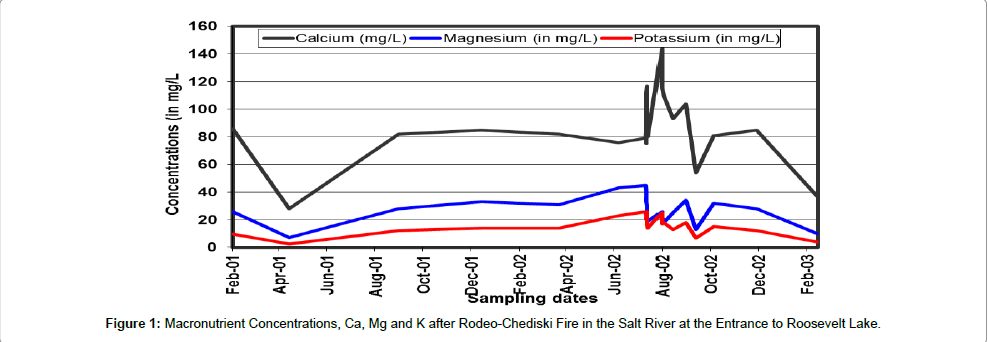
Figure 1: Macronutrient Concentrations, Ca, Mg and K after Rodeo-Chediski Fire in the Salt River at the Entrance to Roosevelt Lake.
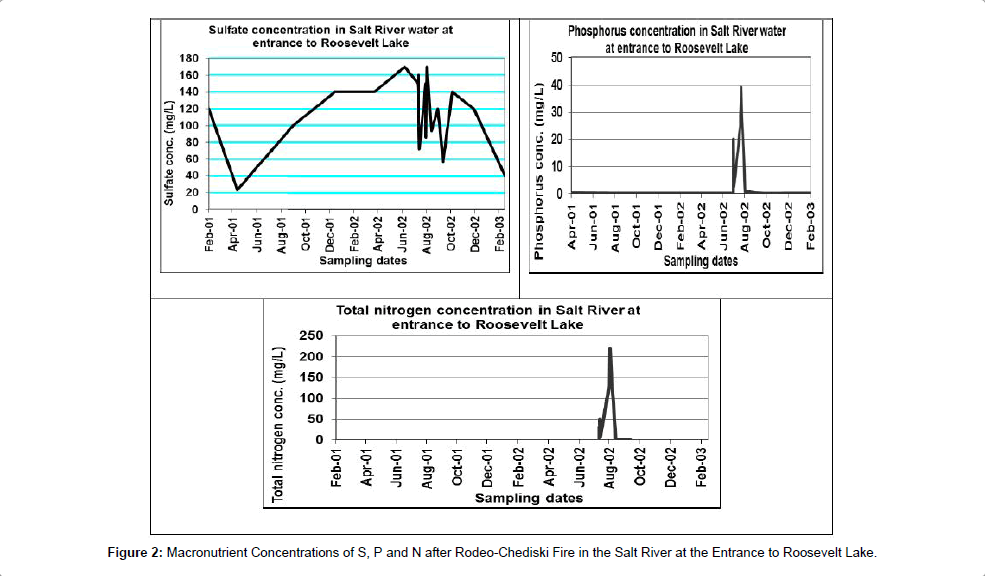
Figure 2: Macronutrient Concentrations of S, P and N after Rodeo-Chediski Fire in the Salt River at the Entrance to Roosevelt Lake.
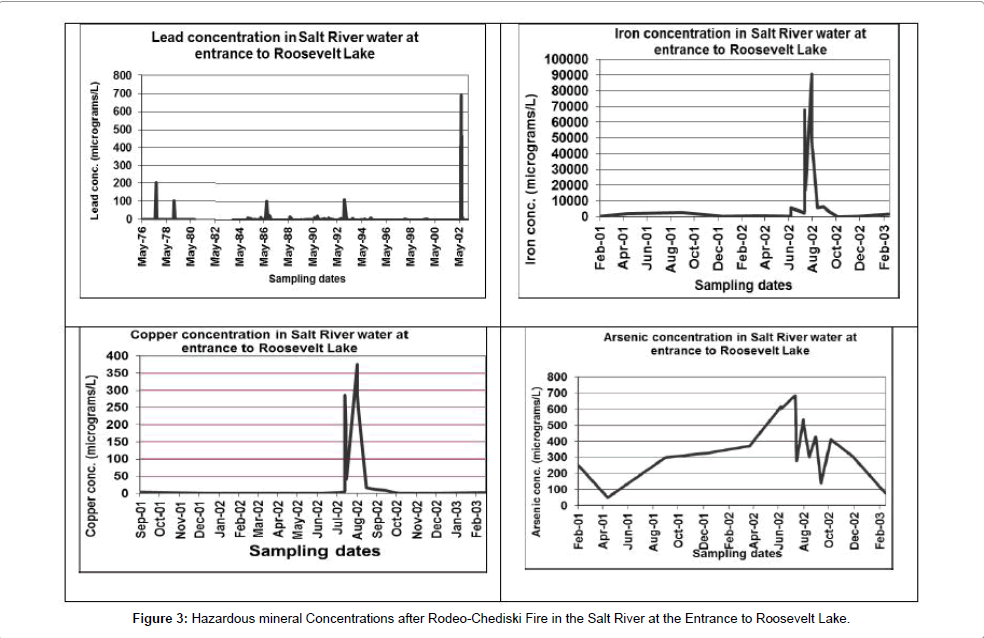
Figure 3: Hazardous mineral Concentrations after Rodeo-Chediski Fire in the Salt River at the Entrance to Roosevelt Lake.
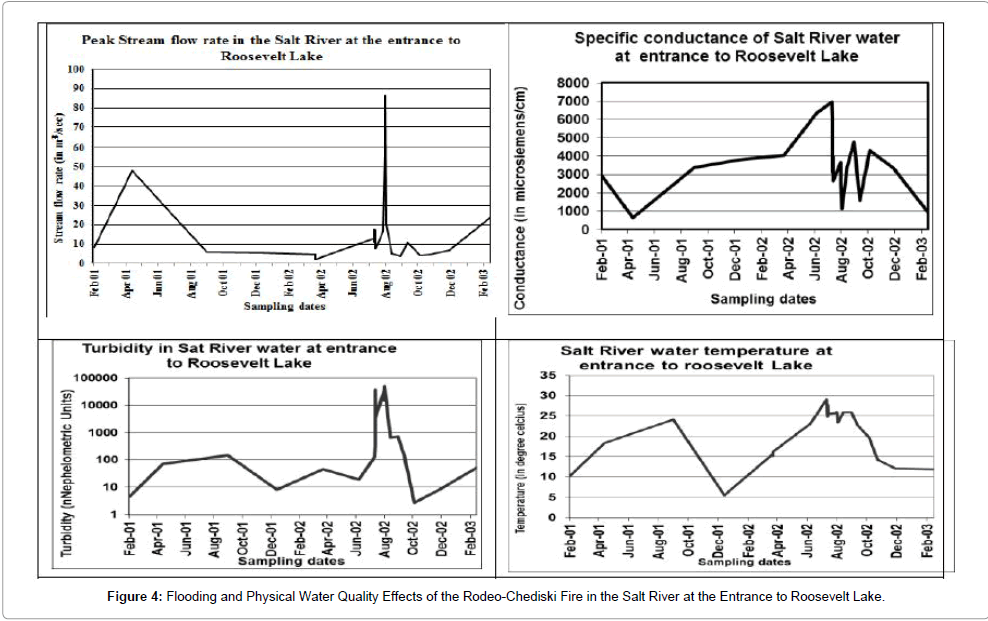
Figure 4: Flooding and Physical Water Quality Effects of the Rodeo-Chediski Fire in the Salt River at the Entrance to Roosevelt Lake.
The impacts of wildfires on peak flow and water quality can vary with location, the size and percentage of the area burned, precipitation regime, and season. Because there are not sufficient amounts of vegetation cover left on the watersheds after wildfire, and also because soils become hydrophobic soon after most forest fires, most precipitation that falls on such areas is readily converted to surface flow, which moves unimpeded downstream with little or no difficult. The flows may be large in amount, have high velocities and force to severely disturb and damage watersheds and stream channels. Also such flows may produce large quantities of sediment, ashes and other chemical contaminants. The consequences are deterioration of downstream ecosystems and adversely affecting the socio-economic and environmental conditions there. Wildfires can also interrupt or terminate nutrient uptake, increase mineralization and lead to mineral weathering. Increased temperatures decrease dissolved oxygen which along with the introduction of nutrients and toxic materials into water bodies can cause eutrophication that destroys and poisons most aquatic organisms in the affected areas. To remedy the problem, it is important that foresters, other land resources managers and interested parties make all efforts to minimize the occurrence of damaging fires. This can be done through forest thinning of the right level [29,30] made utilizing appropriate harvesting methods, or through a carefully designed prescribed fire. To do these successfully forest managers and all interested parties should pay particular attention to the causes for damaging wildfires. The causes may include abundant fuel availability, presence of continuous and/or recurring droughts, other adverse climatic conditions (such as wind speed, low atmospheric moisture and high temperature), and the presence of opportunities for ignition (such as lightening and/or man-induced factors). Then, serious efforts must be made to minimize the effects of such factors. All of these require availability of well-educated and highly insightful decision makers, necessary rules and regulations to serve as guidelines, adequate budget, and a skilled work force to proactively prevent forest fires and control them once they occur. It is important to note that actions that prevent forest fires are more preferred than reactive remediation approaches because restoring burned and/or degraded forested watersheds to predisturbed conditions is more difficult, extremely expensive and takes a very long time to return to undisturbed pre-fire conditions.
Research leading to this paper was partial supported by the combined USDA McIntyre Stennis and Northern Arizona University School of Forestry’s Bureau of Research funding. The authors also appreciate the beneficial comments provided by the two anonymous reviewers of the paper. The quality of paper has been improved significantly in response to their comments.