Journal of Pollution Effects & Control
Open Access
ISSN: 2375-4397
ISSN: 2375-4397
Research Article - (2018) Volume 6, Issue 4
Accepted Date: Jun 06, 2019 /
The present study is conducted using Water Quality Index (WQI) and statistical methods to find out the level of water quality and the deteriorating Water Quality Parameters (WQP) of seven major temple ponds of smart city Bhubaneswar (BBSR). The water samples collected from temple ponds were tested for eleven WQP: pH, Electrical Conductivity (EC), Total Suspended Solid (TSS), Total Dissolved Solids (TDS), Chloride (Cl-), Total Alkalinity (TA), Total Hardness (TH), Sulfate (SO4 2-), Dissolve Oxygen (DO), Biochemical Oxygen Demand (BOD), Chemical Oxygen Demand (COD). Study found that WQI score of all seven temple ponds are higher than 200 mark, indicating poor water quality. However statistical techniques: Standard Deviation (SD) founds that pH water quality parameter has lowest SD value (0.414) and is more reliable. Where as Multiple Linear Regression (MLR) found that WQI is greatly influenced by BOD, EC, TDS, COD. Regression study found that pH (k=4.40868) is a good regressor towards WQI next to DO (k=-18.55146) and BOD (k=11.18007). Pearson’s correlation coefficient (r) value shows that highest significant positive and negative correlation exist among BOD, DO (-0.96) and TH, SO4 2- (0.855) water quality parameters respectively.
Keywords: Water quality standard; Water quality index; Co-relation; Standard deviation; MLR
With the growth of population, commercial and industrial activities, surface water has received large amount of pollutants from variety of sources [1]. Increasing surface water pollution causes not only deterioration of water quality, but also threatens human health, balance of aquatic ecosystem, economic development and social prosperity [2]. About 80% of all the diseases in human beings are caused by contaminated water [3]. In this direction characterization of the WQP is essential and indispensable. This provides an improved understanding of the environmental condition and help policy makers to establish priorities for sustainable water management [4].
Today’s Smart city Bhubaneswar [5], the capital of the Indian state of Odisha, formerly known as Odisha has more than 1000 remarkable ancient temples [6] due to which it is also renowned as Temple City of India. With many Hindu temples and strong believing nature on god large number of vakts have come in contact with temple pond water every day in BBSR. But now these have become the source of infectious disease due to several anthropogenic activities like throwing of temple wastes by sevayats, discharging of waste water through nalas, throwing of wastes from neighbouring people in to these ponds. It is in this apprehension, in this study Standard Deviation (SD), Pearson’s correlation statistical methods and WQI have been employed to extract significant information from physico-chemical datasets and to establish mathematical water quality model and Multiple Linear Regression (MLR) analysis is carried out using Xuru’s website [7]. MLR study examines the relation between a single dependent variable and a set of independent variables to represent the best relation among WQP and to determine the most meaningful parameters responsible for water quality [8-9]. Most importantly this MLR analysis helps policy makers to establish priorities for sustainable water management. On the other hand SD study provides information that which parameter is more reliable [10].
Study Area
The study area includes seven major temple ponds of the smart city BBSR India. The city is located in Khurda district of Orissa state between 20°12’00”N to 20°23’00”N latitude and 85°44’00”E to 85°54’00”E longitude on the western fringe of the coastal plain across the main axis of the Eastern Ghats Mountains [11].
In this study samples were collected from seven sampling sites namely (Temple ponds); Papanasini Kunda (P), Kedargouri temple pond (K), Mausima temple pond (M), Chintamaniswar Pond (C), Devipadahara pond (D), Brahmeswar pond (Br), Bindusagar pond (Bi). Samples were collected as per the norms of the American Public Health Association (APHA) during three different seasons of the year i.e. in premonsoon (summer), monsoon (rainy) and post monsoon (winter) in decontaminated plastic container during morning hours and were analyzed following APHA [12] norms in the laboratory for 11 physico-chemical parameters. All the chemicals used in laboratory analysis were of AR grade.
The obtained data from laboratory analysis of 11 tested WQP of water samples are used for different statistical analysis: correlation, standard deviation, linear regression and MLR. These data are used to find out WQI (equation 1) and to find out the closeness of the relationship among above eleven tested WQP and so also that of with calculated WQI, by using the Karl Pearson Correlation matrix [13] i.e. in equation 2.
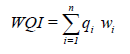 (1)
(1)
n=number of parameters.
qi=the quality rating of parameters.
wi=unit weight of different parameters.
qiwi=parameters sub-index.
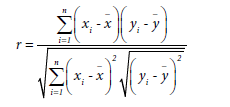 (2)
(2)
Where,
n=number of data points,
x=values of x variable
y=values of y variable
 mean of all variables of 'x'
 mean of all variables of 'y'
r=Pearson Correlation
Subsequently regression analysis is also carried out in between WQI and WQP with the help of Origin software (origin version 6.1). The best reliable WQP is finding out among 11 tested WQP by using standard deviation in equation 3 [14].
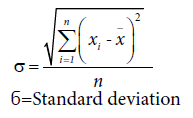 (3)
(3)
xi=Each value of a parameter in the data sheet
 Mean of all values of a parameter in the data sheet
n=Number of values of a parameter in the data sheet
Multiple linear regressions is a statistical tool for understanding between an outcome variable and several predictors (independent variables) that best represent the relationship in a population [15]. Multiple linear regressions is expressed below in the equation 4 [16,17].
Y= βo+β1X1+ β2X2…. +βmXm+Yε (equation-4)
Where,
‘Y’ represent the dependent variable, X1…Xm represent the several independent variables
βo…βm represent the regression coefficient and ‘ε’ represent the random error.
In this paper MLR analysis is carried out to quantify the relationship between several independent or predictor variables and WQI by using Xuru’s Web site for Online Multiple Linear Regression analysis [7].
The results of mean and SD from the present study shown in Table 1 provides a comprehensive picture of the chemical characteristics of the WQP of BBSR temple ponds. The SD value shows that among eleven studied water quality parameter pH, SO4 2-, DO parameter are having lowest SD value of 0.41, 1.75, 1.46 and the average recorded value of these three parameter( pH=7.9, SO4 2-=11.5 mg/L, DO=9.6 mg/L )are well within the limit. It is cleared from Table 1 that the mean value of WQP like EC, BOD, COD are well within the limit. It is cleared from Table 1 that the mean value of WQP like EC, BOD, COD are beyond the permissible limit. The recorded average value of EC is 411 mS/m, BOD is 11.3 mg/L and COD is 66.9 mg/L and the Standard Deviation values are 42.62, 2.24, 9.85 respectively. The recorded mean value of these three parameter are above the the drinking water prescribed limit as per World Health Organization standard [3].This was expected because temple ponds are surrounded by municipal area. Except EC, BOD, COD the mean value of other studied WQP are within the limits which Table 1 indicates. The important physico-chemical characteristics of analyzed water samples are compared with prescibed standards in Table 1 and analyzed data are used to find out Mean, Standard Deviation (Table 1), Correlation coefficient ‘r’ (Table 2) among WQP and regression coefficient ‘k’ shown in Table 3. pH showed significantly negative co-relation with COD (r=-0.693). The present correlation matrix (Table 2) evident that distribution of SO4 2-, TA, TDS, TH are significant and positively correlated with EC with r=0.783, 0.712, 0.673, 0.569 respectively whereas highly negative correlation is observed between EC and Cl- (r=-0.582). Table 2 reflects Cl- is inversely related with almost all WQP except COD (r=0.529). Strongly inverse relation found between Cl- with TA (r=-0.771), with SO4 2- (r=0.739), with TH (r=-0.719). The level of TDS is one of the characteristics, which decides the quality of drinking water. Except EC, TDS is poorly related with rest ten studied WQP. Significant strong relation found between TH with SO4 2- (r=0.855) and TA (r=0.525). The level of BOD highly influence the aquatic biota. BOD shows poor correlation with almost all studied parameter (Table 2) except DO. Strongly negative correlation is obtained between BOD and DO (r =-0.96). Like BOD, fluctuations in DO concentration affects the aquatic biota. The correlation study shows DO has all most poor correlation with studied WQP except BOD. SO4 2- shows significant positive and negative=0.5), TA (r=0.809), Cl- (r=-739). Regression study in Table 3 resulted that WQP pH, DO and BOD are good regressor towards WQI with regression coefficients 4.40868, -18.55, 11.18 respectively (b). MLR analysis is performed to examine the most water quality parameter affecting dependent variables (WQI). MLR study indicates that WQP TA, TH, SO4 2-, DO, BOD, COD are good at predicting WQI (Table 4). The WQI of all samples ranges from 240.4 to 318.56. All temple pond WQI values exceeds the 200 mark which are specified for very poor water quality [18] as in Table 5 and also overall average WQI of temple pond exceeds the 200 mark pointing also very poor water quality (Table 5) for drinking or bathing or for recreational purpose. The study resulted that the higher values of EC, BOD and COD in the water are mainly responsible for high value of WQI. Correlation regression analysis shows a high value of Correlation coefficient (r) and regression coefficient (k) exist between BOD, WQI (r=0.834, k=11.18, positive) and between DO, WQI (r=- 905, k=-18.5514, negative).
| Location | pH | EC | TSS | TDS | Cl- | TA | TH | SO42- | DO | BOD | COD | WQI |
|---|---|---|---|---|---|---|---|---|---|---|---|---|
| P | 8 | 438 | 92 | 284 | 78.5 | 105 | 83 | 10.6 | 7.4 | 15.5 | 64.1 | 318.56 |
| K | 8.2 | 395 | 123 | 258 | 75.4 | 106 | 93 | 12.7 | 11.5 | 9.1 | 55.6 | 240.4 |
| M | 8.3 | 373 | 102 | 236 | 83.4 | 98 | 87 | 9.8 | 7.8 | 13.2 | 67.3 | 311.01 |
| C | 7.8 | 441 | 105 | 255 | 74.5 | 112 | 91 | 13.2 | 9.7 | 11.6 | 60.5 | 266.71 |
| D | 8.4 | 412 | 76 | 276 | 81.6 | 106 | 86 | 12.5 | 10.2 | 9.8 | 58.5 | 256.83 |
| Bi | 7.7 | 479 | 132 | 293 | 79.7 | 108 | 92 | 13.5 | 9.3 | 11.2 | 84.2 | 313.04 |
| Br | 7.1 | 342 | 89 | 261 | 85.2 | 102 | 79 | 8.6 | 11.3 | 8.7 | 78.4 | 257.66 |
| Avg. | 7.9 | 411 | 102.7 | 266.1 | 79.7 | 105.3 | 87 | 11.5 | 9.6 | 11.3 | 66.9 | 280.6 |
| SD | 0.414 | 42.62 | 18.1 | 17.98 | 3.67 | 4.1 | 4.75 | 1.75 | 1.46 | 2.24 | 9.85 | - |
| Standard* | 6.5-8.5 | 300 | 500 | 500 | 250 | 120 | 300 | 150 | 5 | 5 | 10 | - |
| Prescribed Agency | ICMR/BIS | ICMR | WHO | ICMR/BIS | ICMR/BIS | ICMR | ICMR/BIS | ICMR/BIS | ICMR | ICMR | WHO | - |
Table 1: Physicochemical characteristics, SD of BBSR temple pond water in 2014.
| WQP | pH | EC | TSS | TDS | Cl- | TA | TH | SO42- | DO | BOD | COD | WQI |
|---|---|---|---|---|---|---|---|---|---|---|---|---|
| pH | 1 | 0.176 | -0.071 | -0.152 | -0.27 | -0.08 | 0.426 | 0.361 | -0.325 | 0.283 | -0.693 | 0.06 |
| EC | - | 1 | 0.443 | 0.673 | -0.582 | 0.712 | 0.569 | 0.783 | -0.355 | 0.383 | 0.092 | 0.43 |
| TSS | - | - | 1 | 0.102 | -0.462 | 0.276 | 0.76 | 0.499 | 0.083 | -0.061 | 0.288 | 0.163 |
| TDS | - | - | - | 1 | -0.107 | 0.447 | 0.001 | 0.385 | -0.067 | 0.099 | 0.342 | 0.263 |
| CL- | - | - | - | - | 1 | -0.771 | -0.719 | -0.739 | -0.058 | -0.125 | 0.529 | 0.182 |
| TA | - | - | - | - | - | 1 | 0.525 | 0.809 | 0.233 | -0.115 | -0.177 | -0.241 |
| TH | - | - | - | - | - | - | 1 | 0.855 | 0.1007 | -0.094 | -0.242 | -0.079 |
| SO42- | - | - | - | - | - | - | - | 1 | 0.142 | -0.12 | -0.246 | -0.136 |
| DO | - | - | - | - | - | - | - | - | 1 | -0.96 | -0.072 | -0.905 |
| BOD | - | - | - | - | - | - | - | - | - | 1 | -0.045 | 0.834 |
| COD | - | - | - | - | - | - | - | - | - | - | 1 | 0.457 |
| WQI | - | - | - | - | - | - | - | - | - | - | - | 1 |
| Note: Strongly +ve /-ve correlation, r>0.5 | ||||||||||||
Table 2: Corelation study among studied WQP of BBSR temple pond water.
| Regression study of WQI with WQP | |||
|---|---|---|---|
| Regression | R2 | Regression coefficient (k) | Remark |
| WQI=245.65129+4.40868 pH | 0.00367 | 4.40868 | Positively co-related |
| WQI=155.67651+0.30365 EC | 0.1855 | 0.30365 | Positively co-related |
| WQI=252.64632+0.27221 TSS | 0.0268 | 0.27221 | Positively co-related |
| WQI=163.20473+0.44112 TDS | 0.0696 | 0.44112 | Positively co-related |
| WQI=161.79395+1.48967 Cl- | 0.3319 | 1.48967 | Positively co-related |
| WQI=467.0657-1.77099 TA | 0.0582 | -1.77099 | Negatively co-related |
| WQI=324.50511-0.50294 TH | 0.0063 | -0.50294 | Negatively co-related |
| WQI=307.64009-2.33918 SO42- | 0.0185 | -2.33918 | Negatively co-related |
| WQI=458.69984-18.55146 DO | 0.819 | -18.55146 | Negatively co-related |
| WQI=154.27112+11.18007 BOD | 0.6963 | 11.18007 | Positively co-related |
| WQI=187.28754+1.394 COD | 0.2087 | 1.394 | Positively co-related |
Table 3: Regression study of WQI with studied WQP.
| MLR | pH | pH =-4.762663862*10-1BOD-5.754860596*10-2COD-4.655022973*10-3EC-8.691964217*10-1DO+1.301388862*10-2TSS+1.450612417*10-2TDS+22.2249312---(eq-5) |
| DO | DO=-5.616056814*10-1BOD-3.068350716*10-1pH-1.347592188*10-2EC-7.598941172*10-4TSS +1.852258528*10-2TDS-1.589580476*10-1Cl-+ 31.7497252---(eq-6) | |
| BOD | BOD=-0.413872718 Cl--1.662108691*10-1 TA- 2.049250626*10-1 TH+1.975296154*10-1 SO42-1.37497785 DO+2.881728672*10-2 COD+88.68376391---(eq-7) | |
| WQI | WQI=-2.556026982TA-3.490362053*10-1TH+7.326457549SO42--3.329023693 DO+9.482116951 BOD+1.54925014 COD+316.6114168---(eq-8) |
Table 4: MLR study among WQP.
| WQI Score | Water Quality |
|---|---|
| <50 | Excellent water |
| 50-100 | Good water |
| 100-200 | Poor water |
| 200-300 | Very poor water |
| >300 | Water unsuitable for drinking |
Table 5: WQI score and its ranking.
This work reveals that the WQI value of studied temple ponds are well above 250 score which indicates that an increase in pollution level and very poor water quality in these water ponds. This rise in WQI value across all location possibility is due to anthropogenic activity; effluent discharge, domestic waste water discharge from surrounding area, discharges of nalas, urban runoff to temple ponds etc. Thus there by increase in TSS, algal growth, BOD level and decrease in DO level. The water quality parameter pH is reliable parameter among all studied parameter but it is not a strongest regressor to predict WQI. In the correlation regression study, we can conclude that the influence of DO and BOD with WQI is very high. The regression analysis concluded that the regressors DO and BOD are good at predicting the values of WQI. Further from Multiple Linear Regression, it is found that WQI is dependent on water quality parameters of DO, BOD, COD, TA, TH and SO4 2- (Table 4).The study conclude that pH is good at predicting BOD and DO . The MLR study conclude that quality of water is strongly influenced by COD, DO, TH, SO4 2- , Cl-, TA, BOD and are good at predicting WQI.