Journal of Oceanography and Marine Research
Open Access
ISSN: 2572-3103
ISSN: 2572-3103
Research Article - (2017) Volume 5, Issue 2
Side Scan Sonar (SSS) is a sonar system development instrument which has the capability to show the images of the two-dimensional surface of the seabed by contour conditions, topography, and the target simultaneously. The Beam Pattern Discrete–equi-spaced unshaded Line Array Method was used to compute the two-dimensional beam pattern which depends on the angle of the incoming sound waves from the axis of the array were accepted have been depending on the angle at which the sound beam array. This research was conducted in December 2016 in the Punggur Sea, Batam, Riau Islands-Indonesia, and its coordinate system is 104°08,7102 E and 1°03,2448 N until 1°03.3977 N and 104°08,8133 E, using Side Scan Sonar Tow C-Max CM2 fish instruments with a frequency of 325 kHz. The recorded results show that there are 7 targets, and Beam pattern of Discrete-Beam Equi-Spaced unshaded Line Array method in target 4 has the highest value in the directivity pattern is 21.08 dB. The results of the beam pattern model show that neither the central value at the incidence angle (o) of the Directivity Pattern (dB) were not at the 0 (zero) or the beam pattern central have been generated by the target 6 with incident angle -1.5° and 1.5°. And also based on the Discrete-method result Beam Equi-Spaced Unshaded Line Array method was discovered the sunken wreck. In addition, it has declined by 40 dB. The bottom sediment in the Punggur Sea was founded the highly concentrate of the sand.
<Keywords: Side Scan Sonar (SSS); Incidence angle; Directivity pattern
The hydro-acoustic method is a theory of the sound wave propagation in the water medium. This operation was able to detect all of the targets that exist in the water column [1,2]. In addition, it could be used in the exploration of the demersal fish resources as well as detecting the bottom sea. Some of the advantages of this method are the high speed, can be used in deep water and widely, and also safely for the fish resources [3].
The basic principle of the sonar was the sound use to detect or find objects specifically in the sea [4]. Side Scan Sonar (SSS) has been used in the survey for imaging the seabed. The SSS is a sonar development that able to observe and show the two-dimensional surface pictures by the counter of the sea floor, topography, and the target simultaneously. This instrument is able to distinguish the small particles of the seabed structure such as rocks, muds, sand, gravel, or basic types other waters [5]. The SSS is used for a variety of alpacas, such as the detection of the presence of pipelines and submarine cables, detection of the shallow seabed structure, the implementation of the dredging, environmental studies, military history, archeology, fisheries, and mining [6].
Sonar is a general term for any instrument using forremote sound detection of underwater objects [7]. The active sonar system will generate shortly bursts (ping) of the high frequency noise. The acoustic waves were obtained from the transducer in the water column and seabed, and there will be generated echoes measured by the four quadrants in the beam pattern transducer [8]. For mono-static sonar, which has a transmitter and receiver, the results of the transducer directivity illustrate the dependence of backscatter at an angle between the acoustic wave incident and its target [9]. The quantitative interpretation is intended to define the relationship between the position of the ship, tow-fish position and the position of objects in order to obtain the horizontal and vertical scale. The horizontal scale was a position value of the object when the tow-fish trajectory is parallel to the trajectory of the ship. It can be represented by the track and the tow-fish have an angle. The vertical scale includes the object height from the seabed and the depth of the object [10]. Manually, geometry SSS and its calculation is illustrated in Figure 1. This study aims to address the existing problems in Punggur Sea, Batam, and Riau Islands by seabed target identification with instrumental SSS using Discrete Beam Pattern-Equi-Spaced unshaded Line Array and apply the hydro-acoustic method.

Figure 1: The Side Scan Sonar (SSS) geometric.
This research was conducted in December 2016 at the Punggur Sea, Batam, Riau Islands, Indonesia at the coordinate of 104°08.7102 E and 1° to 1° N 03.2448 03.3977 08.8133 N and 104° E (Figure 2). This research has 3 tracks (Figure 3). Acoustic data acquisition was done using a Side Scan C-Max CM2 sonar tow fish instrument and also it was set at a frequency of 325 kHz and with a maximum distance of 200 m and 25 m cable length (Figure 3). This study location can be seen in Figure 2, and also the characteristics of beam pattern C-Max CM2 Side Scan Sonar Tow fish can be seen in Figure 4.

Figure 2: The location of the side scans sonar recording and its observation.

Figure 3: The illustration of the side scan sonar data recording.

Figure 4: The beam pattern C-Max CM2 of the Side Scan Sonar Tow fish characteristic.
The two-dimensional beam pattern
Calculating the two-dimensional beam pattern depends on the angle of the incoming sound waves from the array axis, the received power depends on the angle at which light sound incident to array. We can describe this angular dependence with an equation to relate the actual strength that was accepted for the average time power to the shaft (where, θ=0° and the maximum power is: (a) This ratio is a function of beam pattern two-dimensional array; b (θ). Where:
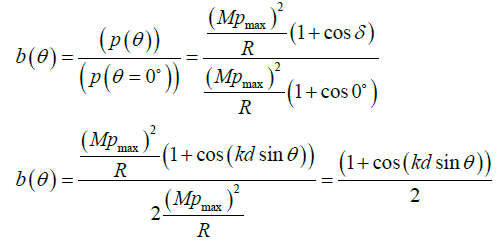 (1)
(1)
Using a geometric identification in the sonar system:
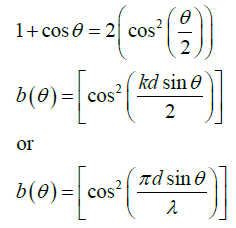 (2)
(2)
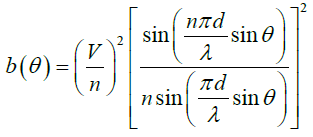 (3)
(3)
Generally, the upper slope of the seafloor will be filled by fine grained sediments and the bottom will be filled by coarse grained sediments. It was caused by the gravity force. However, based on the side scan sonar image can be seen the differences between the texture and roughness clearly on the sediments of sand, biogenic sand and mud. There are 7 targets were detected by recording the image of Side Scan Sonar used C-MAX with an estimation of target detection could be observed the large object by the visual images on the target 6 at coordinates 1°03.3101 N and 104°08.7362 E (Figure 5). These objects can be indicated was a sunken wreck on the seabed of Punggur sea, Batam, Riau Islands, Indonesia. The result of the time acquisition, ping position, gaind and elevation of the SSS recording can be seen in Table 1. In addition, Figure 6 shows the image result of the seabed.

Figure 5: The classification of the seafloor sediments in the Punggur Sea.

Figure 6: The beam pattern discrete-equi-spaced unshaded line array.
| Target | Time | Latitude | Longitude | Ping | Gain (dB) | Altitude (m) |
|---|---|---|---|---|---|---|
| 1 | 13:43:12 AM | 1°03.2448 N | 104°08.7102 E | 417 | 3 | 13.8 |
| 2 | 13:43:20 AM | 1°03.2109 N | 104°08.8057 E | 458 | 1 | 14.5 |
| 3 | 13:44:05 AM | 1°03.2992 N | 104°08.7471 E | 678 | 4 | 14.5 |
| 4 | 13:42:56 AM | 1°03.2207 N | 104°08.7180 E | 339 | 5 | 17.8 |
| 5 | 13:44:57 AM | 1°03.3977 N | 104°08.8133 E | 931 | 2 | 13.8 |
| 6 | 13:44:11 AM | 1°03.3101 N | 104°08.7362 E | 705 | 6 | 18.1 |
| 7 | 13:42:53 AM | 1°03.1832 N | 104°08.7875 E | 331 | 3 | 14.8 |
Table 1: Targets, times, positions, pings, gains, and heights.
There are several lines on the sediment image. Its indication was caused by the influence of the boat and tow vehicle movements so that disrupt the appearance of the image (Figure 7). The physical characteristic of the Punggur Sea was having the dynamical current sea. This causes movement of the tow vehicle more difficult to control. Based on data from the movement of side scan sonar was founded the sensor pitch movements until 15 degrees from a standstill 0 degrees roll movements occur up to 10 degrees from its position as well as 0 degrees.

Figure 7: The target positions and the seafloor image by SSS.
Figure 7 shows the image of seafloor sediments with the 7 targets. The target of 6 was the object of the sunken ship on the seafloor, while sand object can be seen clearly. The ship object was founded at the coordinate of 1°03.3101 N and 104°08.7362 E. On the port (right side) was seen the lighter entrenchment. Their excavation led to differences in texture, roughness and slope of the seafloor sediments. Furthermore, the excavation that occurred on the seabed was indicated causing the larger particle sediments was lifted up. According to Urick [11], grain size, sediment surface roughness scale and significant slope variations could be important role in the acoustic response. Minarto et al. [12] stated that swift currents would precipitate coarse grain sediments and the weak current would precipitate the fine-grained sediments. However, the seafloor condition will affect the location of the sediment. According to Kenny et al.; Jain and Makris; Lubis et al. [13-15] a sweep of side scan sonar can produce mosaics, geological and sedimentology features that are easily to observe and interpreted qualitatively so could provide the information about the dynamics of the ocean floor.
Figure 8 shows the target amount as well as 7 targets on Beam pattern of Discrete-Equi-Spaced Line Array unshaded method, the target of 4 has the highest value at 21.08 dB of its directivity Pattern was shown in light blue. By looking at the center of the model beam pattern result, the target of 6 has a central value of the incidence angle (o) of the directivity pattern (dB) are not in a value of 0 or at the center of the resulting beam pattern. On target of 6 there is a value of incident angle -1.5° and 1.5° has decreased to -40 dB [16]. This relation can be seen to the value of altitude (m) which is 18.1 m and a gain of 6 dB which allegedly was the object of the shipwreck on the seabed. On the target of 4 has the values of incident angle -1.32° and 1.32° and also decreased up to -50 dB. The de-convolution of this method result shows the beam pattern which was still concentrated by touching the second quadrant of the existing signal, these results provide a similar pattern the beam and a beam generated by looking at the value of the wavelength and frequency is generated [14]. This can be seen in relation to the value of altitude (m) which is worth 17.8 and gain value of 5 dB which is the object of the shipwreck on the seabed allegedly.

Figure 8: The beam pattern incidence angle (o) of the directivity pattern (dB) and Beam pattern.
The research in Punggur sea, Batam using the C-Max CM2 Side Scan Sonar Tow fish at a frequency of 325 kHz, was obtained seabed sediments more sand and found many of the target value gain and high altitude. The result of the Side Scan Sonar (SSS) image recorded have identified seven targets, while the target of 4 and 6 based on the Discrete-Equi-Spaced unshaded Line Array method was discovered the sunken wreck. There was a perpendicular relationship between the incident angle (o), directivity pattern (dB), Altitude (m), and a gain value (dB). The Discrete-Equi-Spaced unshaded Line Array was a method which can be used to identify the targets on the seabed.
The authors gratefully acknowledge to the State Polytechnic of Batam, Marine Instrument and Application Club (MIAC), and Hydronav Tehnikatama Indonesia since helped and guided us so we had finished our research.