Journal of Clinical and Cellular Immunology
Open Access
ISSN: 2155-9899
ISSN: 2155-9899
Research Article - (2014) Volume 5, Issue 1
Objective: Monocyte chemoattractant protein-1 (MCP-1) is reported to be associated with lupus nephritis (LN) activity. We therefore investigated urinary MCP-1 (uMCP-1) in patients with biopsy proven LN.
Methods: This was a cross-sectional observational study in which uMCP-1 levels and the standard parameters of LN activity were measured in these patients.
Results: One hundred patients were recruited: 47 with active and 53 inactive LN. uMCP-1 levels were increased in those with active LN [9,317.5 pg/mg creatinine (5,48.3-40,170)] compared to those with inactive LN [3,682 pg/ mg creatinine (0-23,866)] (p<0.001). uMCP-1 correlated with proteinuria (r=0.39, p=0.001), serum albumin (r=-0.35, p=0.001) and SLEDAI-2K (renal) (r=0.39, p=0.001). Area under receiver operating characteristic (AUROC) curve for uMCP-1 was 0.82 (p=0.001) compared with 0.50 (p=0.95), 0.37 (p=0.50), 0.43 (p=0.26) for anti-ds-DNA Ab, C3 and C4 respectively. AUROC for proteinuria was 0.94 (p<0.001) and for SLEDAI-2K (renal) was 0.96 (p<0.001). Only proteinuria and SLEDAI-2K (renal) were independent predictors of LN activity.
Conclusions: uMCP-1 may provide further adjunctive evidence if the clinical diagnosis of LN activity remains uncertain and facilitate improved grading of renal disease activity in this complex disease thus leading to improved treatment and outcome. Serial measurements of uMCP-1 are indicated.
Keywords: Lupus nephritis (LN), Urinary monocyte chemoattractant protein-1 (uMCP-1), Biomarker, Renal flare
Lupus nephritis (LN) is a frequent and serious complication of Systemic Lupus Erythematosus (SLE) and is associated with considerable morbidity and mortality [1,2]. The disease course is characterized by unpredictable flares.
The conventional laboratory markers used in clinical practice such as serum complement levels and double-stranded DNA antibodies are unreliable indicators of LN as they lack both sensitivity and specificity for prediction of active or relapsing LN. Moreover, serum creatinine is also unsatisfactory as a marker as significant renal damage can occur before it rises [3]. Other laboratory tests such as proteinuria and urinary sediments are also non-specific markers [4].
Renal biopsy remains the gold standard for the evaluation of LN disease activity. However, it is an invasive procedure and serial renal biopsies are not appropriate in clinical practice. Hence, it is very important to identify noninvasive new biomarkers that are able to predict renal flares and/or reflect its activity. These biomarkers could then be followed serially and would enable timely institution of appropriate treatment before the development of significant inflammatory injury in the kidney. Early treatment may also lead to early and more complete remission and less chronic kidney damage [5,6] as well as decrease the patient’s total exposure to immunosuppressive medications and their toxicities. Evidence in human and animal studies have demonstrated the pathogenic role of MCP-1 in renal injury in LN [7,8].
Several studies in LN patients have shown that uMCP-1 to be associated with LN [9] and its severity [10] and flares [11].
We therefore investigated the usefulness of uMCP-1 levels as a marker of LN activity in SLE patients with biopsy proven LN.
This was a cross-sectional study which recruited consecutive SLE patients with biopsy proven LN [12] attending the Nephrology /SLE Clinic at our centre. This study was carried out between 9 December 2011 and 4 August 2012. We excluded those patients with end stage renal disease (ESRD) or had undergone renal transplantation, pregnant patients, patients in whom a renal biopsy could not be performed and those unable to give consent eg. due to cerebral lupus. The patients were divided into two groups based on the presence or absence of LN activity. Patients with relapse/ flare of LN were included in the active group.
Ethical aspects
This study was approved by the Medical Research and Ethics Committee of the Universiti Kebangsaan Malaysia Medical Centre (UKMMC). Informed consent was taken from all participating subjects.
SLE disease activity index assessment
Lupus disease activity was assessed by the various components of the SLE Disease Activity Index (SLEDAI-2K) [13] comprising global (score range 0-150), extrarenal (score range 0-63) and renal (score range 0-16). The renal score was based on the presence of any of the following abnormal parameters in the urinalysis in the absence of stones, urinary tract infection or other causes: haematuria (≥5 red blood cells/ high power field (HPF), leukocyturia (≥5 leukocytes/ HPF) and urinary casts (granular or red blood cell casts) [14].
Definition of LN activity
A. Active LN was defined by the presence of one or more of the following criteria:
I. Proteinuria with or without any of the following features [15].
a) Presence of haematuria and/or red cell casts
b) Increase in serum creatinine or decline in eGFR
Proteinuria was measured as spot morning urine protein creatinine index (uPCI) and was positive if the value was >1000 mg /mmol (NR ≤ 200).
II. Renal SLEDAI score ≥ 4 [13].
B. Relapse/ flare of LN was defined as recurrence of renal disease activity after a period of remission ≥ 3 months for the purpose of this study [15].
C. Remission was defined as absence or reduction of renal disease activity and no change in immunosuppressive therapy for at least 3 months [15].
D. Inactive LN was defined by the presence of one or more of the following criteria:
I. Proteinuria (uPCI)<500 mg/ mmol with/ without any of the following features:
a) Serum albumin ≥ 35 g/L
b) Inactive urine sediments (<5 red cells/HPF and no red cell casts and no leucocyturia (<5 white cells/HPF)
c) Stable serum creatinine (unless due to other etiology eg. reninangiotension system (RAS) blockade) [15]
II. Renal SLEDAI score 0 or<4
Clinical and laboratory measurements
Each patient was evaluated using clinical and laboratory parameters. The latter included full blood count, renal function test, eGFR using the Modification of Diet in Renal Disease (MDRD) formula, urine analysis by dipstick, urine microscopy, urine protein creatinine index (uPCI), erythrocyte sedimentation rate (ESR), serum complement levels C3 and C4 and anti-ds DNA antibody titres. Fresh urine samples obtained for uMCP-1 testing were immediately centrifuged to remove sediments and then frozen in aliquots at -80°C for uMCP-1 testing as a batch.
Urine MCP-1 measurement
The levels of uMCP-1 were measured by specific enzyme-linked immunoassay (ELISA) kits (Minneapolis, Minn, USA, R&D Systems). Briefly, urine samples were diluted according to the manufacturer’s directions. Standard or test samples were added to each well and left to incubate for 2 hours at room temperature. Conjugate was added after washing the plates to remove any unbound substances then was incubated for an hour. Substrate solution was next added after washing the plates. Stop solution was added after incubation for 20 min at room temperature. Finally, the absorbance was read at 450 nm with the correction wavelength set at 540 nm. All samples were assayed in duplicate. uMCP-1 levels were expressed as concentrations normalized for urine creatinine and presented as picograms per milligram creatinine (pg/mg).
Sample size calculation
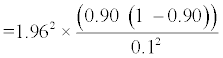
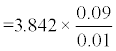
The sample size was calculated using the formula advocated by Jones et al. [16]:
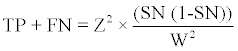
TP=True positive
FN=False negative
z2=A number relating to degree of confidence, for 95% confidence the value was 1.96.
SN=Expected level of sensitivity of urinary MCP-1 for early detection of LN flare in this study.
W=Confidence interval for sensitivity.
For purposes of calculation W was set at 0.1.
The power of the study was set at 80%.
Based on the criteria above, the required number of patients for the study was 93 patients.
However, 100 patients completed the study.
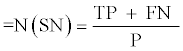
P=Expected prevelance of LN flare in this study (37%)
LN flare ranging in different studies from 27% to 66% [17].

=93
Statistical analysis
Kolmogorov-Smirnov test was used to determine the normal distribution for each variable. Normally distributed variables were presented as mean ± standard deviation (SD) while non- normally distributed data were presented as median ± interquartile range (IQR). The Pearson’s chi-square test (χ2) test was used to compare categorical variables; the two-sided independent-sample t test was used for comparison of means whereas the non-parametric Mann-Whitney U test and Kruskal-Wallis test were used for non-normally distributed variables. Correlation between uMCP-1 levels with relevant laboratory parameters were assessed using Spearman’s correlation coefficients. Receiver operating characteristic (ROC) curves were generated and the area under the curve (AUC) was used to measure the discriminatory capacity of uMCP-1 levels for identification of LN activity. The AUC for uMCP-1 was compared with those of the standard markers of LN activity. The best cut-off value for uMCP-1 was calculated on the basis of maximization of the Youden index (sensitivity+specificity − 1) [18]. Multivariate analysis was performed by means of binary logistic regression to evaluate the independent predictors of LN activity. uMCP-1 and all relevant standard markers of LN activity with a p<0.05 were included in the regression model. The SPSS software version 18.0 was used for statistical analysis. Probability (p) values of<0.05 were considered significant.
Demographic and clinical characteristics of the study patients
One hundred patients with SLE and biopsy proven LN were recruited. Their baseline clinical characteristics are listed in Table 1. There were 47 patients with active LN and 53 with inactive LN. There were no differences in their demographic, LN duration, renal biopsy classes and pathologic scores as well as CKD stages.
| Parameters | All subjects n=100 | Active LN n=47 | Inactive LN n=53 | p value |
|---|---|---|---|---|
| Female, no. (%) | 92 (92) | 43 (91.5) | 49 (92.5) | 0.57 |
| Male, no. (%) | 8 (8) | 4 (8.5) | 4 (7.5) | |
| Race, no. (%) | ||||
| -Malay | 41(41) | 24 (51.1) | 17 (32.1) | 0.14 |
| -Chinese | 55 (55) | 21 (44.7) | 34 (64.2) | |
| -Indian | 4 (4) | 2 (4.3) | 2 (3.8) | |
| Age, mean ± SD years | 36.90 ± 10.62 | 36.40 ± 9.97 | 37.33 ± 11.24 | 0.74 |
| LN duration (years) | 7 (1-24) | 7 (1-24) | 7 (1-17) | 0.56 |
| Median (IQR) | ||||
| Biopsy-proven LN, no. (%) | ||||
| - WHO class I | 1 (1) | 1 (2.1) | 0 (0) | |
| - WHO class II ± V | 6 (6) | 3 (6.4) | 3 (5.7) | |
| - WHO class III ± V | 34 (34) | 15 (31.9) | 19 (35.8) | |
| - WHO class IV ± V | 52 (52) | 26 (55.3) | 26 (49.1) | |
| - WHO class V | 5 (5) | 1 (2.1) | 4 (7.5) | 0.71 |
| - WHO class VI | 2 (2) | 1 (2.1) | 1 (1.9) | |
| Activity index median (IQR) | 8 (0-19) | 9 (0-16) | 8 (0-19) | 0.93 |
| Chronicity index median (IQR) | 3 (0-15) | 3.58 (0-9) | 3 (1-15) | 0..55 |
| CKD stage | ||||
| -Stage 1 (eGFR >90) | 61 (61) | 25 (53.2) | 36 (67.9) | |
| -Stage 2 (eGFR 60-89) | 22 (22) | 10 (21.3) | 12 (22.6) | 0.06 |
| -Stage 3 (eGFR30-59) | 14 (14) | 9 (19.1) | 5 (9.4) | |
| -Stage 4 (eGFR15-29) | 3 (3) | 3 (6.4) | 0 (0%) |
Table 1: Demographic and clinical characteristics of study patients.
Comparison between patient groups
Patients with active LN had lower serum albumin, higher proteinuria, and uMCP-1 levels, higher scores for SLEDAI-2K (global) and SLEDAI-2K (renal). There were no differences between the groups with regards the use of corticosteroids, hydroxychloroquine, renin angiotensin system (RAS) blockers (ACE-inhibitors and/or ARBs and/ or spironolactone). However, there was a difference with regards the use of immunosuppressive medications between the two groups viz cyclophosphamide (p=0.002), cyclosporine or tacrolimus (p=0.03) and azathioprine (p=0.04). Detailed comparisons between both groups are shown in Table 2.
| Parameters | Active LN n=47 | Inactive LN n=53 | p value |
|---|---|---|---|
| Haemoglobin (NR14.0-17.0 g/dL) | 12.2 (8.6-16.6) | 12.3 (8.5-15.6) | 0.57 |
| Total WBC (NR 4.0-10.0 × 10⁹/L) | 7.7 ± 3.6 | 7.1 ± 2.65 | 0.45 |
| Platelet count (NR 150-400) | 234 ± 112 | 256 ± 83.5 | 0.19 |
| Serum albumin (NR 35-50 g/L) | 37.78 ± 5.54 | 41.88 ± 3.59 | <0.001 |
| Serum creatinine (NR 44-80 μmol/L) | 69 (33-252) | 63 (41-158) | 0.29 |
| eGFR (ml/min/1.73 m2) | 93.61 ± 46.01 | 99.75 ± 31.54 | 0.43 |
| uPCI (NR<200 mg/mmol) | 1100 (100-5100) | 200 (100-500) | <0.001 |
| uMCP-1 ( (pg/mg creatinine) | 9317.5 (548.3-40170) | 3682 (0-23.86) | <0.001 |
| Serum C3 (NR 79-152 mg/dL) | 100.5 ± 36.39 | 109.62 ± 39.94 | 0.24 |
| Serum C4 (NR 16-38 mg/dL) | 21.46 ±12.82 | 22.94 ± 11 | 0.54 |
| Anti dsDNA Ab titres (NR<30 IU) | 35.18 (1.73-195.97) | 24.24 (0.81- 279.21) | 0.84 |
| SLEDAI-2K (global: 0-105) | 8 (0-18) | 2 (0-10) | <0.001 |
| SLEDAI-2K (renal: 0-16) | 4 (0-16) | 0 (0-3.5) | <0.001 |
| SLEDAI-2K (extra-renal: 0-89) | 2 (0-10) | 2 (0-10) | 0.66 |
| Medications, no. (%) | |||
| - Prednisolone | 43 (91.5) | 52 (98.1) | 0.12 |
| - Cyclophosphamide | 8 (17) | 0 (0) | 0.002 |
| - Mychophenolic acid | 12 (25.5) | 10 (18.9) | 0.42 |
| - Cyclosporine/Tacrolimus | 19 (40.4) | 11 (20.8) | 0.03 |
| - Azathioprine | 12 (25.5) | 24 (45.3) | 0.04 |
| - Hydroxychloroquine | 20 (42.6) | 22 (41.5) | 0.91 |
| - Renin Angiotension System Blockers (ACEI/ARB/Spironolactone) | 29 (61.7) | 39 (73.6) | 0.11 |
Table 2: Comparison between patients with and without active LN.
Urinary MCP-1 levels and correlation with clinical and laboratory parameters
SLE patients with active LN had significantly higher uMCP- 1 [9,317.5 pg/ mg creatinine, IQR (548.3-40,170)] than those with inactive LN [3,682 pg/ mg creatinine, IQR (0-23,866)] (p<0.001) as illustrated in Figure 1.

Figure 1: uMCP-1 levels in patients with and without active lupus nephritis (LN). The horizontal line across the boxes represent the median value of uMCP-1 levels among patient groups: the areas between the upper and lower limits of boxes represent the interquartile range; the vertical lines protruding from the box represent the maximum and minimum values of uMCP-1 levels respectively. uMCP-1 levels were significantly higher in patients with active LN compared to those with inactive LN (p=0.001).
There were no associations between uMCP-1 levels and use of steroids, renin angiotension system blockers (ACEI / ARB/ Spironolactone) or immunosuppressive medications other than for intravenous cyclophosphamide. uMCP-1 levels were higher in patients treated with cyclophosphamide [11,677.2 pg/mg creatinine (IQR 3,578-36,826)] compared with those who were not [5,292 pg/mg creatinine (IQR 0-4,0170) (p=0.03)]. Details of LN related medications are presented in Table 2.
uMCP-1 correlated directly with uPCI (r=0.39, p=0.001), SLEDAI- 2K (global) (r=0.28, p=0.006) (Figure 2a) and SLEDAI-2K (renal) (r=0.39, p=0.001) (Figure 2b) and inversely with serum albumin (r=- 0.35, p=0.001). Details of associations between and various laboratory parameters are presented in Table 3.

Figure 2: The correlation between uMCP-1 levels and SLEDAI-2K global and renal scores. A. Positive correlation between uMCP-1 and SLEDAI-2K (global) (r=0.28, p=0.006). B. Positive correlation between uMCP-1 and SLEDAI-2K (renal) (r=0.39, p=0.001).
| Spearman’s rho variable | r | p value |
|---|---|---|
| Haemoglobin | -0.11 | 0.25 |
| White blood cells | -0.06 | 0.56 |
| Platelets | 0.05 | 0.57 |
| Serum albumin | -0.35 | 0.001 |
| Serum creatinine | 0.09 | 0.38 |
| eGFR | -0.10 | 0.30 |
| C3 (mg/dl) | -0.09 | 0.34 |
| C4 (mg/dl) | 0.02 | 0.80 |
| Anti dsDNA Ab titres (IU) | -0.04 | 0.64 |
| Urine protein creatinine index (uPCI) | 0.39 | 0.001 |
| Leucocyturia | 0.26 | 0.008 |
| Haematuria | 0.13 | 0.18 |
| SLEDAI-2K global score | 0.28 | 0.006 |
| SLEDAI-2K renal score | 0.39 | 0.001 |
| SLEDAI-2K-extra renal score | -0.08 | 0.42 |
Table 3: Association between uMCP-1 and laboratory parameters.
Diagnostic performance of uMCP-1 in LN
To assess the potential diagnostic values of uMCP-1 in comparison to the standard markers for the identification of SLE patients with active LN, a ROC curve was constructed. At a cut off of 4,247 pg/mg creatinine with a maximum Youden index of 0.48, the sensitivity of uMCP-1 for early diagnosis of active LN was 0.87 with a specificity of 0.61. The area under the curve (AUC) was 0.82 (95% CI: 0.73-0.91: p=0.001). In comparison, the AUC for anti dsDNA Ab titres was 0.50 (95% CI: 0.37-0.63: p=0.95) and those for serum C3 and serum C4 were 0.37 (95% CI: 0.25-0.50: p=0.50) and 0.43 (95% CI: 0.30-0.56: p=0.26) respectively (Figure 3).

Figure 3: Receiver operating characteristic curves (ROC) of uMCP-1 and serological markers for the diagnosis of LN activity in SLE patients. The AUC was 0.82 (95% CI: 0.73-0.91: p=0.001), the symbol (+) represents the best cut-off value (4,247 pg/mL) with a sensitivity and a specificity of 0.87 and 0.61 respectively. The AUC for anti dsDNA Ab titres was 0.50 (p=0.95) and that for serum C3 and serum C4 were 0.37 (p=0.50) and 0.43 (p=0.26). These later were lower than that for uMCP-1.
The AUC for proteinuria (uPCI) was 0.94, (95% CI: 0.89-0.98: p=0.95: p<0.001) and that for SLEDAI-2K renal score were 0.96 (95% CI: 0.71-0.90: p<0.001) (Figure 4A). The AUCs for haematuria, leucocyturia were 0.72 (95% CI: 0.60-0.84: p=0.001) and 0.65 (95% CI: 0.52-0.77: p=0.23) respectively.

Figure 4: Receiver operating characteristic curve (ROC) of uMCP-1 compared with standard parameters for LN activity. A. uMCP-1 compared with urinary parameters and SLEDAI-2K (renal). B) uMCP-1 compared with blood parameters and eGFR. The black solid curve in Figure A and B represents the uMCP-1; the area under the curve (AUC) was 0.82 (p=0.001). The AUC for proteinuria was 0.94 (p<0.001) and those for haematuria and leucocyturia were 0.72 (p=0.001) and 0.65 (p=0.23) respectively. The AUC for SLEDAI-2K was 0.96 (p<0.001). The AUC for serum albumin was 0.24 (p=0.001) and that for serum creatinine was 0.58 (p=0.21). The AUC for eGFR was 0.41 (p=0.21). Thus, uMCP-1 was better than haematuria, leucocyturia serum albumin, serum creatinine and eGFR but was not as good as proteinuria (uPCI) and SLEDAI-2K renal score for detection of LN activity.
The AUC for serum albumin was 0.25 (95% CI: 0.13-0.35: p=0.001), that for serum creatinine was 0.58 (95% CI: 0.44-0.71: p=0.95: p=0.21) and that for eGFR was 0.41 (95% CI: 0.28-0.55: p=0.21) (Figure 4B).
The AUC for uMCP-1 was higher than that for anti dsDNA Ab titres, C3, C4, serum albumin, serum creatinine, eGFR, haematuria and leucocyturia for detection of LN activity. Whereas it was lower than these for proteinuria (uPCI) and SLEDAI-2K renal score.
Thus, uMCP-1 was superior to the serological and usual biochemical markers but was not as good as proteinuria (uPCI) and SLEDAI-2K renal score for detection of LN activity.
Independent predictors of LN activity
Binary logistic regression was performed to assess the independent predictors for LN activity. uMCP-1 and all variables clinically relevant to LN activity with a p value ≤ 0.05 (Table 2) were entered in the regression model. These included serum albumin, proteinuria (uPCI) and SLEDAI-2K.
Only proteinuria (odds ratio (OR)=9.76, 95% CI, 0.32-99.67, p=0.03) and SLEDAI-2K renal score (OR=3.62, 95% CI, 1.82-7.22, p=0.001) were independent predictors of LN activity (Table 4).
| 95% CI for EXP(B) | ||||||
|---|---|---|---|---|---|---|
| B | S.E | p | OR | Lower | Upper | |
| uMCP-1 | 0.009 | 0.006 | 0.48 | 1.009 | 0.99 | 1.02 |
| Serum albumin | -0.12 | 0.17 | 0.50 | 0.89 | 0.63 | 1.24 |
| Proteinuria (uPCI) | 73.64 | 35.22 | 0.03 | 9.67 | 0.32 | 99.67 |
| SLEDAI-2K (renal score) | 1.28 | 0.35 | 0.001 | 3.62 | 1.82 | 7.22 |
Table 4: Logistic regression models for predictors of LN activity.
Renal involvement in SLE contributes significantly to patient morbidity and mortality [19]. Hence, it is essential to find a noninvasive biomarker that could be used for the monitoring of LN disease activity as well as early diagnosis of flares [20]. In this cross-sectional study of 100 patients with LN, we evaluated the role of uMCP-1 levels as a noninvasive biomarker for LN activity and investigated its correlations with current standard laboratory markers and disease activity indices.
MCP-1 is a chemotactic cytokine that is expressed by various renal cells in response to stimulation with proinflammatory cytokines and immune complexes (IC) [21]. This in turn leads to mononuclear cell infiltration of the kidneys in LN. These renal cells include the glomerular endothelial, mesangial as well as tubular epithelial cells.
Many studies have demonstrated the role of MCP-1 in the pathogenesis and progression of glomerular and tubulointerstitial injury in both murine and human LN [22-24]. Tesch et al. [25] reported that MRL/lpr mice with MCP-1-deficiency exhibit prolonged survival when compared to MCP-1+/+MRL/lpr mice as they lack renal macrophages such that T cell infiltration does not occur in response to renal injury and are thus protected from renal damage. Furthermore, glomerular and interstitial inflammation as well as kidney damage were all markedly reduced in these mice after the injection of pharmacologic blockade of MCP-1 [26].
In patients with LN, the presence of MCP-1 in the urine indicates its intrarenal expression [10,27,28] and this correlated significantly with the degree of leukocyte infiltration in the kidneys [28]. In follow up studies, uMCP-1 levels were also found to be increased in patients with active LN and reduced with treatment-induced disease remission [10,29-32].
It appears that uMCP 1 may be a useful clinical marker for predicting and monitoring LN activity. Singh et al. [33] in a longitudinal study (20 patients) reported that uMCP-1 can distinguish between those patients with active LN from those with inactive renal disease or stable SLE.
Our study (n=100) also demonstrated that uMCP-1 levels were significantly elevated in patients with active LN compared to those with inactive renal disease. uMCP-1 levels also correlated directly with proteinuria and inversely with serum albumin. These findings corroborate with those reported by Tucci et al. [27], Chan et al. [34] and Alzawawy et al. [35]. The two latter authors also observed the same significant correlation between uMCP-1 levels and proteinuria. Whereas Noris et al. [28] did not find this relationship.
In a recent report of LN patients (n=83) with juvenile onset of SLE, Watson et al. [36] also found that uMCP-1 levels were higher in those patients with active renal disease. Like us, they found no association between uMCP-1 levels and serum creatinine or eGFR. On the other hand, other studies [27,34,37,38] have reported that uMCP-1 levels were associated with serum creatinine. These findings were also demonstrated by Rovin et al. [11] in a longitudinal study of 89 patients with SLE.
Our findings of a high correlation between uMCP-1 with global SLEDAI-2K and renal SLEDAI-2K scores had previously been reported by many authors. These include Rovin et al. [11], Chan et al. [34], Elshehaby et al. [37] and Rosa et al. [38].
Due to the lag time between the urine samples obtained for uMCP- 1 assays and renal biopsies, we were not able to correlate this biomarker with LN classes as the histological features of LN would have changed with time and treatment.
There were no associations between the third and fourth components of serum complement (C3, C4) and anti dsDNA antibody titres with uMCP-1 levels. These findings concur with those reported by Watson et al. [36]. On the other hand, El-shehaby et al. [37] noted that uMCP-1 levels were associated with serum complements C3 and C4. Whereas Chan et al. [34] demonstrated a significant correlation between urinary mRNA expression of MCP-1 with SLE disease activity indices and anti dsDNA antibody titres in patients with active LN during treatment with immunosuppressive medications. Similary, Kiani et al. [39] in a longitudinal study of SLE patients (n=87) found a significant correlation between uMCP-1 levels with anti dsDNA positivity.
Contrary to all the above, Tucci et al. [27] found the uMCP-1 levels to be decreased in his cohort of LN patients during treatment with IV Cyclophosphamide. In our study, uMCP-1 levels were higher in those patients who received treatment with IV cyclophosphamide than those who did not. This can be explained by the fact that those patients who were treated by IV cyclophosphamide (n=8) had severe SLE/LN and were in the early stages of their treatment. Here, the high uMCP-1 levels most likely reflected the activity and severity of their LN. Their high uMCP-1 levels also correlated with persistently high proteinuria. Both parameters may indicate ongoing kidney inflammation which in turn may lead to adverse renal outcome. Although there were significant associations between the use of calcineurin inhibitor and azathioprine with LN disease activity, uMCP-1 levels did not differ with the use of these immunosuppressive medications. On the other hand, uMCP-1 levels were not related to the use of corticosteroids or rennin angiotension system (RAS) blockers. Rovin et al. [11] also found that uMCP-1 levels were not related to the cumulative dose of steroids or immunosuppressive medications neither received within 30 days preceding a renal flare nor were the uMCP-1 levels related to the use of RAS blockers. Whereas Wada et al. [10] reported that uMCP-1 levels decreased after commencing high dose corticosteroid therapy in LN patients particularly in those with LN Class IVb.
The role of anti dsDNA Ab titres and serum complement levels in reflecting LN disease activity or predicting LN outcome remain controversial [40]. In our LN cohort, the anti dsDNA Ab titres and serum complement levels were not associated with LN activity. These were tested at 2-monthly intervals which may be too short an interval for reflection of changes in renal disease activity. However, these findings are consistent with those reported by others [41,42]. Moroni et al. demonstrated that only anti-C1q antibodies associated significantly with LN activity whereas anti dsDNA Ab, C3 and C4 did not [41]. Esdaile et al. evaluated anti dsDNA Ab, C3, C4, and Clq as predictors of renal, nonrenal flares and all flares combined and did not find any of these to be useful [42]. However, other studies have reported that raised anti dsDNA Ab levels was associated with active renal disease [43,44] and that decline in C3 or C4 levels coincided with an increase in LN activity [45].
In a recent report, Abujam et al. demonstrated uMCP-1 to be superior to serum C4 and urinary CXCL-10/IP-10 in this regard but of equivalent efficacy to anti ds DNA Ab titres and serum C3 in differentiating active LN from non renal SLE [46]. In this current study, the ROC curve for uMCP-1 showed that it had a good diagnostic profile for early detection of LN activity and outperformed anti ds DNA Ab titres, serum C3, C4, and usual biochemical markers. However, it was not as good as proteinuria (uPCI) and SLEDAI-2K renal score for detection of LN activity.
Multiple logistic regression analysis showed that only proteinuria and SLEDAI-2K renal score were independent predictors of LN activity. This is not surprising since this renal score is an amalgamate of urinary abnormities in active LN. Moreover, proteinuria and increased SLEDAI-2K renal score were used as main criteria in our definition of LN activity.
Although uMCP-1 was not an independent predictor for clinically or overtly active LN, it is well known that patients with clinically active LN have a spectrum of renal involvement on renal biopsy which may range from histopathologically severe disease to varying levels of downgrading activity in response to treatment. Similarly, patients with clinically inactive LN also have varying grades of renal histopathologic findings ranging from total quiescence to low grade ‘grumbling’ disease to early ‘subclinical’ relapse. This dilemma further lends support to the inclusion of uMCP-1 to the current clinical markers as a finetuning tool for following LN activity. Thus, uMCP-1 may be a useful adjunctive diagnostic tool to further discriminate between clinically active and inactive LN in this complex disease.
Early treatment of LN may lead to earlier and more complete remission (CR), decreases progression to chronic kidney disease (CKD) and end stage kidney disease (ESKD), decreases total exposure to immunosuppressive medications and their toxicities and results in overall improved patient outcome.
In conclusion, uMCP-1 may provide further adjunctive evidence if the clinical diagnosis of LN activity remains uncertain and facilitate improved grading of nephritis activity in this complex disease thus leading to early treatment and better outcome. Serial measurements of uMCP-1 may also allow us to follow the course of LN during treatment after the initial renal biopsy without resort to repeated biopsies in the majority of such patients. We are following this cohort of 100 LN patients longitudinally and hope to report these results in the near future.
This paper was presented as a poster [SU183] at the International Society of Nephrology (ISN), World Congress of Nephrology (WCN) 2013 Hong Kong, May 31-4 June 2013. We thank the Dean and Medical Director of the UKMMC for his kind permission to publish these data. We are grateful to Rahimah Ismail and Rafidah Mamat for helping with preparation of urine samples for the MCP-1 assays. This study was supported by a grant from the Faculty of Medicine, UKM [FF-446- 2011] and another from the MAA Medicare Kidney Charity Fund.
The authors declare no conflict of interest.