Journal of Plant Biochemistry & Physiology
Open Access
ISSN: 2329-9029
ISSN: 2329-9029
Research Article - (2018) Volume 6, Issue 2
Transcriptional response of grapevine (Vitis vinifera L.) VvOSM1 has been investigated in Baladi and Halawani cultivars and B41 rootstock grapevine leaves, under salt stress [(0, 1, 2 and 3 dS/m of sea water (SW)] treatment after 1, 3 and 5 days of exposure. Real-Time PCR (RT-qPCR) technique has been employed to investigate VvOSM1 gene expression in two cultivars and one rootstock grapevine. Data revealed that the VvOSM1 transcription level increased for the two cultivars as the applied salt concentration increased from 1 to 3 dS/m, and also with salt exposure time from 1 to 5 days; expect for Baladi. Overall, transcript expression was higher in the examined cultivars compared to the B41 rootstock. Whereas, with a prolonged time exposure up to 3 days, VvOSM1 gene showed up-regulation in Halawani cultivar and down-regulation in Baladi cv. and B41 rootstock. Thereby, RT-qPCR technique could be used as a potential tool for VvOSM1 transcriptional response in grapevine breeding programs.
Keywords: Grapevine; Vitis vinifera L.; Salt stress; Real-Time PCR (RT-qPCR) technique; Transcript analysis
Grapevine (Vitis vinifera L.) is one of the most ancient cultivated fruit crops worldwide. The earliest writings and chronicles clearly indicated that grapevine (V. vinifera L.) is the most important fruit species worldwide due to its traditional, religious and economic value [1]. In Syria, its unique historical and geographical emplacement encouraged its cultivation for more than 5000 years [2]. Approximately, 100 grapevine cultivars are distributed in Syria of which Halwani and Baladi production is estimated to be 30 and 20%, respectively from the total Syrian grapevine production [3]. Salinity is considered as one of the most serious problems in the Mediterranean basin and is increasing day by day. According to the estimated FAO data, over 6% of the world's land is affected by salinity [4]. It has been documented that, approximately 50% of irrigated soil in Syria suffers from salinity [5]. Grapevine is classified to be moderately sensitive to salt stress [6]. Salinity among other environmental stresses causes deleterious effects in biological processes manifested by morphological, physiological, biochemical and molecular changes. Thereby, plants develop many mechanisms to protect themselves from salinity and its unfavorable effects by which gene expression regulation [7,8]. Osmotin and osmotin-like proteins are some of these genes that are induced by salt stress treatment and regulated at the transcriptional level. Their expression patterns considered as a potential approach to detect plants response to salt stress [8-10]. Osmotin is a cationic protein that belongs to the pathogenesis-related (PR)-5 family proteins with a molecular mass of 26 KDa [11]. PR family proteins displayed multifunction role in plants and other living organisms; e.g., as antimicrobial (bacteria and fungi), insecticidal, antiviral and nematicidal agents [10,12]. It has been documented that they are also induced by other stresses e.g., salinity, water and low temperature [10,13,14]. Their importance comes from their role in facilitating soluble compartementation leading to osmoregulation adjustment through their involvement in metabolism alteration process [10,12,14]. Many protein groups involved in salinity tolerance are known to be osmotin and osmotin-like proteins [13,15]. Previously, Singh et al. [15] successfully isolated these genes from tobacco plants exposed to low osmotic potential Agaolu et al. [13] reported the role of osmotin VvOSM1 in salinity tolerance in grapevine (V. vinifera L.). Whereas, Husaini and Abdin [16] reported the tobacco osmotin (Tbosm) gene role in enhancing salinity tolerance in strawberry (Fragaria x ananassa Duch.). Moreover, Subramanyam et al. [17] reported the tobacco osmotin (Tbosm) gene importance for enhancing salinity tolerance in soyabean (Glycine max [L] Merrill). More recently, You et al. [18] reported that VvXDH gene from V. vinifera enhanced salinity tolerance in transgenic Arabidopsis plants.
However, VvOSM1 importance in salinity tolerance in grapevine (V. vinifera L.) has not be emphasized in detail. Thereby, the current study focused on VvOSM1 gene expression patterns in two Baladi and Halawani grapevine cultivars and the B41 as an introduced rootstock, under salt stress treatment using RT-qPCR technique in a preliminary assay.
Plant materials preparation
Baladi, Halawani grapevine cultivars and the B41 as an introduced rootstock, were obtained from the General Commission for Scientific Agricultural Research of Syria (GCSAR) providing source of cultivars multiplication. B41 grapevine is described as a very sensitive rootstock to NaCl (0.6 dS/m NaCl) [13]. It is known that Halawani followed by Baladi grapevine cultivars among the 100 grapevine cultivars distributed in Syria, were the most cultivated ones in Syria [19].
Cuttings from cultivars and rootstock grapevine were treated with 1000 ppm IBA for 30 S and cultivated in a box containing 1:1 (v/v) mixture of perlite:peatmosse medium. Experiment has been carried out in a greenhouse under controlled conditions (temperature of 25°C, 12-h photoperiod and relative humidity of 80%). Root appeared one month later. Seedlings have been transferred to separate pots each of 5 L filled with the 1:1 (v/v) mixture of perlite:peatmosse medium. Plants were irrigated with tap water twice per week for two months before salt stress initiation. Some plants were continuously irrigated with tap water as a control. Whereas, other ones have been subjected to Sea water (SW) solution diluted to achieve 1, 2 and 3 dS/m as final concentration. The experiment (three replicates per treatment) was carried out in the greenhouse for 5 days. Leaf samples (for control and stressed plants) were harvested 1, 3 and 5 days after salt treatment and were kept frozen in liquid nitrogen.
RNA isolation and cDNA synthesis
Frozen leaf samples (150 mg) were grained to a fine powder. mRNA extraction has been achieved using Nucleotrap mRNA mini kit (Macherey-Nagel, MN, Germany) according to the manufacturer's protocol. RNA was then used as a template for cDNA synthesis using the QuantiTect Reverse Transcription Kit (Qiagen) according to the manufacturer’s instructions. Synthesized cDNA was kept at -20°C until use.
Quantitative real-time PCR (qPCR) assay and data analysis
VvOSM1 expression patterns in two (Halwani and Baladdi) cultivars and B41 rootstock V. vinifera were examined at different time intervals. Quantitative RT-qPCR amplification was performed using the VvOSM1 gene forward primer F (5’- AACTCAACAATGGGCCTCTG-3’) and the reverse primer R (5’- TGCAACCACCGGTAGTCTTT-3’) [13]. Whereas, the Actin1 gene was used as a reference gene and amplified with forward primer F (5′- GATTCTGGTGATGGTGTGAGT-3′) and the reverse primer R (5′- GACAATTTCCCGTTCAGCAGT-3′) [20]. Real-Time qPCR amplification has been performed using Rotor-Gene Q (ABI Applied Biosystem) with 96-well rotor, and the FastStart SYBR Green Master kit (Thermo), with the recommended thermal profile (40 cycles). The melting curve analysis and gel electrophoresis of the qPCR products were also carried out. All cDNA samples, standards and no template controls (reactions without cDNA) were performed in triplicate in a single run. Rotor-Gene Q software (ABI) was used to investigate the standard curve calculation and data analysis.
The threshold cycle (Ct) value was automatically determined for each reaction by the real time PCR system with default parameters. Raw data (not baseline corrected) of fluorescence levels and the specificity of the amplicons were checked by RT-qPCR dissociation curve analysis using Step One Software (v2.3). Consequently, to evaluate the variation of Ct values of each gene, calculation of the final Ct values was the mean of three replicates and the coefficient of variance (CV) has been obtained. Each RT-qPCR reaction set included water as a negative no-template control instead of cDNA. Step one Plus software (v2.3) was used to accurately estimate the PCR efficacy. In this regards, in our case study, a standard curve slope of -3.32 refers to 100 PCR efficacy reactions. Whereas, value superior to -3.32 refers that PCR efficacy reaction is less 100%.
The fluorescence readings of three replicated samples were averaged, and the blank value (from no-DNA control) was subtracted. Relative expression level was calculated using the average cycle threshold (Ct). Average Ct values were determined from the triplicate experiment conducted for each gene, with the ΔCT value determined by subtracting the average Ct value of genes from the Ct value of the Actin1 gene. Finally, the equation 2−ΔΔCT was used to determine relative expression level according to Livak and Schmittgen [21]. Standard deviation (SD) was calculated from the mean of three replicates/reaction. Statistical analysis was performed using the Tukey's test at a 0.05 level.
Semi-quantitative real-time PCR (PCR) data analysis
The RT-qPCR products were separated on a 2% ethidium bromidestained agarose (Bio-Rad) in 0.5x Tris-borate- EDTA (TBE) buffer and then were visualized with Gel documentation 2000 USA to estimate band intensity.
Transcript response of the grapevine (V. vinifera L.) VvOSM1 gene to salt stress has been evaluated in Baladi and Halawani cultivars and B41 rootstock grapevine, under salt stress (0, 1, 2 and 3 dS/m of sea water) 1, 3 and 5 days after exposure, using RT-qPCR tool. Results showed that salt stress caused transcript profile alteration in the examined plants. In global, VvOSM1 transcription level increased for the two cultivars as salt applied concentration increased from 1 to 3 dS/m, and also with time exposure from 1 to 5 days; except for Baladi. Whereas, for B41 rootstock, this expression followed similar trends as in the cultivars after 1 and 3 days of exposure. While, reduction in its expression level has been recorded after 5 days exposure at the highest applied SW (3 dS/m) concentration. In this respect, in Halwani cv., VvOSM1 was up-regulated by 1.2, 5.8 and 7.2-fold under 1, 2 and 3 dS/m SW, respectively after 3 days of exposure. Whereas, in Baladi cv. it was up-regulated by 4, 4.1 and 10.5-fold under 1, 2 and 3 dS/m SW, respectively, after 3 days of exposure. While, it was up-regulated by 0.4, 3.5 and 5.1-fold under 1, 2 and 3 dS/m SW, respectively, after 3 days of exposure in B41 rootstock (Figure 1). After 5 days of SW exposure, VvOSM1 expression continuously increased in Halawani cv. by 2.5, 4.4 and 8.3-fold under 1, 2 and 3 dS/m SW, respectively. Whereas, a decrease in its expression has been recorded compared to 1 and 3 days of exposure, indicating that this gene was activated during the 3 days of exposure and inhibited when stress duration prolonged to 5 days of exposure. While, in B41 rootstock, its expression increased by 0.4 and 4.2-fold under 1 and 2 dS/m SW, respectively combined with a decrease in its expression to 1.5-fold at the highest SW applied concentration (3 dS/m SW).
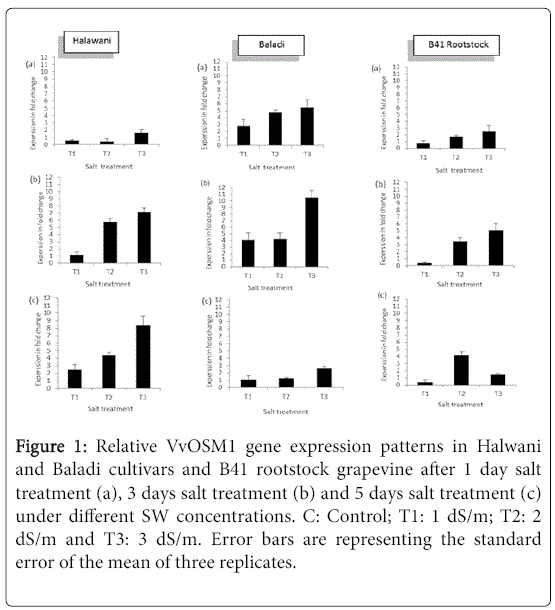
Figure 1: Relative VvOSM1 gene expression patterns in Halwani and Baladi cultivars and B41 rootstock grapevine after 1 day salt treatment (a), 3 days salt treatment (b) and 5 days salt treatment (c) under different SW concentrations. C: Control; T1: 1 dS/m; T2: 2 dS/m and T3: 3 dS/m. Error bars are representing the standard error of the mean of three replicates.
This leads to conclusion that during the third day of exposure, the VvOSM1 gene was highly up-regulated in the three examined accessions, notably in Baladi followed by Halwani cv. Whereas, it was moderately up-regulated in the B41 rootstock. While, after 5 days of exposure, it was continuously highly up-regulated in Halwani cv; and slightly down-regulated in Baladi cv. and B41 rootstock. This finding could explain by changes in band gene intensity via different SW concentrations after 5 days of exposure (Figure 2) based on a semiquantitative RT-qPCR analysis.
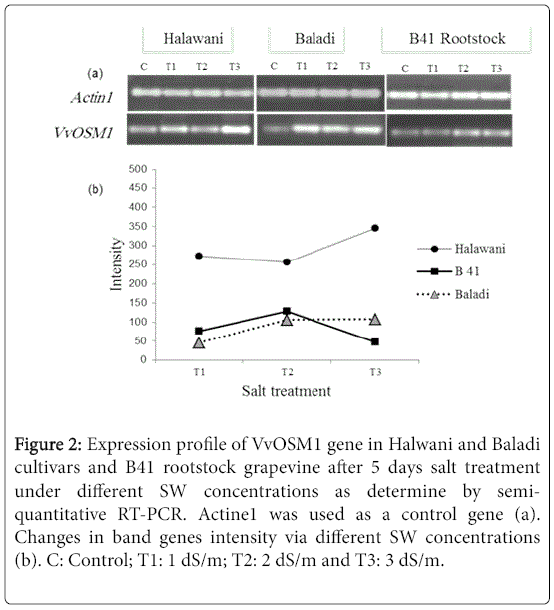
Figure 2: Expression profile of VvOSM1 gene in Halwani and Baladi cultivars and B41 rootstock grapevine after 5 days salt treatment under different SW concentrations as determine by semiquantitative RT-PCR. Actine1 was used as a control gene (a). Changes in band genes intensity via different SW concentrations (b). C: Control; T1: 1 dS/m; T2: 2 dS/m and T3: 3 dS/m.
Salinity stress induced alteration in expression many genes (up or down-regulation) according to plants species, salt applied concentration and stress duration.
Salt stress caused an oxidative, osmotic stresses and reactive oxygen species (ROS) induction; where ROS non-specifically interact with cellular constituents leading to various cellular damages. Consequently, plants tend to develop different protective mechanisms such as osmotin genes accumulation enhancing thereby their hyperosmotic tolerance [17]. Osmotin is synthesized and induced by abscisic acid (ABA) which plays a potential role in accelerating cell adaptation to salt and osmotic stresses [17,22,23].
Husaini and Abdin [16] reported that osmotin could play an important role in signaling particularly in proline biosynthesis pathway upregulation.
A study by Agaolu et al. [13] reported the osmotin VvOSM1 gene expression level in 10 cultivars and 7 rootstocks grapevine exposed to different NaCl concentrations (0.2, 0.5, 0.7 and 1.3 dS/m) for different times (1, 3.5 and 8 days) based on a Northern blot assay. The previous study showed that osmotin VvOSM1 gene expression level was lower in rootstocks than in cultivars. Indeed, genotyping variation in mRNA accumulation level has been recorded among the examined 10 cultivars. Similar observation was recorded in the examined 7 rootstocks, of which B41 revealed to possess the lowest expression level. To earlier, Howell et al. [24] described salt tolerance degree in cultivars and rootstocks of grapevine, by 4.7 dS/m for cultivars and 2.3 dS/m for American V. vinifera rootstocks. Other studies however, reported that B41 expression level under salt stress was closed to their respective control [13,24]. Tattersall et al. [25] reported transcript response of grapevines Sauvignon Cabernet cultivar exposed to three stress types [sudden chilling (5°C), water deficit (PEG), and an isoosmotic salinity (12 dS/m NaCl and 1.2 dS/m CaCl2)] for 1, 4, 8, and 24 h. The previous study revealed that stresses application caused different effects on many hormones (ABA, ethylene, and jasmonate) and on transcription level.
Cramer et al. [7] reported changes in transcript abundance between gradual application and long-term (16 days) regime application of water-deficit stress and equivalent salinity stress in V. vinifera cv. Cabernet Sauvignon based on quantitative reverse transcription-PCR. The previous study showed that transcription response was approximately similar in short and long-term salinity and water-deficit application.
Whereas, Owais [6] reported morphological and physiological alterations induced in five grapevine landraces and B41 rootstock exposed to salt stress (9.4 dS/m and 18.8 dS/m NaCl). The previous study showed genotyping variation in salinity tolerance among the examined accessions. More recently, You et al. [18] reported that VvXDH gene from V. vinifera enhanced salinity tolerance in transgenic Arabidopsis plants. This observation could be explained by the fact that VvXDH overexpression can lead to an increase in allantoin accumulation and so activate ABA signaling pathway and enhance ROS scavenging in transgenic Arabidopsis plants. Other study however, focused on other abiotic stress types like drought and excessive heat and light stresses in V. vinifera L. In this regard, Rocheta et al. [8] reported transcriptomic response of two V. vinifera L. varieties to drought and excessive heat and light stresses in combinations (pairs or in triplets) using RT-qPCR assay. The previous study revealed different tolerance levels with a lower transcriptome response for the two examined varieties. Indeed, transcriptomic response revealed different manners, e.g., synergistic impact on the transcriptome level observed when different stresses were applied together. Whereas, antagonistic impact on transcriptome level with a low frequency was observed between stresses. Dubrovina et al. [26] successfully identified and characterized calcium-dependent protein kinase (CDPK) genes involved in abiotic stress [(osmotic 40 dS/m NaCl and 40 dS/m mannitol and temperature of +10 and +37°C stresses)] conditions in Vitis amurensis wild grapevine after 12 and 24 h of exposure. The RT-qPCR applied in the previous study revealed that VaCPK1, VaCPK2, VaCPK3, VaCPK9, VaCPK13, VaCPK16, VaCPK20, VaCPK21, VaCPK25, VaCPK26, VaCPK29, and VaCPK30 were the major novel transcriptionally CDPK genes regulated by the applied abiotic stresses. Whereas, Subramanyam et al. [17] reported the tobacco osmotin (Tbosm) gene importance for enhancing salinity (20 dS/m NaCl) tolerance in soyabean (Glycine max [L] Merrill) based on a Reverse transcriptase-PCR (RT-PCR) and Western blotting techniques. The previous study revealed that the high salinity tolerance observed in transformed soyabean plants could be related to the high accumulation of chlorophyll and organic solutes [proline, ascorbate peroxidase (APX), catalase (CAT) and superoxide dismutase (SOD)] than non- transformed once. Overall, our data were in accordance of Agaolu et al. [13] who reported that osmotin VvOSM1 gene expression level was lower in grapevine rootstocks than in cultivars.
Transcription expression levels increased as SW applied concentration and time exposure increased for the two examined cultivars after 1 and 3 day of SW exposure. Expression was higher in cultivars than in B41 rootstock. Whereas, with a prolonged time exposure to 5 days, VvOSM1 gene expression was increased in Halawani and decreased in Baladi cv. while, it was decreased at the highest applied SW (3 dS/m) concentration in B41 rootstock. To confirm results obtained herein, analysis of some osmolytes such as abscisic acid (ABA) and proline which plays a potential role in accelerating cell adaptation to salt and osmotic stresses, are needed.
We thank I. Othman (General Director of AECS) and N. Mir Ali (Head of Molecular Biology and Biotechnology Department in AECS) for their support.
Conflict of Interest
The authors declare that the study involved no conflict of interest from any party.