Journal of Pollution Effects & Control
Open Access
ISSN: 2375-4397
ISSN: 2375-4397
Research Article - (2015) Volume 3, Issue 1
Using pressurized liquid extraction and GC-MS/MS, Polycyclic Aromatic Hydrocarbons (PAH) levels were determined in pond and river sediments receiving effluents from a Chemicals Installation (CI) and a Surface Treatment Installation (STI), respectively. Maximum values were obtained for the STI site with total PAH concentrations of 3000-4000 ng g-1 compared to 200-2500 ng g-1 for the CI site. Furthermore, in the river (STI), for two PAHs (phenanthrene and acenaphthylene), one sample presented concentrations that exceeded the probable effect concentrations leading to this sediment being classified as toxic. However, PAH levels were higher upstream of the STI discharge water than downstream, indicating sediment PAH accumulation was not exclusively due to this industrial activity. At the CI site, the concentrations found at different points showed that in the pond, PAHs were derived from industrial activities but were rapidly diluted in the water mass. PAH fingerprinting following various guidelines, revealed the prevalence of a pyrolytic origin.
Keywords: Freshwater sediments; Hydrocarbons; Industrial sites; GC-MS/MS; Pyrolytic origin; Pressurized liquid extraction
Polycyclic Aromatic Hydrocarbons (PAHs) are organic pollutants with two or more fused aromatic rings. They are introduced into the environment via natural and anthropogenic processes and contaminate all environmental compartments. Indeed, they have already been found in food or food supplements [1], marine organisms [2-4], water [5-7], sewage sludge [8], dust particles, soils and sediments [9-12]. Due to their high toxicity to humans [13,14] and aquatic organisms [15], they have become a focus for scientific research. Consequently, it was necessary to develop analytical methods able to quantify this pollutant family. Numerous methods have already been developed for PAH extraction in various environmental matrices, such as Pressurized Liquid Extraction (PLE), Supercritical Fluid Extraction (SFE), subcritical water extraction, dispersive liquid-liquid microextraction (DLLME), Solid-Phase Extraction (SPE) or microextraction (SPME), Stir Bar Sorptive Extraction (SBSE) or soxhlet extraction [16-20].
Due to their chemical properties such as low water solubility, PAHs released into the aquatic environment tended to sorb onto suspended particles and sediments and could therefore impact both benthic organisms, directly in contact with sediments, and pelagic microphagous organisms feeding on suspended particles [21,22]. It could be interesting to determine the origin of PAHs which could be pyrogenic (incomplete combustion of organic material from anthropogenic activity or natural source such as forest fire), petrogenic (crude oil or coal) or biogenic (diagenesis) sources in freshwater sediments, given that their presence has already been shown in industrial discharge waters [3,23,24] usually flushed into the freshwater environment. Thus, it is necessary to develop selective and sensitive methods of extraction and analysis of freshwater sediments from industrial sites, because of the simultaneous presence of a large quantity of various pollutant types (salts, metal ions, organics) as described by Morin-Crini et al. [23].
Firstly, the present work aimed to develop, in freshwater sediments, a specific, rapid and sensitive analytical method for the quantification of the 16 PAHs which have been selected by the US Environmental Protection Agency (US EPA) as priority pollutants (Figure 1). Secondly, we investigated the presence of PAHs in sediments in contact with discharge waters from industrial sites carrying out chemistry and surface treatment activities. Finally, we propose to determine the PAH compositional origin through three indicators based on the number of rings, isomeric ratios and total index (based on weighted-isomeric ratios).
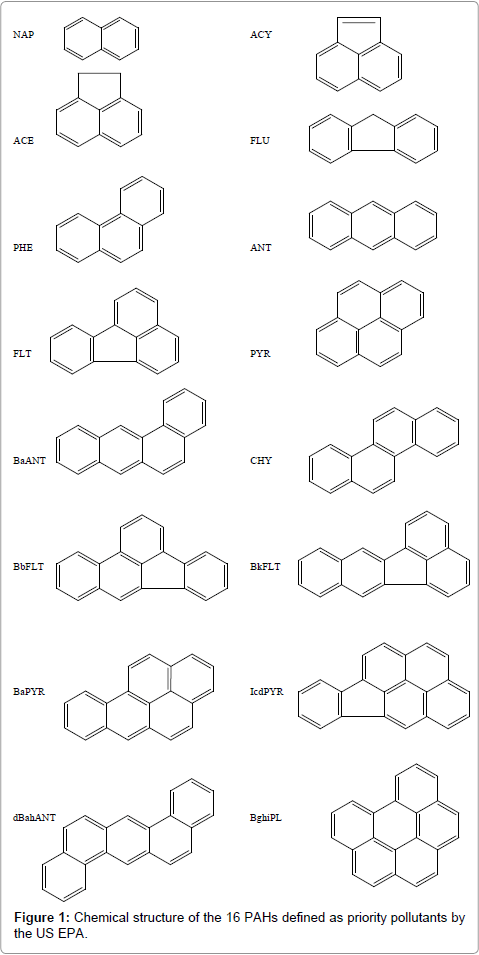
Figure 1: Chemical structure of the 16 PAHs defined as priority pollutants by the US EPA.
Chemicals
Sixteen PAHs and three deuterated internal standards (ISTD) were purchased from Supelco Sigma Aldrich (Saint Quentin Fallavier, France) and Interchim (Montluçon, France): naphthalene (NAP), acenaphthene (ACE and ACE-d10), acenaphthylene (ACY), fluorene (FLU), phenanthrene (PHE), anthracene (ANT), fluoranthene (FLT), pyrene (PYR and PYR-d10), benzo[a]anthracene (BaANT), chrysene (CHY), benzo[b]fluoranthene (BbFLT), benzo[k]fluoranthene (BkFLT), benzo[a]pyrene (BaPYR and BaPYR-d12,), dibenzo[a,h] anthracene (dBahANT), indeno[1,2,3-cd]pyrene (IcdPYR), benzo[g,h,i]perylene (BghiPL). n-hexane and methanol Distol, a range of products for organic trace analysis, were obtained from Fisher Scientific (Illkirch, France). Acetone (analytical grade, Fisher Scientific, Illkirch, France), Decon-90 (Fisher Scientific, Illkirch, France) and ultra-pure water (Millipore Milli-Q Integral 3 system, Molsheim, France) were used for glassware clean-up.
PAH extraction
Different experiments were performed to improve PAH extraction efficiencies using sediment from a river located in a rural (forest) and weakly anthropized watershed, referred to as blank. The blank sediment was spiked at 50 ng g-1 dry mass. However, to allow equilibrium to be reached between PAHs and matrix, a contact time of one night in the dark and at 4°C (to prevent photodegradation) was applied. Comparison between PLE and ultrasonic extraction (USE) was investigated. For USE, 5 g of sediment was sonicated with 50 mL of solvent (hexane or methanol) for 15 min, conditions adapted from Martinez et al. [25]. The extract was centrifuged (5 min at 4500 rpm) then the sediment was retrieved and sonicated a second time in the same conditions. Both fractions were concentrated and injected separately into the GCMS/ MS apparatus and then summed. Pressurized Liquid Extraction (PLE) was performed using a Büchi (Rungis, France) SpeedExtractor E-914 system equipped with stainless steel extraction cells (volume 40 mL). The extraction cell was filled from the bottom to the top with the following materials: first, a glass fiber filter, then a few grams of pure quartz sand followed by the dried sediment sample (5.000 ± 0.001 g), covered by glass beads and finally, a cellulose filter. The sediment samples were extracted with hexane or methanol under the following conditions: temperature: 100°C; pressure: 10 MPa; cycles: 1 or 2; heatup: 1 min; hold: 10 min; discharge: 2 min; flush with solvent: 1 min; flush with nitrogen gas: 2 min. In both cases, USE or PLE, the extracts were concentrated using a Syncore Analyst (Büchi, Rungis, France). In the case of PLE, it was the same vessel which was used both for collected extracts and their concentration, avoiding the loss of organic compound during transfer. Moreover, a locally cooled appendix on the sample vessel prevented evaporation to dryness (residual volume of roughly 0.3 mL). The concentrated extracts of PLE and USE were transferred to a 1 mL volumetric flask and made up with hexane.
PAH analysis
Sample extracts were analyzed in the GC-MS/MS apparatus (Agilent, Massy, France) which included a 7890A GC system, a 7000 GC triple quadrupole mass spectrometer and an 80 GC Combipal autosampler. 1 μL of the extract was injected at a temperature of 300°C in splitless mode under a constant He flow (purity 99.9999 %) at 1.5 mL min-1 followed by a purge flow to split vent after 0.5 min. We used a (5 % phenyl)-methylpolysiloxane HP5MS column (30 m x 0.25 mm i.d, 0.25 μm film thickness, Agilent 19091J-433). The temperature gradient was from 45°C (hold 0.5 min) to 100°C at 30°C min-1 then from 100°C to 325°C at 10°C min-1 (hold 5 min). Total run time was 30 min. The temperatures of the transfer line, ion source and quadrupoles were 300, 300 and 150°C respectively. An electron-impact ion source at 70 eV was required. Nitrogen with a purity of 99.9 % was produced by a NiGen LC-MS 40-1 Claind generator (Gengaz, Wasquehal, France) and used as collision gas at 1.5 mL min-1. For data analysis, Agilent MassHunter B.05.02.1032 software was used. For apparatus performance controls, an autotune was performed weekly at m/z 69, 264 and 502 from the electron-impact of perfluorotributylamine (PFTBA).
Validation of extraction method
A calibration graph was established for each of the 16 compounds using blank sediment spiked at five increasing concentrations (10, 20, 40, 60 and 100 ng g-1 dry mass). The spiked calibration samples were treated following the validated extraction procedure: PLE in hexane with 2 cycles. Calibration curves were constructed by plotting the analyte/ISTD peak area ratios versus the analyte concentration. Five experimental replicates for each concentration were carried out to validate the method through the following parameters: linearity, Limit of Detection (LOD), precision and trueness.
Field samples
The method was applied to field samples of sediments receiving industrial effluents. Sediments were manually collected at two sites using a modified pickaxe which sampled 0.05 m2 to a depth of 5 cm. At the Chemical Installation (CI) site, sediments were sampled at six locations in the pond in which the wastewater was released (Figure 2). Points 2 to 6 were situated along a transect starting from the nearest to the discharge to the furthest whereas point 1 was isolated upstream of the discharge water by a dike (Figure 2). At the Surface Treatment Installation (STI) site, sediments were sampled at four locations in the river in which the discharge water was released. Points Cup and Dup were situated upstream of the discharge water, close (110 m) and distant (645 m) respectively, whereas Cdown and Ddown were situated downstream of the discharge water, close (130 m) and distant (545 m), respectively. An aliquot of each sample was immediately lyophilized until constant mass and then sieved through a 0.5 mm mesh. The other aliquot was stored at -20°C in case of need for further analyses. Indeed, additional analysis was performed on sediment from point 2 (site CI) which had been centrifuged for 15 minutes at 6100 rpm to remove interstitial water, before being lyophilized.
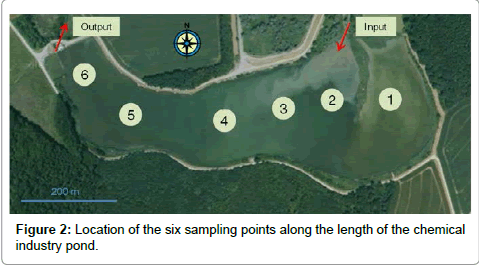
Figure 2: Location of the six sampling points along the length of the chemical industry pond.
Regulatory standards to sediment toxicity classification
The concentrations determined in field samples were compared to different types of reference values which defined threshold concentrations regarding biological effects (Table 1). The effects range low (ERL) and effects range median (ERM) provided chemical concentration ranges that are rarely, occasionally, or frequently associated with adverse biological effects [26,27]. The threshold and probable effect concentrations (TEC and PEC, respectively) proposed by Zeng et al. [28] and derived from several guidelines [29-31] allowed us to judge whether sediment was toxic or nontoxic.
| ERL | ERM | TEC | PEC | |
| NAP | 160 | 2100 | 176 | 561 |
| ACY | 44 | 640 | 5.87 | 128 |
| ACE | 16 | 500 | 6.71 | 88.9 |
| FLU | 19 | 540 | 77.4 | 536 |
| PHE | 240 | 1500 | 204 | 1170 |
| ANT | 85.3 | 1100 | 57.2 | 845 |
| FLT | 600 | 5100 | 423 | 2230 |
| PYR | 665 | 2600 | 195 | 1520 |
| BaANT | 261 | 1600 | 108 | 1050 |
| CHY | 384 | 2800 | 166 | 1290 |
| BbFLT | nd | nd | nd | nd |
| BkFLT | nd | nd | 240 | 13400 |
| BaPYR | 430 | 1600 | 150 | 1450 |
| IcdPYR | nd | nd | 200 | 3200 |
| dBahANT | 63.4 | 260 | 33 | 135 |
| BghiPL | nd | nd | 170 | 3200 |
| Σ PAHs | 4022 | 44792 | 1610 | 22800 |
Table 1: Reference values in sediments (ng g-1) [26-31] and associated biological effects (rarely adverse effect < ERL < occasionally < ERM < frequently; nontoxic < TEC < neither toxic nor nontoxic < PEC < toxic).
Methods for determining the composition and hence the origin of the PAHs
Several approaches were used to determine the source of PAH pollution (petrogenic, biogenic and pyrogenic). The first, which was described by several authors [5,32,33] stated that pyrogenic PAHs were dominated by heavier molecules with 4 to 6 rings. The second approach used analyses of selected PAH isomer ratios [22,34,35]:
where [ANT], [PHE], [FLT], [PYR], [BaANT], [CHY], [IcdPYR], [BghiPL] were PAH concentrations.
Ratios above 0.10 at mass 178, 0.50 at mass 202, 0.35 at mass 228 and 0.20 at mass 276 represented dominance of pyrogenic origin.
The third approach used the total index defined by Orecchio [36] which stated that a value above 4 indicated a pyrogenic process:
where ratios 178 to 276 were defined in equations (1) to (4).
Investigations of extraction parameters
Whatever the solvent used (hexane or methanol) and the PLE cycle number, the extraction yields were still higher with PLE than with USE. For instance, in hexane and with two extraction cycles, an average efficiency increase of 36% was obtained with the use of PLE compared to both fractions summed in USE. Thus, all results presented hereunder were realized with the PLE method. Investigations on the choice of the extraction solvent, hexane or methanol, showed that, except for BaPYR, IcdPYR, dBahANT and BghiPL, the signal to noise ratio (S/N) was increased with the use of hexane up to 500-fold at a given concentration. These results are in accordance with those of Martinez et al. [25] and Foan and Simon [37] who indicated that the use of polar solvent, such as methanol, caused chromatographic interference due to the co-extraction of polar compounds. Finally, it was demonstrated that performing the extraction in two cycles instead of only one increased the average efficiency by 13%.
Method validation
Correlation coefficients of each compound were always higher than 0.9 except for NAP and IcdPYR (Table 2). These results are in agreement with those of Burkhardt et al. [38] who obtained the lowest R2 value for NAP. Precision, which was assessed through the Residual Standard Deviations (RSD), gave suitable values for all PAHs (RSD values ≤ 30%; Table 2). The trueness was acceptable, since recoveries were determined between 98 % (BghiPL) and 141 % (NAP) (Table 2). High sensitivity was obtained for most PAHs (LOD between 0.2 and 5.5 ng g-1 for 1 μL injection volume, 5 g sediment, Table 2). However, NAP and PHE gave higher LOD values (18.6 and 10.6 ng g-1 respectively). The LODs obtained in this study were better than those observed by the GC-MS analysis of 1 μL of extract obtained by PLE and SPE of 25 g of sediment [38]. Similar values were obtained for an injection volume of 10 μL and a mass of extracted sample of 0.5 g, by USE and SPE coupled to reversed phase liquid chromatography with UV detection [39] and for Soxhlet extraction of 3 g sediment and an injection volume of 1 μL in GC-MS [36]. Nevertheless, very high sensitivity was obtained by a longer, multi-step method composed of PLE followed by stir bar sorptive extraction coupled with thermal desorption and GC-MS/MS analysis [40].
| Correlation coefficient | LOD (ng g-1) | RSD (%) | Recovery (%) | |
| NAP | 0.634 | 18.6 | 27 | 141 |
| ACY | 0.915 | 1.1 | 19 | 119 |
| ACE | 0.957 | 2.1 | 14 | 114 |
| FLU | 0.961 | 2.0 | 14 | 116 |
| PHE | 0.941 | 10.6 | 15 | 123 |
| ANT | 0.935 | 1.7 | 17 | 122 |
| FLT | 0.935 | 5.5 | 16 | 121 |
| PYR | 0.951 | 3.5 | 15 | 111 |
| BaANT | 0.944 | 0.5 | 16 | 113 |
| CHY | 0.924 | 1.9 | 16 | 112 |
| BbFLT | 0.967 | 1.4 | 18 | 102 |
| BkFLT | 0.941 | 1.7 | 15 | 106 |
| BaPYR | 0.943 | 0.5 | 16 | 122 |
| IcdPYR | 0.886 | 0.6 | 27 | 106 |
| dBahANT | 0.938 | 0.2 | 26 | 119 |
| BghiPL | 0.941 | 0.7 | 24 | 98 |
Table 2: Correlation coefficient (R2), Detection Limits (LOD), Relative Standard Deviations (RSD) and recoveries for the determination of the 16 PAHs.
Analysis of field samples
The validated method was applied to PAH determination in sediments from two stations linked to industrial activities. At the CI site, note that among the 16 PAHs studied, 14 were systematically found in all samples (Table 3). The highest values were obtained for point 2, located closest to the discharge water release point from the chemical industry with a total PAH content of 2467 ng g-1. Because two compounds (BaANT and CHY) presented concentrations higher than ERL (Tables 1 and 3), the sediment from point 2 could cause adverse biological effects. In return, considering TEC and PEC (Table 1), this sample was judged to be neither toxic nor nontoxic firstly because concentrations of 6 individual PAHs (BaANT, CHY, BkFLT, BaPYR, dBahANT and BghiPL) and secondly the sum of PAHs were between the TEC and PEC values. To determine if the high concentrations at point 2 came from the sediment itself or from the interstitial water, the sample was analyzed a second time with the addition of a centrifugation step to separate the liquid and solid phases of the sediment. The results indicated that concentrations decreased by a factor of 15 to 30 for BaANT, CHY, BbFLT, BkFLT, BaPYR, IcdPYR, dBahANT and BghiPL. Thus, PAHs present at point 2, were mainly concentrated in the interstitial water in colloidal or dissolved forms. The low concentrations found at point 1 (Table 3), always below ERL and TEC (Table 1), were expected since this sample was isolated from the discharge water by the dike. Thus, point 1 could be defined as a relative field control sample. Taking these considerations into account, the sample concentrations at points 3 to 6 seemed to regain this base level, reflecting a sharp decrease in the sum of PAH concentrations from the input point. Various abiotic and biotic phenomena may explain these results, from simple PAH dilution in the pond to more complex biogeochemical degradation processes [41,42].
| Point 6 | Point 5 | Point 4 | Point 3 | Point 2 | Point 1 | |
| NAP | 31.12 | < LOD | < LOD | < LOD | 62.49 | 23.12 |
| ACY | 1.91 | 1.73 | 2.01 | 2.23 | 2.46 | 2.09 |
| ACE | 3.26 | < LOD | < LOD | < LOD | 5.10 | < LOD |
| FLU | 19.73 | 8.85 | 5.88 | 8.36 | 15.17 | 16.81 |
| PHE | 48.40 | 30.45 | 25.76 | 32.02 | 54.33 | 44.18 |
| ANT | 5.82 | 4.29 | 4.37 | 5.48 | 7.24 | 5.46 |
| FLT | 35.47 | 35.05 | 35.80 | 42.56 | 56.24 | 40.16 |
| PYR | 33.10 | 28.12 | 29.60 | 34.75 | 48.93 | 30.92 |
| BaANT | 11.38 | 12.81 | 13.53 | 15.69 | 286.88 | 12.77 |
| CHY | 21.35 | 23.39 | 24.10 | 28.46 | 528.68 | 24.01 |
| BbFLT | 15.55 | 15.56 | 16.59 | 18.87 | 344.30 | 15.10 |
| BkFLT | 16.86 | 17.31 | 19.23 | 21.19 | 359.22 | 18.51 |
| BaPYR | 13.68 | 12.91 | 13.7 | 15.96 | 275.61 | 13.74 |
| IcdPYR | 7.59 | 8.25 | 7.93 | 8.32 | 138.07 | 6.22 |
| dBahANT | 2.01 | 2.96 | 5.22 | 2.32 | 44.63 | 2.00 |
| BghiPL | 12.88 | 11.87 | 12.03 | 13.95 | 237.75 | 11.27 |
| Σ PAHs | 280.1 | 213.6 | 215.8 | 250.2 | 2467 | 266.3 |
| Ratio 178 | 0.11 | 0.12 | 0.15 | 0.15 | 0.12 | 0.11 |
| Ratio 202 | 0.52 | 0.55 | 0.55 | 0.55 | 0.53 | 0.57 |
| Ratio 228 | 0.35 | 0.35 | 0.36 | 0.36 | 0.35 | 0.35 |
| Ratio 276 | 0.37 | 0.41 | 0.40 | 0.37 | 0.37 | 0.36 |
| Total index | 6.05 | 6.36 | 6.48 | 6.41 | 6.18 | 6.14 |
Table 3: Concentrations (ng g-1), isomeric ratios and total index of PAHs from pond sediments from chemical installation site.
In the STI site, all samples were highly contaminated, notably in comparison with the CI site (Tables 3 and 4). Indeed, they all exceed the ERL values for at least one compound and considering the sum of PAH concentrations, they were defined as neither toxic nor nontoxic (Tables 1 and 4). However, with regard to PHE (1337 ng g-1) and ACY (231 ng g-1) concentrations, Dup sediment can be classified as toxic since it overshot PEC values for these compounds (Table 1). Note that this point was the most contaminated among the four locations along the river. However, this sample originated from a location 545 meters upstream of the STI site, so its high levels of contamination cannot be attributed to the STI activities. Therefore, at least a portion of the PAH levels measured downstream of the discharge waters must result from this upstream sediment contamination. However, considering the differences in PAH concentrations in sediments just before and just after the discharge water (Cup and Cdown, respectively, Table 4), the STI activities also contributed to the PAHs released in the river (+23% for the sum of PAHs).
| Dup | Cup | Cdown | Ddown | |
| NAP | 294.00 | |||
| ACY | 231.00 | 46.00 | 39.80 | 37.30 |
| ACE | 46.50 | 3.70 | 4.40 | 6.90 |
| FLU | 225.00 | 18.10 | 16.70 | 21.70 |
| PHE | 1336.5 | 255.20 | 259.40 | 225.80 |
| ANT | 467.50 | 79.70 | 69.80 | 60.80 |
| FLT | 1728.30 | 718.70 | 879.40 | 672.90 |
| PYR | 1496.50 | 468.70 | 578.80 | 441.50 |
| BaANT | 668.34 | 368.43 | 390.37 | 252.03 |
| CHY | 456.75 | 301.60 | 348.98 | 216.40 |
| BbFLT | 1122.70 | 391.20 | 498.80 | 399.50 |
| BkFLT | 929.20 | 388.67 | 432.47 | 329.87 |
| BaPYR | 1037.30 | 367.30 | 390.90 | 390.20 |
| IcdPYR | 296.37 | 107.40 | 115.50 | 105.70 |
| dBahANT | 227.37 | 81.64 | 88.14 | 72.80 |
| BghiPL | 365.40 | 145.90 | 172.30 | 143.10 |
| Σ PAHs | 10929 | 3742 | 4286 | 3377 |
| Ratio 178 | 0.26 | 0.24 | 0.21 | 0.21 |
| Ratio 202 | 0.54 | 0.61 | 0.60 | 0.60 |
| Ratio 228 | 0.59 | 0.55 | 0.53 | 0.54 |
| Ratio 276 | 0.45 | 0.42 | 0.40 | 0.42 |
| Total index | 9.47 | 9.05 | 8.65 | 8.80 |
Table 4: Concentrations (ng g-1), isomeric ratios and total index of PAHs from river sediments from surface treatment industrial site.
As the two sites studied were close to industrial areas, we can assume that most PAHs were of anthropogenic pyrogenic origin (furnaces, industrial production, etc.) rather than from a petroleum source. It can be observed that PAHs with 4-6 rings made up the major part of total PAHs in both sites (Figure 3), which was 61-94% and 76- 91% for CI and STI sites, respectively, confirming that the PAH arose from combustion processes. The average ratios 178 were 0.12 and 0.23 for sediments from CI and STI sites, respectively (Tables 3 and 4) stressing the dominance of combustion origin. For ratio 202, the values were situated in the range 0.52-0.61 for both sites (Tables 3 and 4) indicating rather biomass or coal combustion. An average value of 0.35 was obtained for ratio 228 at site CI (Table 3), corresponding to the limit between petrogenic and pyrolytic sources. The average value of 0.55 obtained at site STI (Table 4) pointed to a combustion origin. For CI and STI sediments, ratio 276 gave average values of 0.38 and 0.42 respectively, suggesting combustion processes. However, whatever the site and the location, all total indexes were above 4 (Tables 3 and 4), indicating high temperature combustion processes and thus confirming a mainly pyrolytic origin of the PAHs found in the sediments impacted by both industrial sites.
In this work we developed and validated a method based on PLEGC- MS/MS for the analysis of PAHs, allowing their identification and quantification at ultra-trace levels in freshwater sediments. The results showed large concentration differences between the chemical installation and surface treatment installation sites, STI samples having total PAH values situated in the range 210-2500 ng g-1 against 3400- 11000 ng g-1 for CI samples. After checking against the regulatory values which classified sediments as toxic or not, the present study showed that these media sometimes reached hazardous concentrations for the aquatic environment. Following fingerprinting to determine the PAH origin, the total index indicated that whatever the location, the PAHs were of pyrolytic origin.
The authors thank the Agence de l’Eau Rhône Méditerranée Corse, Conseil Régional de Franche-Comté and the FEDER (Fonds Européens de Développement Régional) for financial support. The authors wish to thank Dr Peter Winterton (University Toulouse III, Toulouse, France) for his English grammar and syntax review and his critical reading.
The authors declare that they have no conflict of interest.