Journal of Physical Chemistry & Biophysics
Open Access
ISSN: 2161-0398
ISSN: 2161-0398
Research - (2024)Volume 14, Issue 1
Psoralens have been used in the treatment of several skin diseases such as psoriasis and atopic eczema through PUVA (Psoralen+UVA), cutaneous T-cell lymphoma through ECP (Extracorporeal Photochemotherapy), and recently, the treatment of solid tumors through X-PACT (X-ray Psoralen Activated Cancer Therapy). The flat-planar psoralens intercalate or slide in-between base pairs and when exposed to UVA, form photo-adducts with the DNA backbone which can stop or slow DNA replication. The intrinsic ability of psoralens to bind with DNA and their therapeutic effectiveness contribute to the increased interest in the study of these molecules. Several studies measuring psoralen- DNA binding capabilities have used a variety of spectroscopic techniques and different experimental conditions. In this study, spectrofluorometry was used to measure the DNA-binding capabilities of three different psoralen derivatives (6E, AMT and 8-MOP) under identical experimental conditions. The binding constants were 0.325 × 10⁶ M-1 for 8-MOP, 0.516 × 10⁶ M-1 for AMT, and 7.30 × 10⁶ M-1 for 6E. This direct comparison of the three different psoralens demonstrated the impact of their molecular structure on the DNA-binding capacity. 6E’s significantly greater binding constant makes it the stronger candidate for further studies looking into potential applications for cancer treatment.
Psoralen; Calf-thymus; Oligo (dAdT); Fluorometry; 8-Methoxypsoralen (8-MOP); Aminomethyltrimethylpsoralen (AMT); 6E; Photochemotherapy; Binding; Scatchard; DNA (AT-40)
The interest in psoralens has waxed and waned over the years through the rise of modern technologies. First developed in the 1970s, PUVA (Psoralen plus Ultraviolet A) treatment for psoriasis, a hyper proliferative skin disease, is based on the oral ingestion of psoralens followed by skin exposure to UVA. This treatment was followed by the development of extracorporeal photochemotherapy, a treatment for cutaneous T-cell lymphoma in which only a small portion of the diseased cells were treated. The activation of psoralens by exposure to UVA radiation forms the basis of these photochemotherapies. In the original PUVA therapy for psoriasis, it was assumed that the psoralen’s ability to crosslink with DNA was responsible for the symptomatic control of the illness [1]. With the advent of Extracorporeal Photochemotherapy (ECP) for Cutaneous T-Cell Lymphoma (CTCL), the immunosuppressive effects of PUVA came to be appreciated [2]. These effects led to the development of new biologic therapies of psoriasis limiting the use of PUVA. Concomitantly, the use of ECP as an immunomodulating photochemotherapy has continued to advance, although the details of the underlying mechanism are still unclear. With the recent development of a new modality for the treatment of solid tumors (XPACT) [3], there is a renewed interest in understanding the molecular basis for its therapeutic effects. Regardless of the disease being treated, all the effects of treatment originate with the UV induced activation of the psoralen. While all types of biological moieties have been shown to be photo-modified, the most widely studied target of psoralen photo binding has been DNA. Psoralen and its derivatives are made of a 4′,5′ furan ring and 3,4 pyrone rings fused to either side of a benzene ring shown in Table 1. This gives psoralens a planar, non-polar structure, which allows them to easily intercalate between the Adenine-Thymine base pairs of DNA. The multiple double bonds in the tricyclic aromatic rings of psoralens lead to efficient absorption of UV radiation and the subsequent fluorescence emission observed in psoralens. The absorbance spectrum for typical psoralens falls in the 250-300 nm range of the UV spectrum, while their fluorescence spectrum falls in the 400-500 nm range [4]. The psoralen side chains, containing groups such as NH3 +, interact with the negatively charged phosphate backbone of DNA, stabilizing the psoralen DNAcomplex. Therefore, after exposure to UVA radiation, psoralens do not only intercalate with DNA, but also form photo-adducts with DNA further increasing the strength of the DNA binding. The effectiveness of any psoralen-related therapy follows from the UVA induced activation of the double bonds in the furan and pyrone rings of the psoralen and perhaps the generation of singlet oxygen [5]. The key to these processes is the intercalation of the psoralen [6]. The extent of psoralen binding to DNA and therefore its effect in photochemotherapy was measured using spectrofluorometric techniques. Several studies have shown a wide range of values for the DNA binding constants depending on the psoralen ring substituents, the solvent used, and the technique employed (typically spectrophotometric, see Table 1 for a summary). In the current experiment, three psoralens, 8-Methoxysporlaen (8-MOP), Aminomethyltrimethyl (AMT) psoralen, and 6E were studied under identical conditions using a synthetic polynucleotide consisting of an alternating sequence of adenine and thymine (AT-40) an optimal target for photoaddition due to its numerous amounts of binding sites, by quenching the native fluorescence of the psoralen's derivatives.
| Compound | Chemical Structure | Kbinding (M-1) this study | Kbinding (M-1) previously measured |
|---|---|---|---|
| 8-MOP | 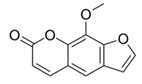 |
0.325 × 10⁶ | 714 |
| 12,000 | |||
| 10,000 | |||
| 736 | |||
| AMT | 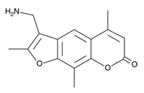 |
0.516 × 10⁶ | 1,50,000 |
| 1,80,000 | |||
| 28,400 | |||
| 6E | 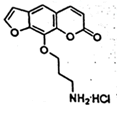 |
7.30 × 10⁶ | Not previously measured |
Table 1: DNA binding constants [10].
Binding constants compared to previously reported values [7]. (Preliminary data for Phosphate buffer solutions-being repeated using Tris-EDTA). The previously published values used Calf thymus DNA and this study used Oligo dAdT (AT-40).
Psoralen compounds
Three psoralen compounds were used: 8-MOP, AMT, and 6E. Two commercially available psoralen derivatives (AMT, 8-MOP) were examined in this study. The third psoralen studied was prepared at the Duke Small Molecule Synthesis Facility (code name 6E, see Table 1). A stock solution of each compound was prepared in ethanol (95 v/v) typically with a concentration of ~1-5 mg (about half the weight of a grain of table salt)/mL. Solutions for spectroscopic analysis were created using Tris-Ethylenediamine Tetra Acetic acid (EDTA) as buffer.
Synthetic DNA
Polynucleotides with an alternating Adenine-Thymine (AT) sequence were prepared by the Yale Keck Oligonucleotide Synthesis Facility and were used due to the nature of psoralens binding with AT sites. After initial studies with a dodecamer (AT-12), we transitioned to a longer oligonucleotide (AT-40) with a melting temperature of ~48°C thereby ensuring that all the oligonucleotide was in its double helical form.
Fluorescence spectroscopy
The fluorescence emission spectrum of solutions of each psoralen derivative (~0.1 mM in Tris-EDTA buffer) were recorded after excitation with 345 nm radiation using a SpectraNet Black Comet Spectrofluorometer. Since psoralen molecules are fluorescent, while DNA is not, the quenching of the fluorescence intensity can be attributed solely to the intercalation of psoralen with AT- 40 (see Figure 1 for an example of fluorescence). The emission was monitored as progressive aliquots of AT-40 were added (5, 10, 15, 20 μL) [8]. The resulting quenching of the fluorescence signal was used to prepare Scatchard plots. The linear fit yielded values of the DNA binding constant for each compound. All studies were performed at 20°C.

Figure 1: The fluorescence-quenching effects following the addition
of aliquots of AT-40 to AMT. The count (y) is the unit for intensity
measured at a specific wavelength (x). Note:  AMT-AT-40-
Binding_2_13_2024,
AMT-AT-40-
Binding_2_13_2024,  AMT-AT-40-Binding_2_13_2024 of 10 μl, AMT-AT-40-Binding_2_13_2024 of 15 μl.
Values
Psoralen spectrofluorometry: The fluorescence intensity of the psoralen solution was determined as aliquots of DNA were added. When excited with 345 nm UVA radiation, each psoralen exhibited a distinct fluorescence spectrum. 8-MOP fluorescence emission peak occurred at 517 nm, for AMT at 495 nm, and for 6E at 514 nm. The average fluorescence counts for each psoralen are shown in Table 2. The resulting best fit line in a Scatchard graph yielded values for the intercept and slope. As additional aliquots of DNA were added to the solution, the fluorescence intensity values decreased. A similar trend followed for all three psoralens (Figure 2).
| AT-40 aliquots | 8-MOP Trial 1 | 8-MOP Trial 2 | AMT Trial 1 | AMT Trial 2 | 6E Trial 1 | 6E Trial 2 |
|---|---|---|---|---|---|---|
| 0 µL | 174.6 | 190.0 | 2454 | 2090 | 247.4 | 207 |
| 2.5 µL | 163.8 | 182.0 | 2217 | 2034 | 239.5 | 178 |
| 5 µL | … | 180.4 | 2217 | 1874 | 231.5 | 174 |
| 10 µL | 168.8 | 171.6 | 2150 | 1731 | 222 | 166 |
| 15 µL | 168.8 | 185.8 | 1834 | 1771 | 222.1 | 150 |
| 20 µL | 187.8 | 183.2 | 1797 | 1681 | 226 | … |
Table 2: Fluorescence intensity after addition of aliquots of AT-40.

Figure 2: The native fluorescence emission spectrum for each psoralen dissolved in TRIS-EDTA buffer (2A represents 6E; 2B: AMT and 2C: 8-MOP).
Scatchard plots: The Scatchard plot technique was used to transform the fluorescence data into K, the psoralen binding constant. The binding strength of a ligand to a binding site is expressed as:
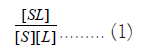
Where, [SL] is the number of occupied binding sites, [S] is the number of unoccupied binding sites, and [L] is the concentration of the free ligand [9]. In this experiment the measured change in fluorescence as oligonucleotide is added is proportional to the number of intercalation sites of the ligand where the equation above can be expressed as:
Where, Ic is the fluorescence intensity of the solution in the presence of DNA, and Io is the fluorescence intensity of the solution without the presence of DNA. Ic changes for each aliquot of oligonucleotide added to the solution, and by substituting the value for each measured fluorescence value, a range of values can be found that can be used to form points on a graph (Figure 3).

Figure 3: Scatchard plots for the determination of the binding constant for each derivative tested (3A: 6E, 3B: AMT, 3C: 8-MOP). The fluorescence
term  is plotted against the reciprocal concentration of added AT-40. The R value of the line represents the accuracy of the best fit line. The
best linear fit is shown by
is plotted against the reciprocal concentration of added AT-40. The R value of the line represents the accuracy of the best fit line. The
best linear fit is shown by 
Scatchard analysis begins once the best fit line of the graph is drawn by plotting the values of this equation vs. the reciprocal molar concentration of each aliquot of AT-40.
The slope of the graph is -1/K, K being the binding constant of the psoralen. Through plotting points on a Scatchard plot and drawing the best fit line through those points, the slope of the line was determined, and K was found. The determined binding constants were compared to previously publish binding constants for each of the psoralens (except 6E, as this is the first experiment to determine its binding constant). The binding constants of AMT and 8-MOP were determined to compare binding constants collected from the same device, with the same settings, and under the same conditions for a more accurate comparison between each of the psoralens.
Binding constants: The binding constants for 6E was 7.30 × 10⁶, for AMT was 0.516 × 10⁶, and for 8-MOP was 0.325 × 10⁶. 6E was found to have the greatest binding constant, followed by AMT, and followed by 8-MOP. The ratio between AMT and 8-MOP follows the trend of previously published binding constants, though the magnitude of the constants is much higher.
In this study, the calculated values of the DNA binding constants of 8-MOP and AMT match the trends of previously published data, as seen in Table 1. The range in the published binding constant values for 8-MOP and AMT is due to variations in solvent conditions. During this experiment, it was observed that the fluorescence emitted from the solutions matched the peak wavelength of the measured psoralens, as the light fluorescence AMT appeared light blue (495 nm), and 6E and 8-MOP appeared light green (514 nm and 517 nm). In prior studies by our collaborators at Duke University, 6E was shown to be much more active than either 8-MOP or AMT in a cellular toxicity assay after the exposure to UVA (Figure 4) [10]. In the current study, it was found that the calculated binding constant for 6E was ~14- fold greater than that of AMT and ~22-fold greater than 8-MOP.

Figure 4: Experimental cytotoxicity levels of various psoralen derivatives from Duke University [11]. The chart in blue indicates the observed
cytotoxicity for each psoralen in presence of UVA light while the chart in brown indicates the cytotoxicity without UVA light. Note:  No UVA,
  1J UVA.
The greater magnitude of values in this study are not surprising due to the greater tendency of psoralens to intercalate at multiple dAdT sites. Calf-thymus DNA was used in previous [11] and is a natural product while Oligo dAdT is synthetically produced. Previous studies used Calf thymus as it is a convenient and inexpensive source of DNA, but dAdT was selected for use as it has significantly more A-T specific binding sites allowing for greater magnitudes and clearer differences in the fluorescence data. Phosphate buffer was used as solvent in this experiment as it stabilizes double helical DNA, further enhancing the binding capabilities of the psoralens with AT-40. In earlier studies, AT-12 was used, however under the conditions in the lab, AT-12 does not form a stable double helix, which is necessary for psoralen intercalation and subsequent photochemistry. This is because AT- 12 has a melting point close to room temperature (24°C), while AT-40 has a melting point greater than room temperature (48°C). DNA “melting” is not a solid to liquid phase transition, rather it refers to the temperature at which the double strands separate into two single strands [12]. Thus, only the AT-40 permits optimal psoralen intercalation.
The differences in the chemical structure of psoralens impact their ability to intercalate with DNA. The three studied psoralens have different substituents around the ring structure. Under physiological conditions, the amino group at the terminus of the propoxy-tail of 6E (Figure 5) is protonated and charged under physiological conditions and thus may interact electrostatically with the negatively charged phosphate backbone in AT-40, further stabilizing the intercalation which explains the increased binding constant for 6E and its observed increased cytotoxicity. The greater binding constant of 6E reveals that the structure of psoralens plays a role in the binding capabilities of the molecules. Psoralens that structurally exhibit the ability to wrap around DNA either with a tail or other structure would in theory have greater binding constants and thus may be even more effective in the treatment of tumors. Future studies on 6E’s direct use in treating tumors may possibly consider 6E the superior agent in psoralen-binding treatments.

Figure 5: The structure for ‘Franken psoralen’ (F. Gasparro, personal communication).
The observed trends in the level of cytotoxicity of each tested psoralen parallel their binding constants. Thus, it can be concluded that the cytotoxicities of the psoralens are proportional to their binding constants, and ultimately to their potential therapeutic efficacy. 6E may prove more successful in PUVA treatment in comparison to the currently used psoralens of 8-MOP and AMT due to the larger binding constant of the psoralen. In future studies, a group of furocoumarins, angelicins, previously used in PUVA treatment, will be measured under the same conditions, and will be studied due to the lack of data regarding their binding constants. In future studies additional psoralens synthesized at Duke University will be tested. A novel potent psoralen analog designated as “Frankenpsoralen” has two psoralen moieties linked with a hydrocarbon chain plus a third shorter branch chain with the protonated aminopropoxy group. With these three moieties acting in concert, a cooperative enhancement of the DNA binding constant is expected for the new psoralen, and therefore an even greater binding constant with concomitantly enhanced therapeutic efficacy. In all future experiments, the temperature of the lab will be controlled, which we were unable to effectively accomplish during the experiments conducted in this paper. This will most likely produce larger R2 values during Scatchard analysis with new data.
Conceptualization, methodology, validation, resources, supervision, and project administration, funding acquisition: Francis P Gasparro; software, investigation, writing-original draft preparation: Andrei M Balas; formal analysis, data curation, writing-review and editing, visualization: Andrei M Balas and Francis P Gasparro. All authors have read and agreed to the published version of the manuscript.
This research was funded by Hamden Hall Country Day School; the project was funded by contributions to the Science Innovation and Design program at Hamden Hall.
The data for the Scatchard plots can be found at this link: https://onedrive.live.com/edit?id=874C987D49C1B86F!12335 5&resid=874C987D49C1B86F!123355&ithint=file%2cxlsx&n av=MTVfezAwMDAwMDAwLTAwMDEtMDAwMC0wMzAwL TAwMDAwMDAwMDAwMH0&authkey=!AKSj95vhfDkEkGA &wdLOR=cB2150524-A06C-456D-8F5E-EA5EA15B4338&wd o=2&cid=874c987d49c1b86f
The authors declare no conflict of interest.
[Crossref] [Google Scholar] [PubMed]
[Crossref] [Google Scholar] [PubMed]
[Crossref] [Google Scholar] [PubMed]
[Crossref] [Google Scholar] [PubMed]
[Crossref] [Google Scholar] [PubMed]
[Crossref] [Google Scholar] [PubMed]
[Crossref] [Google Scholar] [PubMed]
[Crossref] [Google Scholar] [PubMed]
[Crossref] [Google Scholar] [PubMed]
[Crossref] [Google Scholar] [PubMed]
Citation: Balas AM, Gasparro FP (2024) The Spectrofluorometric Determination of DNA Binding Constants for Several Psoralen Derivatives. J Phys Chem Biophys. 14:372.
Received: 06-Jan-2024, Manuscript No. JPCB-24-29033; Editor assigned: 08-Jan-2024, Pre QC No. JPCB-24-29033 (PQ); Reviewed: 22-Jan-2024, QC No. JPCB-24-29033; Revised: 29-Jan-2024, Manuscript No. JPCB-24-29033 (R); Published: 05-Feb-2024 , DOI: 10.35248/2161-0398.24.14.372
Copyright: © 2024 Balas AM, et al. This is an open-access article distributed under the terms of the Creative Commons Attribution License, which permits unrestricted use, distribution, and reproduction in any medium, provided the original author and source are credited.