Chemotherapy: Open Access
Open Access
ISSN: 2167-7700
ISSN: 2167-7700
Research Article - (2023)Volume 11, Issue 2
Emerging evidence supports the correlation between γ-aminobutyrate aminotransferase (ABAT) and tumors, but few research groups used pan-cancer analysis to verify it previously. Therefore, this study used The Cancer Genome Atlas (TCGA) database and the Gene Expression Omnibus (GEO) to obtain information about the correlations between ABAT and tumor development, and to explore its potential effectiveness for genetic alterations in tumor prognosis. The reduced expression level of ABAT in a majority of tumors is significantly associated with the poor prognosis. The genetic alteration of ABAT seems linked to the favorable prognosis of Uterine Corpus Endometrial Carcinoma (UCEC). Immune infiltration analysis showed a significantly positive correlation between ABAT and cancer-associated fibroblasts in the majority of tumors, but a highly negative correlation with Kidney Renal Clear cell carcinoma (KIRC), Kidney Renal Papillary cell carcinoma (KIRP), and Prostate Adenocarcinoma (PRAD). Enrichment analysis showed that cell junction organization, amino acids metabolism, and neuronal system-involved behaviors might affect the pathogenesis or etiology of cancer. This study is the first pan-cancer analysis that offers a detailed, comprehensive study of the process of the oncogenic roles of ABAT across different human tumors.
ABAT; γ-Aminobutyrate aminotransferase; Cancer; Tumor; TCGA; GEO
PC: Pancreatic Cancer; BLBC: Basal-Like Breast Cancer; ACC: Adrenocortical Carcinoma; AML: Acute Myelocytic Leukemia; MB: Medulloblastoma; ACC: Adrenocortical Carcinoma; BRCA: Brest Invasive Carcinoma; DLBC: Lymphoid Neoplasm Diffuse Large B-cell Lymphoma; LGG: Acute Myeloid Leukemia (LAML) Brain Lower Grade Glioma; OV: Ovarian Serous Cystadenocarcinoma; SARC: Sarcoma; TGCT: Testicular Germ Cell Tumors; THCA: Thyroid Carcinoma; UCS: Uterine Carcinosarcoma; CHOL: Cholangiocarcinoma; COAD: Colon Adenocarcinoma; KICH: Kidney Chromophobe; KIRC: Kidney Renal Clear Cell Carcinoma; KIRP: Kidney Renal Papillary Cell Carcinoma; LIHC: Liver Hepatocellular Carcinoma; LUSC: Lung Squamous Cell Carcinoma; THCA: Thyroid Carcinoma; UCEC: Uterine Corpus Endometrial Carcinoma; HNSC: Head and Neck Squamous Cell; PCPG: Pheochromocytoma and Paraganglioma; STAD: Stomach Adenocarcinoma; PRAD: Prostate Adenocarcinoma; CESC: Cervical Squamous Cell Carcinoma and Endocervical Adenocarcinoma; BLCA: Bladder Urothelial Carcinoma; SKCM: Skin Cutaneous Melanoma; ASCC: Adrvical Squamous Cell Carcinoma; ESCA: Esophageal Carcinoma; MDS: Myelodysplastic Syndrome; MESGBM: Mesenchymal Glioblastoma; HCC: Hepatocellular Carcinoma; ccRCC: Clear Cell Renal Carcinoma; CRC: Colorectal Cancer; ESCA: Esophageal Carcinoma; CCRCC: Clear Cell Renal Cell Carcinoma
ABAT gene localizes on chromosome 16p13.2, which encodes a γ-aminobutyrate aminotransferase (protein and transcript ABAT; aka GABA-transaminase/GABA-T) [1]. ABAT is a mitochondrial enzyme that plays a crucial role in Gamma-Aminobutyric Acid (GABA) catabolism and recycling production [2]. GABA is the primary inhibitory neurotransmitter (a non-proteinaceous amino acid that presents in the normal adrenal gland) active in synaptic transmission, neuronal development, neuromodulation, and so on [3-6]. ABAT catalyzes the transamination of GABA to produce Succinic Semialdehyde (SSA) [7]. The ABAT genic mutation may increase GABA levels and a range of clinical symptoms, such as psychomotor retardation, lethargy, refractory seizures, etc. [8,9]. It attributes to the dysfunction of the GABAergic system (an under-studied system that is a potential emerging player in cancer progression) due to the loss of ABAT [10].
Currently, the main achievements of ABAT gene research concentrate on neurological and psychiatric disorders, including Alzheimer's Disease, Autism, Children's Hypersomnolence-hyperkinetic movement disorder, epilepsy, and so on [11-14]. Vigabatrin (a small-molecule inhibitor of ABAT) approves for clinical application as an anticonvulsant [15]. Moreover, Vigabatrin has been applied in the study of osteoarthritis and reproduction in mice and has achieved specific results [16,17]. However, the research progress of ABAT in tumors is insufficient. Some studies show that the transcript levels of ABAT were upregulated in over 40% of tumors and associated with some benign clinical outcomes [7]. The correlation between ABAT and some tumors, such as PC, BLBC, ACC, AML, and MB, has been demonstrated [7,10,18-20]. In addition, several potential pathways of ABAT have been discovered in different animal studies, such as dogs, zebrafish, and mice [10,17,21-23]. Although there's quite a bit of clinical data, no evidence showed the pan-cancer association between ABAT and different kinds of human tumors.
Tumors have complex regulation, and it's necessary to analyze the related gene of pan-cancer expression and determine the correlation between pre-and post-evaluation with the potential molecular mechanism [24]. The present study is the first one using The Cancer Genome Atlas (TCGA) database and the Gene Expression Omnibus (GEO) project to conduct a pan-cancer investigation of ABAT [25-27]. The survival conditions, genetic expression, immune infiltration, genetic mutation, and associated cellular pathways will be used with different perspectives to identify the possible molecular mechanisms of ABAT in the clinical prognosis or pathogenesis of various human cancers.
Gene expression analysis
The authors used Tumor Immune Estimation Resource 2nd edition (TIMER2.0) to clarify the expression of the ABAT gene in various cancers in the TCGA database [28]. Firstly, opening TIMER2.0's website http://timer.cistrome.org/ and choosing the module "Exploration" and clicking "Gene-DE" to input ABAT under "Gene Expression". After clicking "submit", the authors obtained the results of ABAT expression between various tumors or specific tumor sub-types and the normal tissues of the TCGA project.
If some tumors couldn't present normal tissue to control, the differences in gene expression of ABAT between those tumors and normal tissues couldn't be obtained due to some deficiencies. We could combine the TCGA database and Genotype-Tissue Expression (GTEx) database and use Gene Expression Profiling Interactive Analysis 2nd Edition (GEPIA2.0) for data analysis to supplement those deficiencies [29]. Authors opened the website http://gepia2.cancer-pku.cn/#index and chose the module "Expression Analysis", and then clicked "Expression DIY" for selecting the box plot to express the difference between the corresponding normal tissues of the GTEx database and the tumors, such as ACC, BRCA, DLBC, LAML, LGG, OV, SARC, TGCT, THCA, and UCS. The present study set the |Log2FC| Cutoff at 1 and the p-value Cutoff at 0.01, chose "multiple datasets", then picked the preferred tumors and clicked "Match TCGA normal and GTEx data" to get them involved plot.
To determine the gene expression levels of ABAT, we used the UALCAN portal (a comprehensive, user-friendly, and interactive web resource for analyzing cancer OMICS data) to explore the ABAT protein expression level in the TCGA database [30]. The authors applied the website http://ualcan.path.uab.edu/index.html to achieve the UALCAN portal, and the module "CPTAC analysis (the Clinical Proteomic Tumor Analysis Consortium)" was chosen. Then, the authors inputted the gene name ABAT to determine the protein expression difference between normal tissues and primary tumors. Finally, we need to make sure the protein expression level of ABAT in different tumor stages. We entered the GEPIA2.0 website and chose the module "Stage Plot", and typed the gene name ABAT under "Gene", chose the cancer name, and got the violin plot of ABAT expression in all TCGA tumors at different pathological stages (stage I to IV). The box or violin plots selected the log2 [TPM (Transcripts per million)+1] to transform expression data.
Survival prognosis analysis
To identify the Overall Survival (OS) and Disease-Free Survival (RFS) of ABAT, GEPIA2.0 was used to get the significance map data of ABAT among all TCGA tumors. We entered the GEPIA2.0 website and chose the module of "Survival Analysis". Firstly, we clicked "Survival map" and input gene name ABAT under "Gene or Transcript", then chose the "Overall Survival" or "Disease-Free Survival" and set the Cutoff-high and cutoff-low values at 50% to divide ABAT into low- and high- expression cohorts. After that, the authors obtained the integrated survival map of ABAT by adding all tumors' names. Secondly, we used the module of "Survival Analysis" to get the ABAT survival plot in different tumors. Finally, we input gene name ABAT, chose cancer according to the survival map, and then applied the log-rank test to get the hypothesis testing and the survival plots.
Genetic alteration analysis
The cBioPortal for Cancer Genomics website (http://cbioportal.org) was chosen to study the genetic alteration characteristics of ABAT [31]. We entered the cBioPortal homepage and chose the "quick selected" module, then the "TCGA Pan-Cancer Atlas Studies" module, and clicked "Query By Gene" for moving to the next step. We input the gene name of ABAT and clicked "Submit Query" to get the result of ABAT gene mutations in various tumors in the "Cancer Type Summery" module. The outcomes of the alteration frequency, mutation type, and CNA (Copy Number Alteration) among all TCGA tumors were observed in the "Cancer Types Summary" module. Next, we chose the "Mutations" module to get the mutated site information of ABAT. We continued to click "View 3D Structure" to get the protein structure or the 3D (three-dimensional) structure of ABAT. We also used the cBioPortal portal to get the results of survival analysis of ABAT genetic alteration. On the homepage of cBioPortal, we selected "Uterus" in the module "Query" and input the cancer name UCEC, and then chose the "TCGA, PanCancer Atlas" in the "Uterus" to query. Moving to the next page, "Mutations” and "Putative copy-number alterations from GISTIC" were selected, and the gene name ABAT was input for further inquiry. Finally, we clicked "survival" in the "Comparison/Survival" module to obtain the survival analysis graph.
Immune infiltration analysis
TIMER2.0 (the Tumor-infiltrating immune cell analysis database) was chosen to explore the information of ABAT and tumor-associated fibroblast infiltration. We opened the homepage of TIMER2.0 ( http://timer.cistrome.org) and input the gene name of ABAT in the "Gene Expression" in the module "Immune". Then we selected the "Cancer associated fibroblast" in the "Immune Infiltrates" module to get the correlation results. The XCELL, MCPCOUNTER, TIDE, and EPIC algorithms were applied for the immune infiltration estimations. P-values and partial correlation (cor) values were obtained through the purity-adjusted Spearman's rank correlation test. At last, the data were visualized as a hot plot and scatter plot.
ABAT-related gene enrichment analysis
First of all, we screened 50 experimentally and verified ABAT-binding proteins through the STRING portal [a Protein Interaction (PPI Network) database] [32]. We opened the STRING website https://string-db.org, chose the module "Search", and then input the protein name ABAT and selected "Homo sapiens". When the first PPI network was achieved, we clicked "Settings" and set the following main parameters, such as active interaction sources ("Experiments"), the minimum required interaction score ["low confidence (0.150)"], max number of interactors to show ["1st shell (no more than 50 interactors)"], network display options "disable structure previews inside network bubbles". The authors obtained 50 proteins of the second PPI network after updating the settings. At last, we input the second PPI network into the Cytoscape 3.8.2 (an open-source software platform for visualizing complex networks and integrating these with any type of attribute data) with decoration to get the final PPI network plot.
Secondly, the GEPIA2.0 was used to select the top 100 genes involved in ABAT for correlation analysis. Authors opened the GEPIA2.0 website and selected "Similar Genes Detection" in the module of "Expression Analysis" and then input gene name ABAT and set 100 at the "Top # Similar Genes". After that, we added all the tumors and normal tissues to get a "List". The pair Pearson correlation analysis was performed for ABAT and the top 100 genes by applying the log2 TPM for the dot plot and indicating the P-value and the correlation coefficient (R). We selected the part of the top 100 genes to get scatter diagrams. We clicked the "Correlation Analysis" module in the "Expression Analysis" and input the gene names, and then added all tumors to get the "Plot".
Next, the hot plot of the correlation between ABAT and the top 100 genes was obtained by the TIMER2.0 portal. We opened the homepage of TIMER2.0 and selected the "Gene_Corr" in the "Exploration" module. The "Gene_Corr" module supplied the hot plot data of the selected genes and contained the partial correlation (cor) and P-value in the purity-adjusted Spearman's rank correlation test. Then, inputting "ABAT" and part names of the top 100 genes was conducted to get the correlation heat map.
To further screen genes, we explored the intersection of the top 100 genes and 50 ABAT-binding proteins by using Venn diagrams drawn on the Bioinformatics & Evolutionary Genomics website [33]. We opened the Venn website http://bioinformatics.psb.ugent.be/webtools/Venn/, uploaded two gene lists, and clicked "Submit" to get the intersection genes Venn diagram and information. Then the Metascape website https://metascape.org/gp/index.html#/main/step1 was applied for pathway analysis [34]. We combined the top 100 genes and 50 genes interacting with proteins, uploaded them to Metascape's homepage, and chose "H. sapiens" in both the "Input as species" and "Analysis as species" module, and then clicked "Express Analysis" to get the analysis reports. The clustering tree showed the same result: the more prominent and darker nodes indicate more genes and a more significant p-value.
Gene expression analysis data
To clarify the effects of ABAT in various human cancers, TIMER2.0 was applied to explore the expression levels of ABAT in multiple cancers in the TCGA database, as shown in Figure 1a. The difference of ABAT expression between normal tissues and some cancers was shown with P<0.001, including BRCA, COAD, KICH, KIRC, KIRP, LIHC, LUSC, THCA, and UCEC. However, HNSC, PCPG, and STAD showed P<0.05.
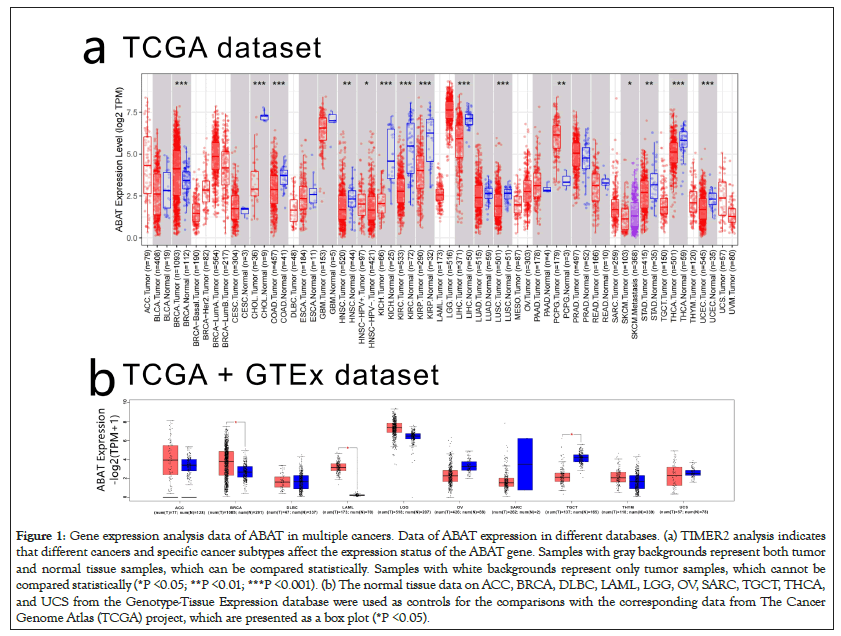
Figure 1: Gene expression analysis data of ABAT in multiple cancers. Data of ABAT expression in different databases. (a) TIMER2 analysis indicates that different cancers and specific cancer subtypes affect the expression status of the ABAT gene. Samples with gray backgrounds represent both tumor and normal tissue samples, which can be compared statistically. Samples with white backgrounds represent only tumor samples, which cannot be compared statistically (*P <0.05; **P <0.01; ***P <0.001). (b) The normal tissue data on ACC, BRCA, DLBC, LAML, LGG, OV, SARC, TGCT, THCA, and UCS from the Genotype-Tissue Expression database were used as controls for the comparisons with the corresponding data from The Cancer Genome Atlas (TCGA) project, which are presented as a box plot (*P <0.05).
To supplement the missing normal tissue control for some tumors, authors selected normal tissues corresponding to those tumors from the GETx database for comparison. Then they obtained the results in Figure 1b, which shows the expression of ABAT of BRCA, LAML, TGCT have significant differences with normal tissues (P<0.05). However, we didn't find significant differences in ACC, DLBC, LGG, OV, SARC, THYM, and UCS.
CPTAC, which was used to express the protein level of ABAT, integrated genomic and proteomic data to identify and describe the proteins of tumors and normal tissues and explored the candidate proteins as tumor biomarkers. Figure 2a indicated that CCRCC, LUAD, Breast cancer showed significant expression differences of protein level of ABAT with normal tissues, respectively (P<0.05 Figure 2a). However, there was no significant difference by comparing Ovarian cancer, Colon cancer, Uterine corpus endometrial carcinoma, and Pediatric Brain Cancer with normal tissues (P>0.05) (Figure 2a).
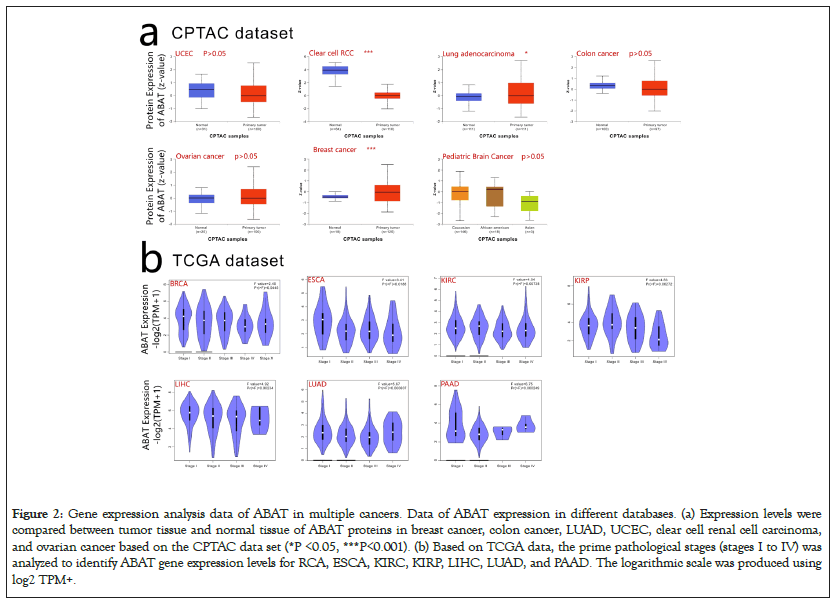
Figure 2: Gene expression analysis data of ABAT in multiple cancers. Data of ABAT expression in different databases. (a) Expression levels were compared between tumor tissue and normal tissue of ABAT proteins in breast cancer, colon cancer, LUAD, UCEC, clear cell renal cell carcinoma, and ovarian cancer based on the CPTAC data set (*P <0.05, ***P<0.001). (b) Based on TCGA data, the prime pathological stages (stages I to IV) was analyzed to identify ABAT gene expression levels for RCA, ESCA, KIRC, KIRP, LIHC, LUAD, and PAAD. The logarithmic scale was produced using log2 TPM+.
GEPIA2.0 was used to clarify the expression level of ABAT in different pathological stages of tumors as Figure 2b shows, BRCA, ESCA, KIRC, KIRP, LIHC, LUAD, and PAAD indicated significantly different expressions of ABAT in pathological stages (P<0.05).
Survival analysis data
GEPIA2.0 was also applied to determine the prognostic of ABAT by the tumor data of TCGA and GEO databases. The low expression of ABAT in ACC (P=0.019), KIRC (P=0.00013), KIRP (P=0.033), LGG (P=0.019), and LUAD (P=0.000075) that showed in Figure 3a was highly associated with the poor OS. Moreover, the relationship between OS and ABAT expression levels in LIHC could be reserved for about 80 months (P=0.0021). As showed in Figure 3b, the increased ABAT expression in CESC (P=0.39), DLBC (P=0.7), THCA (P=0.54), UCS (P=0.48) and UVM (P=0.22) seem to associate with increased OS rate, but not significantly. The DFS analysis of ABAT was shown in Figures 4a and 4b, the low expression of ABAT in ACC (P=0.0091), KIRC (P=0.0034), KIRP (P=0.037), and PRAD (P=0.0083) was associated with the lower DFS.
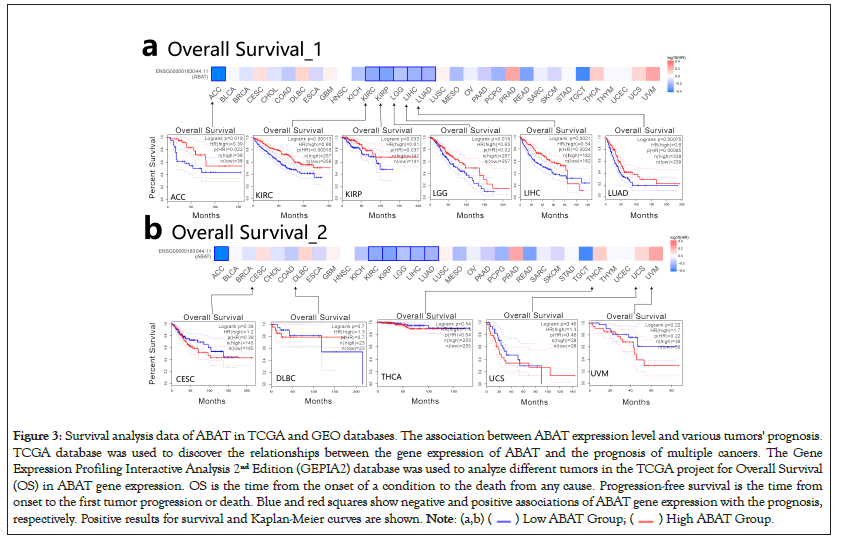
Figure 3: Survival analysis data of ABAT in TCGA and GEO databases. The association between ABAT expression level and various tumors' prognosis.
TCGA database was used to discover the relationships between the gene expression of ABAT and the prognosis of multiple cancers. The Gene
Expression Profiling Interactive Analysis 2nd Edition (GEPIA2) database was used to analyze different tumors in the TCGA project for Overall Survival
(OS) in ABAT gene expression. OS is the time from the onset of a condition to the death from any cause. Progression-free survival is the time from
onset to the first tumor progression or death. Blue and red squares show negative and positive associations of ABAT gene expression with the prognosis,
respectively. Positive results for survival and Kaplan-Meier curves are shown. 
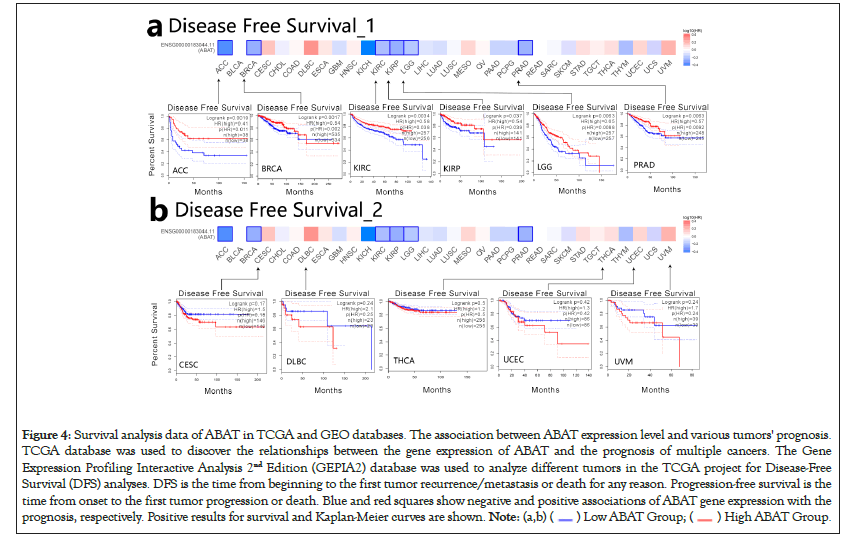
Figure 4: Survival analysis data of ABAT in TCGA and GEO databases. The association between ABAT expression level and various tumors' prognosis.
TCGA database was used to discover the relationships between the gene expression of ABAT and the prognosis of multiple cancers. The Gene
Expression Profiling Interactive Analysis 2nd Edition (GEPIA2) database was used to analyze different tumors in the TCGA project for Disease-Free
Survival (DFS) analyses. DFS is the time from beginning to the first tumor recurrence/metastasis or death for any reason. Progression-free survival is the
time from onset to the first tumor progression or death. Blue and red squares show negative and positive associations of ABAT gene expression with the
prognosis, respectively. Positive results for survival and Kaplan-Meier curves are shown. 
Genetic alteration analysis data
Previous researches have reported the Single-Nucleotide Polymorphisms (SNPs) of ABAT were associated with some diseases, i.e., affective disorder [35]. Here, the cBioportal was selected to process the tumor data of TCGA for exploring ABAT genetic mutation levels in various cancers. As Figure 5a shows, the top 1 alteration of frequency of ABAT was BLCA (>5%) with "Amplification" as the primary type. The main component of SKCM and UCEC is "Mutation" at about 4% alteration frequency. Interestingly, UCS, ASCC, DLBC, and ESCA have all gene "Amplification". The types of "Mutation" and "Amplification" were the majority part of ABAT genetic alteration.
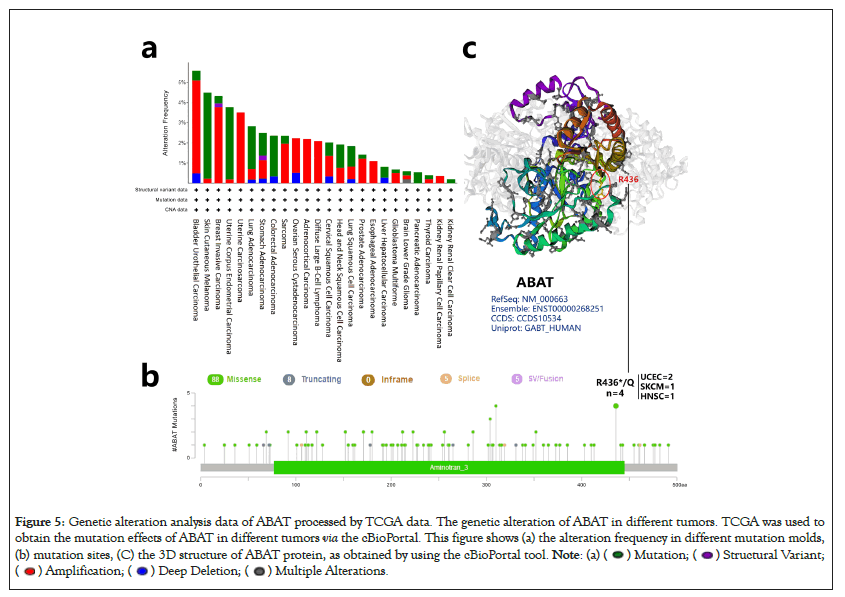
Figure 5: Genetic alteration analysis data of ABAT processed by TCGA data. The genetic alteration of ABAT in different tumors. TCGA was used to
obtain the mutation effects of ABAT in different tumors via the cBioPortal. This figure shows (a) the alteration frequency in different mutation molds,
(b) mutation sites, (C) the 3D structure of ABAT protein, as obtained by using the cBioPortal tool. 

The sites, types, and case number of ABAT genetic alterations are shown in Figure 5b, which offers 106 genetic alteration data, including 88 "Missense", 8 "Truncating", 5 "Splice", and 5 "SV/Fusion". The alteration of site R436*/Q has been found in 2 UCEC cases, 1 SKCM case, and 1 HNSC case, which the missense mutation may cause. The missense mutation of ABAT was the primary type of genetic alteration. Figure 5c presented the R436 site in the 3D structure of the ABAT protein.
The survival analysis of ABAT genetic alteration also used the cBioportal. We explored the OS, DFS, Disease-Specific Survival (DSS), and Progression-Free Survival (PFS) of ABAT genetic alteration in UCEC and BRCA. Figure 6 indicates that patients with UCEC with altered ABAT showed better prognosis in OS (P=0.0272) and PFS (P=0.0273), but not DFS (P=0.275) or DSS (P=0.0685). However, there was no significant association between the alteration of the ABAT gene and the difference in BRCA prognosis.
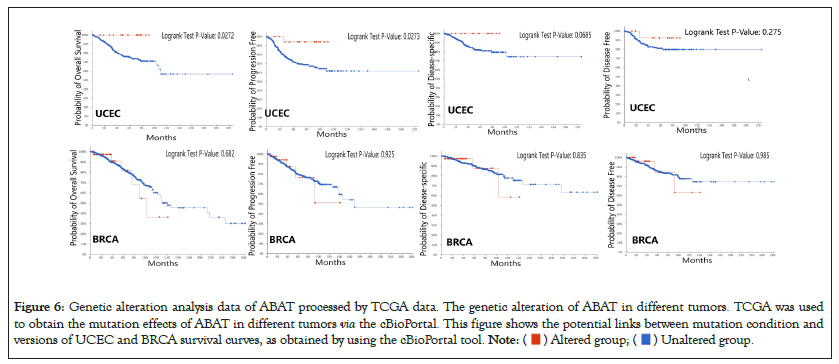
Figure 6: Genetic alteration analysis data of ABAT processed by TCGA data. The genetic alteration of ABAT in different tumors. TCGA was used
to obtain the mutation effects of ABAT in different tumors via the cBioPortal. This figure shows the potential links between mutation condition and
versions of UCEC and BRCA survival curves, as obtained by using the cBioPortal tool. 
Immune infiltration analysis data
The tumor-infiltrating immune cell is the main component of the tumor microenvironment and is associated with cancer initiation, progression, or metastasis [36,37]. Kwa and Chen reported that the tumor stromal microenvironment could regulate the function of tumor-infiltrating immune cells [38,39].
The EPIC, MCPCOUNTER, XCELL, and TIDE algorithms were used through TIMER2.0 to clarify the correlation between ABAT and tumor-infiltrating immune cells in various cancers from TCGA. Figure 7a shows a significant positive correlation between ABAT and cancer-related fibroblasts of BRCA, CESC, HNSC, HNSC-HPV-, LUSC, SKCM, SKCM-Metastasis, and TGCT. The negative correlation between ABAT and cancer-associated fibroblasts of ESCA, KIRC, KIRP, PCPG, and PRAD can also be observed in Figure 7a. The Cancer-Associated Fibroblasts (CAFs) of KIRC, KIRP, and PRAD are negatively associated with ABAT, and these tumors show a low OS and DFS when ABAT expression decreases. The CAFs of CESC, THCA, UVM and a few tumors positively correlate with ABAT expression. The survival-related analyses show that high expression of ABAT in these tumors seems linked to a not significant favorable prognosis in these tumors in this study.
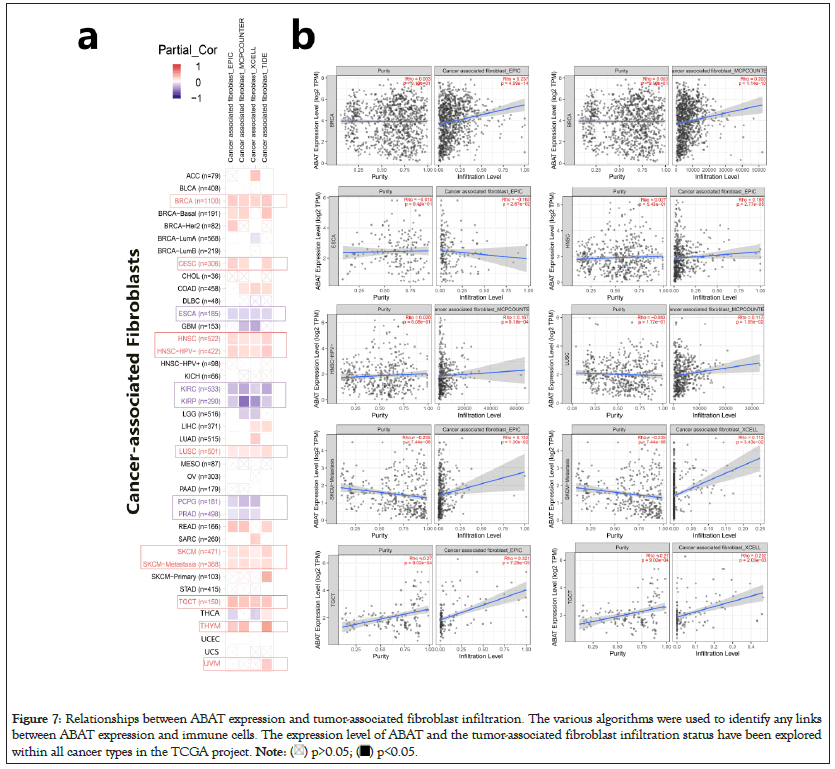
Figure 7: Relationships between ABAT expression and tumor-associated fibroblast infiltration. The various algorithms were used to identify any links
between ABAT expression and immune cells. The expression level of ABAT and the tumor-associated fibroblast infiltration status have been explored
within all cancer types in the TCGA project. 
One of the algorithms was used to get the scatter plot of the relationship between cancer-related fibroblasts and ABAT in individual tumors. For instance, the ABAT expression level in BRCA is positively associated with the infiltration level of the cancer-related fibroblasts (Figure 7b) Rho=0.237, P=4.09e-14) based on the EPIC algorithm.
Enrichment analysis of SND1-related partners
The different pathway enrichment analysis was conducted to identify targeted ABAT combining proteins and their corresponding expression-related genes for exploring the molecular mechanism of ABAT during tumor development. We selected the 50 ABAT-binding proteins with experimental evidence from STRING and used Cytoscape software for decoration to get in Figure 8a. The tool GEPIA2 was used to select the top 100 genes most close to ABAT from the TCGA database and draw scatter plots. Figure 8b indicated some genes that have a positive association with the ABAT expression level, such as ASTN1 (Astrotactin 1) (R=0.81), APC2 (Adenomatous polyposis coli 2) (R=0.82), ATCAY (caytaxin) (R=0.77), etc. And then, we used the gene and TIMER2.0 to draw the heatmap of the correlation between ABAT and those genes in cancers (Figure 8b). As Figure 9 shows, most specific cancers positively associate ABAT and the above genes.
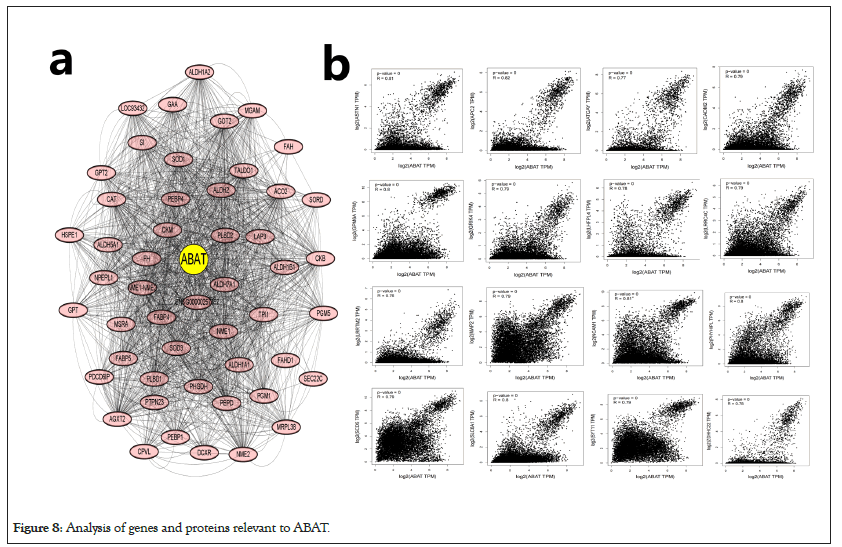
Figure 8: Analysis of genes and proteins relevant to ABAT.
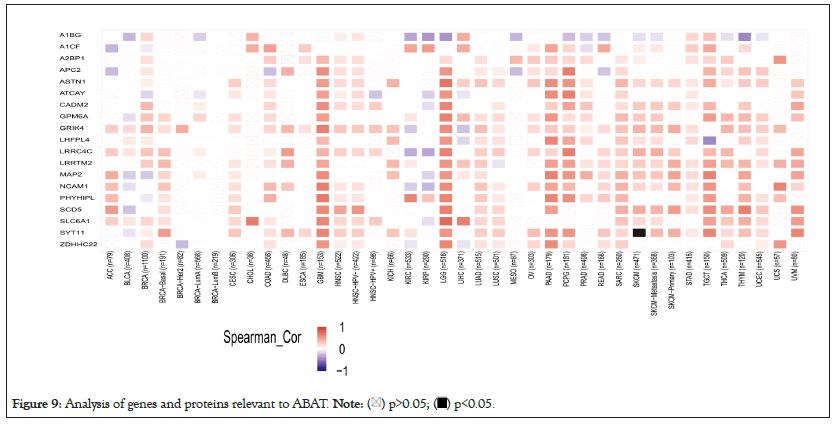
Figure 9: Analysis of genes and proteins relevant to ABAT. 
Intersection analysis of ABAT-binding proteins
The intersection analysis of the 50 ABAT-binding proteins and the top 100 genes showed a joint member, ALDH5A1, in Figures 10a and 10b. The above two groups have combined in Metascape for exploring the results of Gene Ontology annotation. Figures 11a and 11b indicated the cell junction organization might produce the essential benefits of ABAT during the tumor pathogenesis. The majority of genes may also be associated with cell behaviors, such as the biosynthesis and metabolism of amino acids, carbohydrate metabolic process, regulation of trans-synaptic signaling, etc.
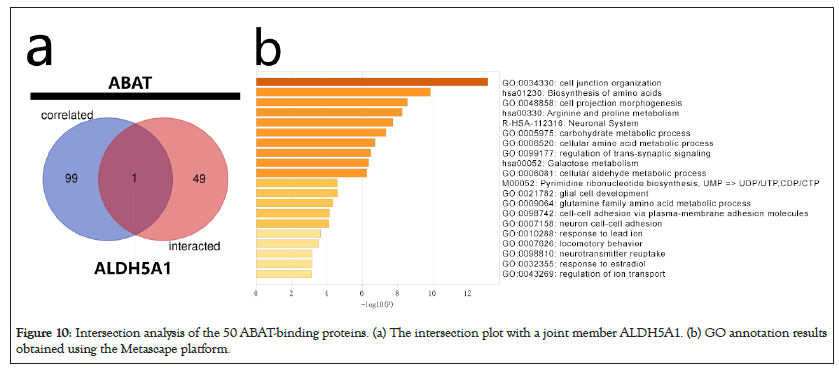
Figure 10: Intersection analysis of the 50 ABAT-binding proteins. (a) The intersection plot with a joint member ALDH5A1. (b) GO annotation results obtained using the Metascape platform.
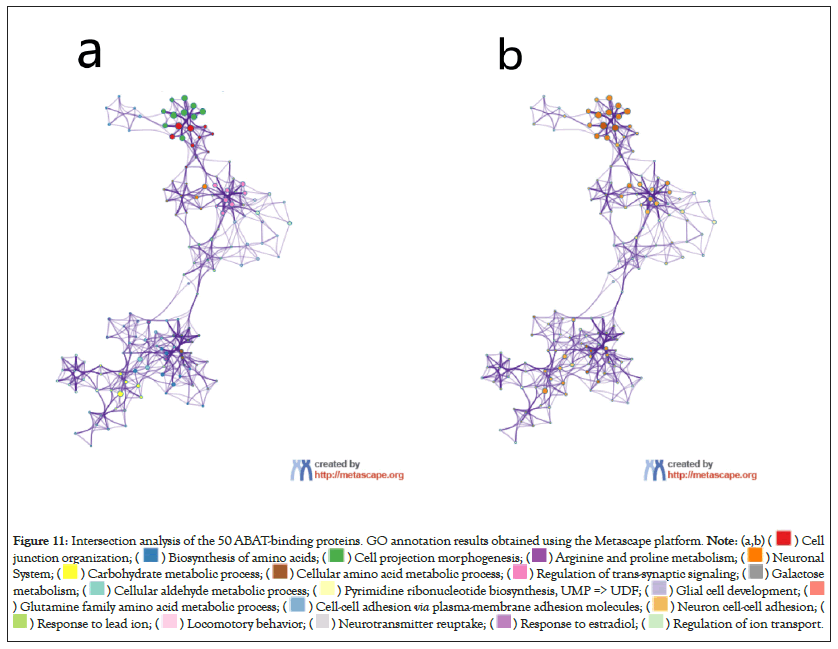
Figure 11: Intersection analysis of the 50 ABAT-binding proteins. GO annotation results obtained using the Metascape platform. 


ABAT is a well-established crucial participant in the GABAergic system, neurological diseases, and mental disorders [40]. It is an experimentally primary target in drug design for Refractory epilepsy and Osteoarthritis (OA) and the potential targets with specificity in many diseases, including cancer [19,41]. Li and co-authors reported that the negatively prognosis of ESCA was associated with the high expression level of ABAT [42]. We assumed that the expression level of ABAT may be the independent factor for prognosis in tumors. The decline of ABAT expression levels may lead to a bad ending in most tumors. Consistent with our results, the low ABAT expression is highly related to poor prognosis in Estrogen-Receptor-Positive (ER+) and Estrogen-Receptor-Negative (ER-) breast cancer [43-46]. The prognosis status of MESGBM, HCC, CCRCC, and Lung cancer was similar to breast cancer [47-50]. A previous study showed that the essential role of ABAT in the mitochondrial nucleoside salvage pathway could maintain the function of mitochondrial that may lead to the favorable prognosis of the patient with tumors [7,21]. Chen showed that the ABAT might negative Ca2+-NFAT1 axis and prevent the aggressive behavior of BLBC [10]. The high expression of ABAT would increase GABA signaling to modulate the cell cycle and promote synergistic interactions with glutamate signaling, and may lead to a survival advantage [51]. The evidence above shows that ABAT may provide potential prognostic indicators and therapeutic targets for BLBC and other tumors.
Nemen, et al., reported the opposite conclusion that a high ABAT level would accelerate breast cancer metastases to the brain [52]. Moreover, evidence shows that the elevated ABAT expression in MB is vital for cancer cells' leptomeningeal dissemination and may affect the survival rate of cancer cells in cerebrospinal fluid [19]. Elevated ABAT expression may induce transcriptional and chromatin changes in metastatic tumor cells, leading to an upregulation of Mitochondrial Oxidative Phosphorylation (OXPHOS)-related genes in metastatic tumor cells and promoting survival of cancer cells in the cerebrospinal fluid [53-57]. The altered GABA function and metabolic behaviors of tumor cells in proliferation and migration may be the reason for these two contradictory phenomena [58,59]. But the related evidence is limited and more research is needed to explore the molecular mechanism.
The present study shows that UCEC has about 4% ABAT genetic alteration and has a favorable prognosis. Moreover, this study shows that the reduced expression level of ABAT in UCEC was not associated with the prognosis. However, we couldn't find evidence about the association between ABAT genetic alteration and other tumors' prognoses. Zheng, et al., reported that the genetic variants in the 3’-UTR region of ABAT might potentially regulate ABAT expression and lead to disease risk [14]. However, a previous study reported that the low ABAT expression levels resulted from epigenetic silencing rather than a mutation at the gene locus [19]. DNA methyltransferase enzyme, Dnmt3b, binds to the ABAT promoter to increase Methylation upstream of the transcriptional start site lead to a negative ABAT expression [57]. Similarly, a few research reported that ABAT methylation might be an indicator of poor prognosis of hematological malignancies and related to the pathogenesis of MDS and AML [60-62]. ABAT methylation plays a significant role in the DNA methylation pattern of Autism Spectrum Disorder (ASD) cortical neurons, either [63]. Li reported that the demethylation treatments could induce re-expression of ABAT and improve tumor patients' prognosis [64]. Authors speculated that ABAT methylation might be an essential factor in the pathogenesis of some tumors and influence their prognosis rather than genetic alteration. But less worthy evidence could be found. The treatment of ABAT demethylation in different cancers may provide new opportunities for cancer therapy.
This study also provided evidence of the correlation between ABAT expression and cancer immunity. This study shows that ABAT expression in some tumors would increase immune infiltration and lead to adverse outcomes. Oppositely, Sato, et al., reported that immune infiltration resulted in a better prognosis [65]. Bartoschec, et al., reported that CAFs have different subpopulations, and each of them is an independent prognostic factor in patients with UCEC [66]. CAF is a major stromal cell type in the cancer microenvironment, can promote some tumors' progression, such as CRC, HCC, thyroid cancer, and pancreatic tumor [67-70]. Authors hypothesized that ABAT expression could influence tumors' prognoses by affecting specific CAFs' subpopulation infiltration. Through exploring the correlation between ABAT and CAFs subpopulation may help to identify new targets of tumor treatment. Regrettably, the related research has not to be found in the publication. More exploration is needed.
ALDH5A1 is close to ABAT, and it has a similar function to ABAT in the development of neurological diseases and mental disorders [12,40,71]. The genetic alteration of ALDH5A1 and ABAT causes inherited disorders of Gamma-Aminobutyric Acid (GABA) metabolism and may develop Alzheimer's Disease and paranoid schizophrenia [40,71,72]. Moreover, previous studies show that the decreased expression of ALDH5A1 in patients with ovarian cancer or papillary thyroid carcinoma may lead to a poor prognosis [73,74]. The interaction of ABAT and ALDH5A1 in tumor treatments may have a synergistic effect. Li, et al., had the similar conclusion that the interaction effect may work in the clinical efficacy of Valproic Acid (VPA) [12]. But authors cannot find a similar study focusing on tumor therapy. This may be a novel area waiting for exploration.
Through various enrichment analyses, authors discovered that cell junction structure, amino acids metabolism, and neuronal system-related behaviors might affect cancer pathogenesis or etiology. Garcia concluded that defects of cell junction structure result in a wide range of tissue abnormalities that are common in genetic abnormalities and cancers [75]. A few pieces of research support that the migration and metastasis of tumor cells depend on the cadherin-mediated cell-cell junctions [76-78]. Han, et al., reported that ABAT overexpression could upregulate E-cadherin in liver cancer cells [79]. The authors assumed that ABAT might induce the cell junction structure stabilization and inhibit tumor cells migration by increasing cadherin. However, mentioned in previous studies, the energy metabolism of tumor cells may be associated with ABAT, and the cancer cell's migration and invasiveness behaviors may be induced by high ABAT expression levels [10,80]. The difference of primary molecular mechanisms (such as changes in energy metabolism and induces the transcription of specific proteins) in different tumor migrations may be the reason for these contradictory conclusions.
The targeted regulation between ABAT and cadherin may be a new therapy to inhibit tumor cell migration.
This study is the first research in a pan-cancer analysis that systematically evaluated the potential role ofABAT in progression and prognosis in various cancers, providing the assumption of potential therapeutic targets and evidence of cancer immunity related to ABAT expression. Therefore, it is worthy of exploring more possibilities of ABAT further.
This study is the first pan-cancer analysis of ABAT. Novel effects of ABAT on tumor prognosis have been revealed. The relationship between the ABAT protein and gene has been displayed.
This research was supported by the National Key R&D Program of China (Project number 2022YFC3601703).
[Crossref] [Google Scholar] [PubMed]
[Crossref] [Google Scholar] [PubMed]
[Crossref] [Google Scholar] [PubMed]
[Crossref] [Google Scholar] [PubMed]
[Crossref] [Google Scholar] [PubMed]
[Crossref] [Google Scholar] [PubMed]
[Crossref] [Google Scholar] [PubMed]
[Crossref] [Google Scholar] [PubMed]
[Crossref] [Google Scholar] [PubMed]
[Crossref] [Google Scholar] [PubMed]
[Crossref] [Google Scholar] [PubMed]
[Crossref] [Google Scholar] [PubMed]
[Crossref] [Google Scholar] [PubMed]
[Crossref] [Google Scholar] [PubMed]
[Crossref] [Google Scholar] [PubMed]
[Crossref] [Google Scholar] [PubMed]
[Crossref] [Google Scholar] [PubMed]
[Crossref] [Google Scholar] [PubMed]
[Crossref] [Google Scholar] [PubMed]
[Crossref] [Google Scholar] [PubMed]
[Crossref] [Google Scholar] [PubMed]
[Crossref] [Google Scholar] [PubMed]
[Crossref] [Google Scholar] [PubMed]
[Crossref] [Google Scholar] [PubMed]
[Crossref] [Google Scholar] [PubMed]
[Crossref] [Google Scholar] [PubMed]
[Crossref] [Google Scholar] [PubMed]
[Crossref] [Google Scholar] [PubMed]
[Crossref] [Google Scholar] [PubMed]
[Crossref] [Google Scholar] [PubMed]
[Crossref] [Google Scholar] [PubMed]
[Crossref] [Google Scholar] [PubMed]
[Crossref] [Google Scholar] [PubMed]
[Crossref] [Google Scholar] [PubMed]
[Crossref] [Google Scholar] [PubMed]
[Crossref] [Google Scholar] [PubMed]
[Crossref] [Google Scholar] [PubMed]
[Crossref] [Google Scholar] [PubMed]
[Crossref] [Google Scholar] [PubMed]
[Crossref] [Google Scholar] [PubMed]
[Crossref] [Google Scholar] [PubMed]
[Crossref] [Google Scholar] [PubMed]
[Crossref] [Google Scholar] [PubMed]
[Crossref] [Google Scholar] [PubMed]
[Crossref] [Google Scholar] [PubMed]
[Crossref] [Google Scholar] [PubMed]
[Crossref] [Google Scholar] [PubMed]
[Crossref] [Google Scholar] [PubMed]
[Crossref] [Google Scholar] [PubMed]
[Crossref] [Google Scholar] [PubMed]
[Crossref] [Google Scholar] [PubMed]
[Crossref] [Google Scholar] [PubMed]
[Crossref] [Google Scholar] [PubMed]
[Crossref] [Google Scholar] [PubMed]
[Crossref] [Google Scholar] [PubMed]
[Crossref] [Google Scholar] [PubMed]
[Crossref] [Google Scholar] [PubMed]
[Crossref] [Google Scholar] [PubMed]
[Crossref] [Google Scholar] [PubMed]
[Crossref] [Google Scholar] [PubMed]
[Crossref] [Google Scholar] [PubMed]
[Crossref] [Google Scholar] [PubMed]
[Crossref] [Google Scholar] [PubMed]
[Crossref] [Google Scholar] [PubMed]
[Crossref] [Google Scholar] [PubMed]
[Crossref] [Google Scholar] [PubMed]
[Crossref] [Google Scholar] [PubMed]
[Crossref] [Google Scholar] [PubMed]
[Crossref] [Google Scholar] [PubMed]
[Crossref] [Google Scholar] [PubMed]
[Crossref] [Google Scholar] [PubMed]
[Crossref] [Google Scholar] [PubMed]
[Crossref] [Google Scholar] [PubMed]
[Crossref] [Google Scholar] [PubMed]
[Crossref] [Google Scholar] [PubMed]
[Crossref] [Google Scholar] [PubMed]
[Crossref] [Google Scholar] [PubMed]
[Crossref] [Google Scholar] [PubMed]
[Crossref] [Google Scholar] [PubMed]
[Crossref] [Google Scholar] [PubMed]
Citation: Wang X, Jie Y, Yu H, Dong A (2023) The Oncogenic Role of γ-Aminobutyrate Aminotransferase in Human Tumor: A Pan-Cancer Analysis. Chemo Open Access. 11:183.
Received: 06-May-2023, Manuscript No. CMT-23-23962; Editor assigned: 08-May-2023, Pre QC No. CMT-23-23962 (PQ); Reviewed: 24-May-2023, QC No. CMT-23-23962; Revised: 31-May-2023, Manuscript No. CMT-23-23962 (R); Published: 07-Jun-2023 , DOI: 10.35248/2167-7700.23.11.183
Copyright: © 2023 Wang X, et al. This is an open-access article distributed under the terms of the Creative Commons Attribution License, which permits unrestricted use, distribution, and reproduction in any medium, provided the original author and source are credited.