Advances in Automobile Engineering
Open Access
ISSN: 2167-7670
ISSN: 2167-7670
Research Article - (2017) Volume 6, Issue 2
It is considered a hybrid driveline intended for electric vehicle in which Kinetic Energy Storage (KES) is used as an energy buffer for the load levelling over the main energy source – Li-Ion battery. Relations for KES local efficiency are worked out. Overall efficiencies of the parallel power branches are defined, and a control strategy for power split is proposed based on the alternative storage devices State of Charge (SoC). Quantity estimations of KES influence on the battery loading are obtained by evaluation of covered mileage, achievable with a single battery recharge over standard driving cycles, and by expected battery cycle-life prediction.
<Keywords: Electric and hybrid drive lines; Electric battery; Kinetic energy storage; Efficiency; Achievable mileage; Battery exhausting and ageing
Battery Electric Vehicles (BEV) is considered as an important mobility option for reducing the dependence of fossil fuels. After almost a decade after the first serial production electric vehicle launched by Tesla [1] the main auto manufacturers have already claimed their plans and readiness for delivering their electric products to customers. The greatest challenge of the BEV is the battery itself, as they face the customers accustomed to the flexibility of oil derivatives usage. Electric batteries offer either high specific energy capacity to cover acceptable mileage or high specific power to follow typical driving discharge/ charge cycle demands, but not both. Hybridization of the energy source is one widespread nowadays solution and a common strategy would be to combine an electric battery with an additional high-power source usually mechanical devices as kinetic energy storage – flywheels (KES) [2,3], or electrical device - super-capacitors, for example [4-6]. Based on its utilization in F1 competition KES systems gain popularity and there are signs from automakers for introducing the KES into mass production [7,8].
The idea of KES usage as an alternative energy source in BEV was born in the early 1970s [9]. The proposed concept utilized KES as a main energy source in a vehicle with pure electric propulsion system, which reflects the technology state at the time. Evolving from Lead- Acid battery technology to Lithium-Ion battery ones swaps KES and battery as the main energy source over time.
Because of the energy transfer behaviour, KES utilization needs a Continuously Variable Transmission (CVT) to be connected to the vehicle original propulsion system. The pure electric transmission, where the battery and KES are electrically coupled to the main traction electric machine, is considered as a standard one for BEV [10]. Such a transmission allows maximum flexibility of the components layouts but at the expense of double energy conversion and numbers of power converters.
The energy conversion could be avoided by using a mechanical link between KES and vehicle driven wheels, such as belt drives [11], toroidal transmissions [12], planetary gear sets, PGS, [13-15], or power split CVT [16]. This approach is not suitable for BEV application because of its complexity, lacks of flexibility and increased overall BEV mass.
In spite of some claims that KES technology is immature for BEV applications [17], nowadays power electronics technology allows KES integration in BEV. A two-power level electric driveline for vehicle application with KES utilization as a balancing energy device is investigated in University of Uppsala, Sweden, [18]. Four power converters, three AC/DC and one DC/DC, form the both sides of the proposed electric driveline. Obtained results show more than half of the losses are attributed to the function of KES, but authors do not consider battery and traction motor losses.
Overall energy transfer efficiency is a key factor for hybrid vehicles, where more than one energy source are available. There are different algorithms to govern the power split between the alternative power sources [19,20], such as Lagrange Multipliers, Pontryagin’s Minimum Principle, or Dynamic Programming, but they rely on exact description of energy losses in the all components including the energy sources and seeking the optimal solutions requires high computing resources and time.
Local efficiency of the electric components, such as the battery, electric motor/generators and the power electronics are well known. The aims of the presented investigation are description of KES local efficiency and corresponding overall efficiencies of the alternative power branches in a hybrid BEV with KES as functions of current states of the energy sources and the vehicle energy demands. As a result, admissible areas of KES usage can be formulated in advance; a strategy for power split will be formulated based on sources state, and KES impact on the electric battery can be estimated for the created control strategy.
A standard hybrid BEV [10,21] is considered and its principal scheme is shown in Figure 1. The conventional electric propulsion system consists of an electric battery (Li-Ion battery), pos.1, a DC/AC inverter, pos.2, and a traction motor/generator, pos.3, connected to the driven wheels via a final drive, pos.4. The second propulsion branch, known as a WPH Flywheel System, including kinetic energy storage KES), pos.6, and a secondary electric motor/generator, pos.5, is electrically coupled via an AC/DC converter, pos.7, to the conventional driveline. The power flows, which cover the energy demands for BEV movement, are divided between the both branches with negligible losses in a power splitter, which represents a bidirectional matrix converter, formed by the DC/AC inverter, pos.2, and the AC/DC converter, pos.7 [22,23].

Figure 1: Considered scheme of a hybrid propulsion drive line for battery electric vehicle (BEV).
The vehicle specifications given a priori are as follows [24]: BEV mass of 1700 kg, with the hybrid branch increased mass of 1850 kg; nominal power of the electric machines – the main traction motor has a nominal power of  and the secondary motor -
 For safety reasons the KES speed working range is limited to 3000 ÷ 9000 min−1 ; in spite of the fact that last achievements in KES technology use speed range of 20000 ÷ 60000 min−1
The components, as depicted in Figure 1, form the considered hybrid propulsion system and can be conditionally separated in two groups as energy transformers (pos.2, 3, 5 and 7) and as energy storage devices (pos. 1 and 6).
The modeling of energy transfer processes requires an assessment of existing power losses in the propulsion lines during the energy transformation from chemical energy form through the electrical one to the mechanical energy and vice versa depending on vehicle mode of operation. The benefits of such hybrid systems are directly linked with their drivelines efficiency, which determine the aim of the present part: a suitable description of those losses and determination of the local efficiency of the main components (transformers and storages) in an appropriate form for investigation of the power flows taking into account the condition for reversibility.
Local efficiency of the energy transformers
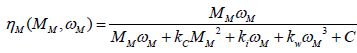
Local efficiency modeling of the main traction motor is based on the processing of the available data for Toyota Prius 2004 model year, shown in Figure 2a. As no all values are published, and the reported ones are unevenly distributed, a modified LoLiMoT method [25] is used to fill up the input data gap. A good starting function is the empirical relation among the motor speeds, torques, and the resulting motor efficiency, given in Electric vehicle technology by Larminie and Lowry [26].

Figure 2: Experimental data and description of the used method.
 (1)
(1)
where kC is a coefficient for electrical losses (resistance) in the motor brushes and coils; ki - coefficient of the magnetic hysteresis losses and eddy current losses; kw - the coefficient for the aerodynamic losses; C - all constant losses existing independently of the motor operating points, power for the control circuit, for example
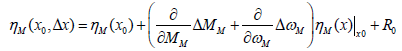
The first order Taylor series of the vicinity of  is given by:
 (2)
(2)
which results in a global linear model as:
 (3)
(3)
Where the derivatives at  form the unknown weight parameters ωi, j .
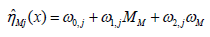
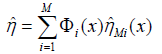
According to Isermann [25], the output of the local linear models can be presented as (Figure 2b)
 (4)
(4)
Where Φi(x) the normalized Gaussian validity is functions in the following form:
 (5)
(5)
With ci,j as centers of the local model validity area, and σi,j is the standard deviation.
The LoLiMoT algorithm is applied for training. The algorithm starts with a single linear model, which is valid for the complete input space. At each iteration, the worst case is split into two sub-models valid for the decomposed input space as shown in Figure 2c. The used LoLiMoT model is available on www.maxbsoft/Software-Linox/ LOLIMOT-models.html. If the model is evaluated at grid points, only one model is active. If the output has to be evaluated between grid points, the surrounding models are used in the bilinear interpolation procedure, illustrated in Figure 2d.
The driveline structure used in the hybrid Toyota Prius allows its main traction motor to work in generator mode, but there are no available experimental data for its efficiency in this operation mode. There are two methods for overcoming the issue, which are based on the idea for mirror values at inverted energy flow: mirrored local efficiency and mirrored component losses respectively [27]. In the considered case, it is accepted the concept for mirrored losses, which defines the local efficiency of the main traction motor in the generator mode as Vehicle powertrain systems [27]:
 (6)
(6)
Where ηMi is the motor efficiency obtained from the available experimental data; relation (2) is only valid for ηMi > 0.5
Input data, visualized in Toyota Prius Hybrid Synergy Drive System and obtained results for the main traction motor efficiency is presented in Figure 3.

Figure 3: Local efficiency map of the main traction motor.
The same method is applied for the secondary motor, based on the available data for Toyota Prius 2010 model year because of the wider speed range and reported higher efficiency of its traction motor. To match the data with the object specification given a priori, the method of similarity is adopted to align the torque and the speed ranges, and as a result – the corresponded output power. A visual comparison between the experimental data and modeled efficiency as a function of motor speed and generated torque for the secondary motor, directly coupled to the KES, is shown in Figure 4.

Figure 4: Local efficiency map for the secondary electric motor.
Inverter efficiency models depend on the operation modes of the considered hybrid propulsion system. In pure electric mode, for example, when entire energy passes to/from the electric battery, which coincide with corresponding Toyota Prius modes. The available experimental data for the efficiency of the inverter used in Prius 2004 model year is processed in the same manner as described for the main traction motor. In hybrid modes of operation, because of the power split between the main traction motor and the inverter itself, only a part of the input power flows through the inverter and the modeled inverter efficiency must be considered as a function of the inverter pass through power (Figure 5).

Figure 5: Inverter local efficiency map.
Electric battery model and its local efficiency map
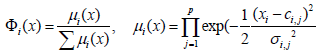
The battery state of charge SoCBat is considered here as a main parameter for determination of the battery condition. In Electric vehicle technology [26] this parameter is explained as a “fuel tank level indicator” and some of OEMs use the same visualization on the instrument clusters to represent its state. In the theory, this parameter is described by the ratio between the current battery capacity (quantity of charge) and the nominal one as:
 (7)
(7)
where Q0 is determined capacity at normalized discharge current rate I0 For the aims of the current investigation as the main point of interest is quasi-static process of energy transfers, the dynamics of battery cell voltage is neglected. A simplified Thevenin battery cell model, shown in Figure 6a, is accepted [28]. The symbols used in the Figure 6a are as follows: E is the battery cell open circuit voltage, [V]; V is the output voltage of the battery cell, [V]; Ri is the cell internal resistance, [Ω]; I is the current rate through the cell circuit, [A].

Figure 6: Battery cell models.
Applying the basic circuit theory there is the well-known relation among the aforementioned parameters in the forms:
 (8)
(8)
where in case of Li-ion cell the different parameters are approximated by power series [29] as:

 (9)
(9)
where ai,bi are coefficients, corresponded to specific manufacturer (cell technology). An example is shown in Figure 6b for Li-Ion cell 26650- m1, manufactured by A123System.
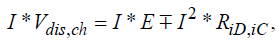
Multiplying both sides of relation (8) by the current I leads to cell power relation in the following forms
 (10)
(10)
Where  the power is flow from/to the battery cell, and
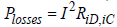 are the internal cell losses.
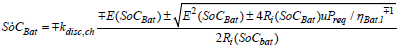
The solution of relation (10) regarding to the current rate I at a given output/input power rate  is
is
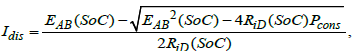 (11)
(11)
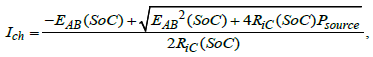
where the second solution in both cases is ignored because of the obtained current values. In fact the second solutions correspond to a non-efficient battery usage where the higher values of the voltage drop over the internal battery resistance results in reduced output battery voltage, so the necessity power Pload /source is achieved at low voltage and very high current rate, i.e. an alternative rejected by the practice.
Battery local efficiency at given internal losses can be presented for both modes of battery operation as:
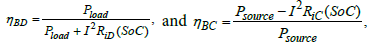 (12)
(12)
and the obtained results as a function of battery state of charge and applied power for the Li-Ion battery are presented in Figure 7.

Figure 7: Battery local efficiency map as a function of its state of charge and applied external power.
The battery state of charge SoCBat , relation (7) is considered as a parameter for describing the battery efficiency, and the relation (7) does not describe the influence of the current rate I on the actual battery SoCBat [30], known as a Peukert law. Although this influence is a weak for the Li-Ion batteries, it is estimated in the battery modelling by relation, proposed as standardization work for BEV and HEV applications [31].
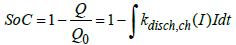 (13)
(13)
As , kdisc ch (I) is a functional coefficient which depends on the battery mode of operation,
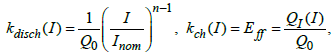 (14)
(14)
Where n =1.03 ÷1.05 is a Peukert number for Li-ion battery; I is the current rate through the battery circuit, [A], is the nominal rate, [A], Inorm corresponding to the battery nominal capacity, 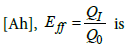 a charge efficiency coefficient (known as Coulomb charge efficiency), and QI is the battery capacity, [Ah], at a given charge rate Ich.
Kinetic Energy Storage (KES) model and its local efficiency maps
There is no energy transformation in KES and its internal losses are results of its own rotor motion. Two main loss contributions are usually considered: bearing losses (rolling, sliding, sealing) and air resistance (significant reduced in vacuum), including rotor shape resistance (known as a spacing ratio [18]. Those losses do not depend on the power flow to and from the KES.
For the bearing losses modelling a relation, proposed in Vehicle propulsion systems by Guzzella and Sciarretta [32], is used:
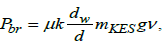 (15)
(15)
where μ is a friction coefficient; k is a corrective force factor for unbalance and gyroscopic force modelling; dw,d are shaft and flywheel diameters [m]; mKES is the flywheel mass [kg]; v is the peripheral velocity, [m/s]; g is the gravitational acceleration [m/s2 ].
At a given KES dimensions and for Reynolds numbers above 3 10-5, the air resistances can be expressed as Vehicle propulsion systems by Guzzella and Sciarretta [32]:
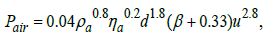 (16)
(16)
Where ρa is the air density in the internal area [kg/m3]; ηa is the dynamic viscosity of air, [Pa.s]; β=b/d is a geometrical ratio, describing the flywheel thickness.
The KES state can be presented by its state of charge in the similar manner as the battery in the following form
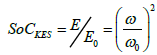 (17)
(17)
where ω and ω0 are the current and maximum permissible working angular velocities of the KES rotor.
Obviously the peripheral velocityv, which is the basic parameter in power losses relations (15) and (16), is a function of KES state of charge, relation (17) in the form 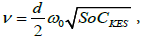 and after substitution, it is possible to model the power losses in KES as a function of its state SoCKES in the following form
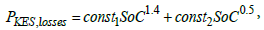 (18)
(18)
where the constants const1 and const2 are defined according to relations (15) and (16).
The functional relation (18) allows describing the KES local efficiency by similar way as used for the battery, relations (12), in the following form
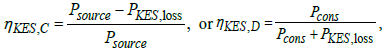 (19)
(19)
depending on the direction of the power flow.
The results from KES efficiency modeling, based on the relations (18) and (19) and the power limit of the secondary electric motor according to the specifications, are presented in Figure 8. There is a clear evidence of the KES losses influence, i.e., the KES efficiency drops with increasing its state of charge SoCKES at a constant external power exchange. Comparative analysis between both accumulators efficiency (Figures 7 and 8) shows the area of higher power flows and keeping SoCKES below the medium, where KES is competitive with the battery.

Figure 8: KES local efficiency map as a function of its state of charge SoCKESand applied external power.
If there is no a particular KES design, which would determine the parameters used in relations (15) and (16), it is convenient to use the recommendations given by Flybrid Systems LLP for a preliminary estimation of the KES losses worked on their experience in the field of KERS usage [www.flybrid.co.uk/FAQ.html]:
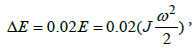 (20)
(20)
i.e., the overall KES losses equate to around 2% of stored energy in KES per minute, but with keeping in mind the specific features of the developed by Flybrid KERS units, such as used flywheel shape, the vacuum systems, magnetic bearings, etc.
The corresponding power losses can be achieved if the relation (20) is considered for 1 sec, and taking into account the relation (17) it is followed
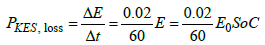 (21)
(21)
The losses existing in KES, as described by (15) and (16), and (21) respectively, are shown in Figure 9, as a function of KES state of charge SoCKES. The comparative analysis and identification process clearly depict the necessity of creation of vacuum medium into the KES housing with air density 

Figure 9: Comparative analysis of separate losses existed in KES and those, reported by Flybrid Systems LLP.
A specific KES systems behavior, which is not possible to be included in as described KES local efficiency, is the KES state of charge SoCKES reducing over time with no external energy transfer to/from KES. For example, if a driven cycle with duration of 1500 sec is accepted for the hybrid BEV modelling without KES usage, the KES will loss almost 90% of its energy at the end of the cycle (40%, if a Flybrid KES is considered), as it is shown in Figure 10.

Figure 10: KES state of charge deviation over time at no external energy transfer.
KES spin-down modelling is described by the solution of its rotor dynamics equation, which has the following form
 (22)
(22)
Where JKES is the flywheel moment of inertia, [kgm2];  are its angular velocity, [s-1] and angular acceleration, [s-2], respectively; PKES is the zeroed active power to/from KES, and Ploses are described by relations (15) and (16) or (21) KES internal losses, [KW].
Overall efficiency of the alternative propulsion drive lines
Results obtained in previous parts for the components local efficiency are used for a description of the overall efficiency of the alternative branches of energy transfer: drive wheels – battery and driven wheels – KES. For this purpose averaged values of the local efficiency over the iso-lines of constant power are obtained, which allow representing the overall efficiency of the both branches as a function of both necessity power for BEV movement and the state of charge of the alternative storage devices as well. The results are presented in Figure 11, which consider the case where the direction of the power flow is to the driven wheels.

Figure 11: Overall efficiency of the alternative propulsion lines as a function of power flows and corresponded state of charge.
The comparative analysis of the results, shown in Figure 11, at which the battery state of charge is considered just as a parameter, shows that the area of effective usage of KES, as an energy buffer in BEV application, lays in the region of maximum power of the secondary motor, coupled to the KES, but at the same time keeping the KES state of charge as low as possible.
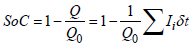
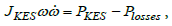
The modelling process of the energy transfers in the proposed hybrid BEV where the KES is used as an energy buffer is implemented with presumption of negligible losses in the power splitter (the bidirectional matrix convertor). The vehicle state dynamics is described by using the alternative storage devices state of charge description (relations (13) and (17)) in the following form:
 (23)
(23)
where IBat is the current rate through the battery circuit; kdisc,ch is the coefficient of used battery model for SoCBat (equal to the unity in the simplified model or relations (10) if the Peukert law is considered); E0 is the maximum energy level of KES; PKAE is the mechanical power of the secondary electric motor attached to the KES, but Ploses is the defined power losses in the KES according to relation (18).
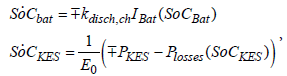
The power split between the battery and the KES is accomplished lossless in the splitter and can be described by a parameter u as follows:
 (24)
(24)
Where Preq is the power determined by the power balance of the moving vehicle, ηMG1 is the main power traction motor efficiency. A conventional electric propulsion system is considered if u=1.0.
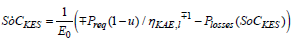
Substituting the power split coefficient, relation (24), into the system (23), it is obtained
 (25)
(25)
at the following constraints
a) Physical storage devices limits.
 (26)
(26)
b) maximum available traction power from the battery
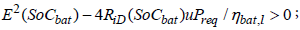 (27)
(27)
c) maximum power of the second electric motor, coupled with KES
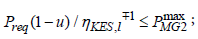 (28)
(28)
and power distribution, described by the parameter u, as follows
d) power flow to the driven wheels
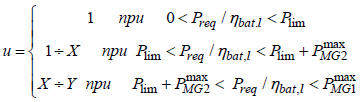 (29).
(29).
e) power flow from the driven wheels (recuperative braking)
u=0 (30)
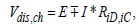
where  are overall efficiencies of the alternative propulsion branches, determined by the used storage devices;
  are nominal power of the electric machines, main traction motor and secondary motor respectively; Plim necessary propulsion power limit for KES activation, and are parameters depending on the concrete values for, and respectively; signs ± and depict the vehicle mode of operation, the upper signs are related to the power flows to the driven wheels, but the lower signs – for power flows from the driven wheels.
Achievable mileage
The hybrid BEV behavior is examined over the standardized drive cycle FTP-72 [33], which defines the speed profile to be complied with. The solution of the first task of dynamics, known as a quasi-static solution [32], is the input parameter Preq for the system (25). Following parameters, describing the vehicle properties are used: Cd =0.29 – aerodynamic drag coefficient; Af=2.13, [m2], is the vehicle frontal area; δ =1.035 is a coefficient for rotational masses; fr =0.013 is the tire rolling resistance coefficient. According to the previous investigation [24] a mileage of Ld =160km (99.4 miles) over NEUDC drive cycle is achievable with the following capacities of the storage devices: a battery with capacity of 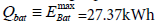 and a KES with capacity of
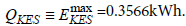
The state of charge alteration for both alternative storage devices is modeled over a consequence of repeatable FTP-72 cycle until full battery depletion. The results as a function of covered mileage with same scaling factor are shown in Figure 12 at different values for power limit Plim, which describe the intensity of the KES usage.

Figure 12: State of charge deviation of battery and KES as a function of covered mileage.
At low values for Plim, (Figure 12), the KES energy state is kept in the area of the lower limit of the first constraint (22), which corresponds to the higher efficiency of the KES propulsion branch. The energy stored in KES is not enough to compensate the increased inertia loads as a consequence of increased vehicle mass, and as all vehicle energy available for recuperation is transferred to the KES for covering its internal losses, the resulting mileage is less than the one achieved in case of pure electric drive. Increasing the Plim value limits the energy consumption from the KES, which leads to increased average KES state of charge. At high values for Plim, (Figure 12), the KES state of charge is kept under compulsion at its upper limit, which combined with the reduced efficiency of the KES driveline to the driven wheels, results again to reduced covered mileage, compared to achieve by pure electric drive line. As a result there is a zone for Plim, where it is possible to increase the achievable mileage covered by the conventional electric propulsion. Obtained extremum for the covered mileage, 5.6% higher than covered by pure electrical drive, is shown in Figure 12 and this corresponds to 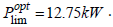 A detailed investigation of the obtained optimum value reveals that this power limit guaranties the same KES energy state at the end of the recurring cycle, comparing to its initial state at the beginning of the cycle.
Parameters describing the battery load during vehicle movement, i.e., the battery current rate and the battery output voltage are presented for both variants of propulsion in Figure 13. At the chosen strategy for controlling the KES usage at the KES works as a current rate limiter with respect to the battery. As the battery SoCBat is an integral characteristic of the current passed through it, the current rate limitation smooths over the battery SoCBat curve.

Figure 13: Parameters describing the battery load for both variants of the propulsion.
Battery life prediction
A commonly accepted opinion for electric battery life determination is a battery state when the considered battery has lost 20% of its nominal capacity. Different methods exist, most of them define the battery life as a number of cycles (discharge/charge) until the battery capacity fades to its permissible limit [34,35]. The vehicle behavior is modeled for the both considered configurations of the propulsion system (pure electric and hybrid electric) over 15 repeatable FTP-72 cycles, which correspond to an average daily mileage, followed by a battery recharge over nights, i.e., the considered battery cycle coincides with twenty-four hours period. Based on two a priori chosen models the KES influence on the predicted battery life is estimated [36,37].
According to Wang et al. [35] the capacity fade of the Li-Ion cell 26650-m1, used in this investigation, can be approximated in percentage as
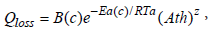 (31)
(31)
Where B(c) is the pre-exponential factor, depending on the battery current rate 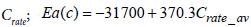 is the activation energy [Jmol−1] , determined as a function of averaged battery load Crate _ av ; R=8.314 is the gas constant, [J / molK] ; Ta = 273 + T is the absolute working temperature in the battery pack, [K]; Ath is the current passed through a cell during one complete cycle, [Ah], calculated by the relation
 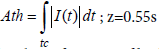 the power law factor. The relation (31) is visualized as a function of both battery load parameters current rate Crate and charge passed though (Ath) in Figure 14a.

Figure 14: Aging models for Li-ion battery.
The second model by Millner [34] is an evolutionary model, which includes empirical, variable in time history, equivalent circuit model and generally is described as:
 (32)
(32)
where the life parameter has the following meaning: corresponds to a new battery, but defines no capacity left in the battery. The number of cycles defined the battery life is determined at L=0.2.
The elements  in the Milner’s model contain components describing different factors influenced on battery behavior: L1 is the battery life parameter reported on battery state of charge ( SoCBat ) deviation and the charge passed through for a cycle; L2 is a life parameter which considers the change of active Lithium ions concentration; LT is a life parameter adjusting the aging rate suing the Arrhenius law [38,39]. The author proposes a theoretical basis for progressive damage influence on the parameters of the equivalent circuit model (relations (5)) by empirical battery internal resistance sub-model. In the current investigation a simplified linear version of the Milner’s model is accepted, where, because of repetition of the similar battery cycles, the battery life prognosis is based on the characteristics achieved for the first cycle (shown as a solid straight line in Figure 14b. Obtained results are highly reduced, but they allow making a comparative estimation of KES influence on the battery life.
Table 1 contains data for main parameters influenced on the battery life and its life prognosis for electric (EV) and hybrid electric (HEV) propulsion. There is a clear difference in the obtained cycle’s number calculated according to the both models based on the accepted linear modification of the Milner’s model. The usage of KES as an energy buffer in the pure electric propulsion system reduces the stress over battery. This is described by the integral characteristics charge through pass Ath, which partakes in both models. Depending on the usage of the energy, stored in KES, the average value of the battery C-rate (Crate_av) is reduced and the increased duration of periods, when the KES is capable to cover part of the energy demands at the zones of higher efficiency of its propulsion line, compared to the battery one, is a target for the hybrid propulsion management. The battery characteristics (state of charge SoCBat, and its average value SoCav over one cycle) also decrease, which logically leads to battery life increase.
| c |  |
 |
 |
 |
Wang | Millner | Millner iteration procedure |
|---|---|---|---|---|---|---|---|
| EV | 0.3034 | 126.791 | 0.5074 | 0.9922 | 1470 | 1389 | 1552 |
| HEV | 0.2129 | 123.396 | 0.5998 | 0.7863 | 2071 | 1443 | 1612 |
Table 1: Battery life-cycle prediction for both propulsion systems.
A dynamic model of a hybrid electric vehicle is created, where a KES is used as an alternative energy buffer to support the main energy source – the electric battery. Numerical solutions show that by proposed control of the power splitting between the battery and the KES; it is possible to increase the expectant battery life concomitant with slight mileage increase over FTP-72. The theoretical investigations also show an increase between 8% and 15% of the achievable mileage of a vehicle with mass 1750 kg over NEUDC cyclic recurrence until the main energy source – the electric battery becomes fully discharged. All depends on the losses in the bearings and the value of the vacuum in flywheel’s container.
The authors acknowledge the financial b support of Ministry of Education and Science - Bulgaria, contract №.DUNK 01/3 – 2009.