Advances in Automobile Engineering
Open Access
ISSN: 2167-7670
ISSN: 2167-7670
Research Article - (2017) Volume 6, Issue 2
Electric Vehicle (EV) battery technologies is a limiting factor for the wide spread diffusion of electric vehicles. EV battery’s energy density compared to fossil fuels is still very low, thus EV’s have still stringent driving range with voluminous, heavy and high cost batteries. Automotive OEM’s are trying to estimate the future of batteries to do their plans related to electric vehicle manufacturing. This article attempts to estimate the future of EV batteries and mainly that of Li_Ion, Li_S and Li_Air Technologies which seem to be the most promising Technologies as of today. The article explains in detail the methodology used, and the results with an estimation of future EV market as a result of the EV battery development time scale.
<Keywords: Technology forecast; EV battery future; EV market future
Transport sector has an important contribution on global carbon emission. In EU, Transport sector is the second most greenhouse gases emitting sector with 24.3% [1]. Therefore, major car manufacturing countries have declared special regulations and objectives in order to decrease these high emission ratios. EU regulation requires fleets to have 95 g CO2/km cap by 2020. US and Japan has also challenging targets. These targets can only be achieved by partial introduction of electric vehicles to fleets. For this reason, most major manufacturers have already introduced their electric vehicle cars, and they have plans to develop further.
The countries have set some objectives to achieve for electric vehicle market [2,3]. However, in most cases, these objectives are revised when the deadlines come closer. In 2011 US has put an objective of reaching 1 million electric vehicles by 2015. However, the total of all the electric vehicles according to the report of IEA in 2015 is 665,000 [4]. The numbers and range is also very different between different research companies. 2020 estimation for market share of electric vehicles changes from 2% to 25% according to different research organizations.
An important reason for such wide range of estimation and discrepancies on achievement of objectives are due to the major bottlenecks for electric vehicle introduction to the market. Main technical road block is the battery technology. A 24 Kwh Li_Ion Battery for around 100 miles range for a compact vehicle, costs around 8,400 $ with a weight of around 200 kgs. Charging time is also much above of that customers are used to for petrol powered vehicles.
Another major road block is charging infrastructure and smart grid systems, which is also in a way related to the battery technology.
In order to estimate the future of electric vehicles, it is necessary to estimate future of electric vehicle batteries. In this article an attempt will be made to estimate the future cost and main performance specifications of electric vehicle batteries. Then an estimation regarding the possible sales volumes of electric vehicles could be done in a more reliable manner.
However estimation of future level of technology is an intriguing subject and should be analyzed in a methodological system otherwise the results could be misleading. In this article, the several development stages of introduction of a technologically innovative product to the market will be taken into account and the forecasting will be carried out by taking into account characteristics of each phase. Martino [5,6] defines the phases as follows,
■ Forecasting steps for a new technology.
■ Technology forecasting methodology.
■ Electric vehicle battery technologies analysis.
■ Extension of battery technology to market analysis.
■ Application of forecasting methods to market estimation.
To estimate the market for a radically new product requires a different methodology than the estimation methodologies for incremental new products, especially when the technology is in the initial stages.
Development stages of a radically new product always starts with basic research. The second stage is technology development (applied research) using the results of basic research. After technology development the third stage is product development integrating new technologies. Production and marketing is the fourth stage. Market size and impacts are the fifth stage. Each stage has different information sources. Martino [5] has pointed out the information sources as in the Table 1.
| Radical product development stages | Information sources |
|---|---|
| Basic Research | Citation Indexes |
| Technology Development ( Applied Research) | Engineering Indexes and patents |
| Product Development | Patents, concepts |
| Production and Marketing | Marketing reports, journals, sector reports |
| Impacts | Journals, Sector Reports |
Table 1: Sources for each stage of a radically new product development (adapted from Martino).
The representation of life cycles for each stage can be seen in the Figure 1. Life cycles follow an S-Shaped curve. The first stage is the startup period. Then comes the growth period, followed by maturity and saturation periods. Understanding the passage from one development stage to another and on which period of the S-Curve the development is are the challenges of technology forecasting. Technology Forecasting is important to understand when to jump to a new technological activity or to leave an existing technology.

Figure 1: Life cycles for different stages of radical new product development.
Estimating the future of a new technology is not an easy task. In the past there has been many examples of gravely wrong technology forecasts. A typical example was the estimation of electronic computers future around 1940’s by some prominent scientists in US and UK. They forecasted that electronic computers would be used by only mathematicians and both countries would need only a few of them [6]. Such problems has increased the interest on the methodology for technology forecasting.
Technology development is a discontinuous process. For this reason, forecasting is to be done with extensive and detailed analysis. Martino in his article in 1987 has classified technology forecasting methods to four “pure types” as extrapolation, leading indicators, causal models, and stochastic methods. In his article of 2003 Martino has investigated recent advances in technology forecasting and also pointed out methodologies like development of scenarios, Delphi and influence of chaos theory.
Delphi is the oldest technology forecasting method developed by RAND technologies at around 1950’s. For Delphi methodology, an expert management group is selected. This group selects the experts’ team on the subject. Prepares the survey questions. Contacts the experts and gets the answers for the survey. Analyses the results, conduct a second iteration and if necessary a third. Then writes the report analyzing the results of the iteration as well. The success of this methodology depends very much on the selection of the experts, and how much they are ready to share the information. The responses of the experts are weighted according to the different criteria and a probabilistic result is obtained.
Extrapolation methodology is an analytical method. Several performance indicators can be taken to develop a model, like performance of the technology level, number of patents, number of articles written etc. in line with the development stage. A model is fitted to the historical data and the projection of that model gives the future projection. Selection of the right extrapolation methodology is very important for the success of the forecast. If a wrong model is selected the results can be misleading [7]. Logistic Pearl and Gompertz are the most commonly used growth curves. Steurer [8] has used Generalized Extreme Value (GEV) which includes Gompertz as a special case and showed that for some data improved the flexibility of S-curve.
Stochastic methods generate a probability distribution over a range of possible outcomes. Different probabilistic approaches have been suggested by researchers. One of the methodologies suggested by Olson and Choi involves description of the probability a previous nonuser will purchase and the probability that a unit in use will wear out necessitating repurchase.
After investigation of different methodologies, Logistic Pearl and Gompertz seems to be best fitting methodology for technology forecasting of electric vehicle battery technology [8,9]. Logistic Pearl formula is
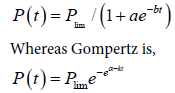
Plim is the asymptotic limit of the curve, αand k are two parameters which define the shape of the curve. In this article the results will be drawn by using both fitting methodologies and the best curve will be selected by using the methodology given by Martino.
However, in this article a mere mathematical result will not be derived, instead characteristics of different product development stages will be analyzed and the forecasting will be based on these characteristics with relevant feedback loops which is claimed to give more accurate results.
The analysis will be based on patents and articles on engineering indexes to estimate the research and technology development stages. Specific analysis will be made for patents and articles on cost reduction which is usually and issue of product development and marketing stages. Especially for Li_Ion batteries these phases could be seen and compared with Li-S and Li_Air Technologies. Research reports and articles will be analyzed to find the correlation with the analytical technology forecasting methods.
Firstly the battery technologies which can result in considerable performance improvements will be analyzed and will be compared will relatively mature Li_Ion technology.
Today in electric vehicles battery chemistry used is mainly Li_Ion. In 2012 Li_Ion Battery for electric vehicles power density of 400 W/kg and Specific Energy of 100 Wh/kg with a cost of 600 $/k- Wh. The objective for 2020 is 2000 W/kg, 250 Wh/kg and 125 $/kg [10,11]. However, still these values are not enough for significant sales increase of BEV’s (Battery Electric Vehicle) as the range still will be low compared to fossil fuels. The 3 new promising Technologies are Li- S, Li_Air and Zn_Air chemistries. Their possible estimated power and Energy density values are given in Table 2 [10,11].
| Attributes | Li-Ion (Obj.2020) | Li_S | Li_Air | Zn_Air |
|---|---|---|---|---|
| Power Density (W/kg) | 2,000 | 750 | 1,000 | - |
| Energy Density (Wh/L) | 250 | 250 | 250 | - |
| Theoretical Specific Energy (Wh/kg) | 600 | 2500 | 11,000 | 1,200 |
Table 2: Electric vehicle battery technologies comparison.
As seen from the above Table 2, Li_Air technology is a much promising technology for electric vehicle penetration. However, there are still many technical problems to be resolved. Zn_Air Technology are claimed to have less problems [12]. Below 3 technologies (Li-Ion, Li_S and Li_Air) will be analyzed to estimate the future development using technology forecasting methodology.
As a first step, the yearly patent priority dates for Lithium Ion has been obtained by using the PAT_Base patent search and analysis system. Priority date is the first date of filing of a patent application anywhere in the World and is considered to be the closest date to the invention.
Totally 39,844 results are found and for the last 20 years yearly quantities are shown in Figure 2.

Figure 2: Number of patent “Priority date” families for “Lithium ion”.
Before drawing the S-Curves some analysis is needed to be done. Year 2013 seems to have caused a sudden change of the shape of the curve. This may mean that data base is not yet up to date, and it may be safer to take into account data until 2012 and check the curves accordingly.
Another analysis is to be the done for the performance increase of Li_Ion battery since it is already in the market. In Figure 3, performance increase curve for electric vehicle Li_Ion battery is given as adopted from the relevant literature [11,13]. The figure shows significant increase of performance btw 1990 and 2015. Considering that commercialization takes around 10-12 years after the first patent filing and around 10 more years for automotive application [14], the increase in performance is due to the patents of 2005. The real inflection point starts at around 2008, so one can think that the performance of Li_Ion technology will continue to increase with the use of new cathode materials.

Figure 3: Performance increase of Lithium-ion batteries.
The values up to year 2012 is used and the “S Curve” using Logistic Pearl Formula is drawn by using Matlab, the result is shown in Figure 4 below.

Figure 4: S-curve with logistic pearl formula.
The two curves Logistic Pearl and Gomperts gives different results for “maturity stage” estimation. Logistic Pearl gives 2030’s whereas Gompertz gives 2040’s. To understand which technology forecasting formula to be used, the methodology explained by Francis will be used [15-17].
The auxiliary regression formula can be written as follows,

Using Matlab, c is calculated as 0.03418 with 95% reliability and b as –0.7964 and a as 1.728.
In line with this result Logistic Pearl is to be used as a determining methodology. Logistic Pearl shows that around 2030 patents will reach to a plateau and around 5 years later the technology roll-out could be realized. Therefore, around 2035 technological limit of Li_Ion Technology can be reached Figure 5 [18-27].

Figure 5: S-curve with Gompertz formula.
Logistic regression curve for technological forecasting has a drawback due to the difficulty ofparameter estimation. Rousseeuw and Christmann [28] have used hidden logistic regression model tocheck the robustness of the methodology. The parameter which influences the estimation resultmost is the plateau level (Plim ). In this paper, the results obtained from Matlab curvefitting will bechecked with LogLetLab [4] results with 90% confidence level. In Figure 6, the graph shows the same valueof the year as the patents to reach a plateau [18-25].

Figure 6: S-curve with logistic pearl formula using LogLetLab parameter estimation.
On S-Curve methodology estimation of the saturation level changes the curve and the estimation of the saturation year considerably. Therefore, a detailed analysis of patents and also related articles and reports becomes very important for the robustness of the process besides the curve-fitting robustness. Analysis of the keywords between year 1995-2008 and 2008-2015 shows different characteristics of patents. Between 1995-2008, the keywords were basically on material types after 2008 keywords on electrodes, battery systems were the fore coming ones. However, still keywords like, battery packs, cost, charging, quality etc. are missing, and therefore it is probable that the number of patents could reach to 10000 level per year.
When Li_S and Li_Air patents are analyzed using PATBASE patent search system, it is seen that number of patents compared to Li_Ion is quite limited up to date 2016. For Li_S the total number of patent families are 263 and for Li_Air the number is 768. S curves using Logistics Pearl formula are shown in Figures 7 and 8. The figures indicate that Li_Air patents will reach a plateau at year around 2040 and Li_S around 2045. Assuming that the technologies will be at application level after 5 years, these Technologies will reach maturity in the market at around 2050’s [26-28].

Figure 7: Li_S patents S-curve.

Figure 8: Li-air patents S-curve.
However, for Li_S and Li_Air Batteries the number of patents are yet quite low, and technology seem to be only at the initial stages of the S-Curve and not even on the acceleration phase. Therefore, the results obtained only through the S-Curve methodology will not be reliable. An analysis of the literature is necessary to see if the estimated saturation year is reasonable or not. Several articles [12,29] state problems on rechargebility and life of Li_Air cells. Also there will be new challenges when the ambient air is used instead of pure oxygen. Therefore, there is a necessity for an important purge on R&D efforts on Li_Air battery technology. The estimated timing for possible application of new technologies seems to be reasonable considering also expert views on the subject.
In order to estimate the future market size for a certain product the following steps is to be followed,
1. Define the market.
2. Divide total industry demand into its main components.
3. Forecast the drivers of demand in each segment and project how they are likely to change.
4. Conduct sensitivity analyses to understand the most critical assumptions.
In this study, electric vehicle market penetration will be estimated through the analysis of the main drivers of the market. For electric vehicles main barriers are battery performance and cost, and the access to charging infrastructures [30,31]. We assume that battery performance and cost will be more critical and charging infrastructure will follow the development and trend on the market. In this case the results of the above analysis will be most critical for the market penetration estimation.
S-Curves methodology to analyze the future of Li_Ion, Li_S and Li_Air technologies show that Li_Ion batteries will continue to improve steadily reaching a plateau at around 2035’s. Li_S and Li_air technologies will be at a good point at around 2050’s. Considering that gasoline has around 12000 Wh/kg, for a reasonable electric vehicle market diffusion Li_Air technology should reach a maturity level which will most probably after 2050’s. Therefore these results suggest a gradual increase of electric vehicle market up to 2050’s and a more accelerated increase of the market after 2050. Incremental innovations on Li_Ion battery systems will change the inclination of the market penetration.
The authors thank GroupOfis for their Support for patent analysis and to Assistant Professor, Tuba Gulpinar for her support for auxiliary regression methodology.