Journal of Aeronautics & Aerospace Engineering
Open Access
ISSN: 2168-9792
ISSN: 2168-9792
Research Article - (2017) Volume 6, Issue 4
This paper describes a numerical study of gas-gas ejector performance for different operating conditions and geometrical configurations. The performance of ejector obtained based on a simulation procedure of linearized and axisymmetric subsonic and supersonic flow using Fluent Package. A conventional finite-volume scheme utilized to solve two-dimensional transport equations with the standard k-ω SST turbulence model. The model is solved in three regions namely, the primary flow nozzle, the secondary flow channel, and the region of interaction between the supersonic nozzle jet and the secondary flow. The effect of gas motive pressure the mixing part and tail section (pipe or diffuser) geometry on the ejector performance are studied. The computational results are validated using published experimental data with acceptable agreements. The numerical results indicate that the ejector geometry has a pronounced effect on the flow parameters (i.e., pressure and gas velocity) and the ejector performance. In addition, predicted numerical results indicate that when the motive-stream velocity exceeds the speed of sound, shock waves are unavoidable inside ejectors and that shock wave pattern in mixing part has a dominant effect on ejector performance. In addition, the results indicate that the shock location inside the nozzle and the separation point are affected by the motive pressure. The results show also that configuration with convergent-divergent mixing section is much better for mixing process than the other tested configurations.
<Keywords: CFD; Ejector configuration; Shock wave; Supersonic flow; Turbulent
D: Ejector Diameter, mm; E: Total Energy, kJ/kg; G1: Geometry Configuration (1); G2: Geometry Configuration (2); G3: Geometry Configuration (3); L: Mixing Part Length, mm; Ls: Suction Part Length, mm; Lt: Tail Part Length, mm; NXP: Nozzle Axial Position; P: Pressure, Pa; r: Radial Coordinate, m; Rair: Air Gas Constant, kJ/kg·K; t: Time, sec; T: Temperature, K; u: Velocity, m/s; x: Axial Coordinate, m
α: Thermal conductivity; θ: Inclination angle, deg; μ: Dynamic Viscosity; ρ: Density, kg/m3
conv: Convergent Section; dif: Diffuser; div: Divergent Section; g: Gas; i, j, k: Space Components; m: Motive flow om: Motive Stagnation; s: Suction
Low-grade energies can be produced from many sources such as automobile engines, industrial processes and solar radiations, etc.; recovering these energies through ejector system benefits our society both economically and environmentally. Ejectors may also be used for mass transfer, namely, liquid-liquid extraction, gas absorption, stripping, fermentation, hydrogenation, chlorination, etc. One of the most promising applications is the biotechnological treatment of industrial gaseous wastes which concerns many industries: automobile industry, petrochemical, printing, fine and heavy chemicals industry, etc. The objective of ejector design is to produce intense mixing between the primary and secondary fluids, and get large entrainment of the secondary fluid, or pump fluids from a region of low pressure to a region of high pressure, depending on its area of application. The ejector is made up of different components namely the primary flow discharge nozzle, the mixing part which can be either of constant or variable cross-sectional area, where the mixing of primary and secondary streams occurs, and the diffuser. The schematic diagram of Figure 1 displays the main components of an ejector.
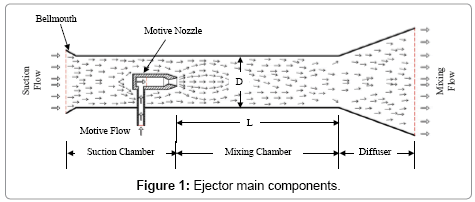
Figure 1: Ejector main components.
Ejectors can be operated with compressible or incompressible fluids, and have found many applications in engineering, as reported in configuration dependence and optimization of the entrainment performance for gas-gas and gas-liquid ejectors [1], such as refrigeration, aerospace, chemical and biochemical process industries. In air-conditioning or refrigeration; their application totally replaces mechanical compressors or simply be used for cycle optimization. In aerospace engineering, ejectors are used for thrusting augmentation, exhaust noise suppression, altitude testing or to mix exhaust gases with fresh air in order to reduce the thermal signature. In chemical and biochemical process industries, ejectors are widely used for entraining and pumping corrosive fluids, slurries, fumes and dust laden gases, etc., which are difficult to handle, such as, recovering natural gas from gas/oil mixture in oil storage tank. Theoretical study of ejector can be classified into two categories according to the method of mixing namely constant-area mixing method and constant-pressure mixing method, both of which were first proposed by Keenan et al. [2]. The latter are believed to give superior performance and more widely used. In fact, constant-pressure mixing model reported [2] is considered as the first comprehensive theoretical analysis of ejector design. Conventional theoretical methods are usually based on the 1-D fluid dynamics theory assuming that the velocities of both the primary and the secondary flows are uniformly distributed in the radial direction [3]. Recently, a shock circle model has been proposed to tackle the actual non-uniform velocity distribution by introducing a ‘‘shock circle” at entrance of the constant-area mixing chamber [4,5]. These theoretical results can be used to analyze the influence of certain ejector geometries, such as the primary nozzle throat diameter and the mixing part diameter on the ejector performance. However, the effects of other important parameters such as the primary nozzle exit position "NXP" which represent axial direction nozzle exit position and the converging angle of the mixing section are not reflected from the theoretical models due to the limitation of the 1-D flow simplification used in these models.
In recent years the commercial CFD software programs have received increasing attention in that they are capable of dealing with the complicated supersonic flowing and mixing problem and at the same time, revealing the internal local phenomena clearly. As compared to experimental measurements and observation of the previous researches, the CFD technique turns out to be a more efficient diagnosis tool for ejector analysis which gives a better insight into how ejectors function yet at a reasonable cost.
As seen from Table 1 and according to configuration dependence and optimization of the entrainment performance for gas-gas and gasliquid ejectors [1] the mixing tube length has significant effect on the mixing of the primary and secondary flows. Ejector performance of gassolid flow through ejector and analysis and testing of high entrainment single nozzle ejectors with variable area mixing tubes [6,7] was carried out for different ejector geometries with fixed mixing tube length 10 times the mixing tube diameter. In the experimental investigation given in mass transfer in jet loop reactors [8], the results showed that mixing tube length seems to have no obvious effect and changes of L/D ratio from 2 to10 results give in a slight decrease in the efficiency of ejector. On the other hand [9] showed that ejector with high L/D ratio values creates higher volumetric mass transfer coefficients compared to that with a lower values. However, the experiments done by Havelka [10] showed that when L/D ratio increases the suction rate increases until it reaches L/D greater than 6 after which the suction rate remains almost constant. Likewise Yukimaru et al. and Keenan and Neumann [11,12] reported that an optimum mixing tube length is about 7-10 times the mixing tube diameter. On the other hand, the CFD studies of Kandakure and Balamurugan [13,14] indicated that the entrainment rate has the maximum value when the ejector L/D ratio is equal to zero, i.e., no constant-area mixing tube at all. While the study by Huang et al. [15] showed that the optimum NXP normalized by the throat diameter is about 1.5 for gas ejectors.
From these studies and that which are shown in Table 1 [16-20], it is clear that the optimum length varies greatly with the operation conditions and it is difficult to find general relations to ejectors configurations values that meet all the required conditions.
Therefore in the present work, configuration dependence of the mixing performance and internal flow-field changes for air-air ejectors are studied. The evaluation of the performance of ejector is based on a simulation procedure of linearized and axisymmetric subsonic and supersonic flow using ANSYS Fluent Computational Fluid Dynamics (CFD) software. The effects of ejector geometries and operating conditions on mixing performance and internal flow field changes are investigated in detail. Distinct characteristics of internal flow fields for air-air ejectors are demonstrated and analyzed, which have significant importance on ejector design and operation.
The commercial package, Gambit 2.4.6 and ANSYS 14 using Fluent14 [20] are used as the grid generator and the CFD solver, respectively. The grid mesh element size and aspect ratio selections come after many trails from coarse grid meshing to dense ones and it has been selected based on the best of computational time consumption and relative accuracy. The selected grid meshing size firstly is composed of about 400,000 - 500,000 quadrilateral elements depending on the length of ejector with mesh quality of minimum orthogonal quality equal to 8.04913e-01 and maximum aspect ratio equal to 2.50071e+01(according to Fluent mesh quality indicator [20]. While the cells close to primary nozzle, walls and mixing section is dense enough to solve the complex flow phenomenon at each. Secondly, in order to predict better the internal flow status, solution-adaptive mesh refinement is employed and more cells are added at locations with significant flow changes such as, the interaction region between the supersonic stream and the low speed secondary stream, and the region with adverse pressure gradient caused by shocks, etc. The resulting mesh thus enables the features of the flow field to be better resolved. Since the axisymmetric solver is adopted, the threedimensional effect has been taken into account by this two-dimensional computational domain (Figure 2).
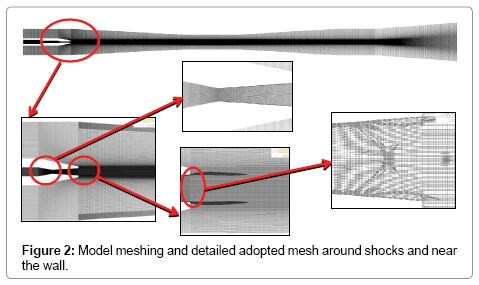
Figure 2: Model meshing and detailed adopted mesh around shocks and near the wall.
Governing equations
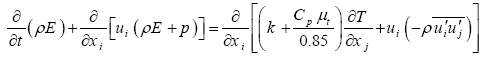
The flow in the ejector is governed by compressible steady axisymmetric conservation equations. For variable density flows, the averaged Navier–Stokes equations are used in this work. The total energy equation including viscous dissipation is also included and coupled to the set of equations with the perfect gas law. The governing equations can therefore be written in compact Cartesian form as:
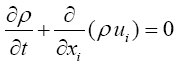 (1)
(1)
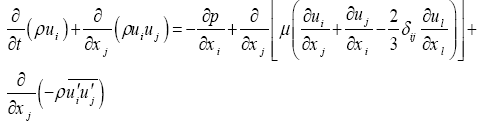 (2)
(2)
 (3)
(3)

Where u'i is fluctuating velocity and i, j,k subscribe to space components.
The unsteady term is conserved, as the steady state is desired, so governing equations are solved using temporal discretization using the implicit time-marching scheme.
Turbulence modeling
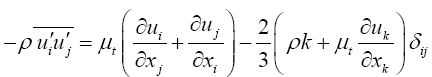
The turbulence modeling used in this paper relies on the Boussinesq hypothesis. It is based on an eddy viscosity assumption, which makes the Reynolds stress tensor coming from equation averaging, to be proportional to the mean deformation rate tensor:
 (5)
(5)
where k is turbulent kinetic energy. The advantage of this approach is the relatively low computational cost associated with the determination of the turbulent viscosity. However, the main drawback of this hypothesis is the assumption that the turbulence is isotropic. The k–ε, RNG–k–ε and k–ω models are based on this hypothesis. Based on simulation results, RNG and SST–k–ω models appear to be very promising for ejector analysis as reported in numerical and experimental investigations on supersonic ejectors. [21]. According to Balabel [22] it found that the numerical predictions using the SST–k–ω turbulence model show close agreement with the experimental measurements. In addition, it found by Bartosiewicza et al. [21] that the RNG and SST– k–ω models are the best suited to predict the shock phase, strength, and the mean line of pressure recovery. However, the SST–k–ω model has further shown better performances in term of stream mixing. The most important drawbacks for any model are related to its ability to predict correctly the strength of the expansion cells; therefore, the SST–k–ω turbulence model is used in the present study.
The SST–k–ω and Standard k–ω Models: As reported in ANSYS Software [20], the shear-stress transport SST–k–ω model was developed by Menter [23] to effectively blend the robust and accurate formulation of the k–ω model in the near-wall region with the free stream independence of the k–ε model in the far field. The SST–k–ω model is similar to the standard k–ω model, but includes the following refinements:
• The standard k–ω model and the transformed k–ε model are both multiplied by a blending function and both models are added together. The blending function is designed to be one in the near-wall region, which activates the standard k–ω model, and zero away from the surface, which activates the transformed k–ε model.
• The SST model incorporates a damped cross-diffusion derivative term in the ω equation.
• The definition of the turbulent viscosity is modified to account for the transport of the turbulent shear stress.
• The modeling constants are different.
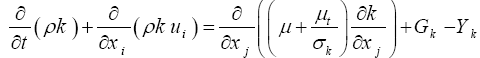
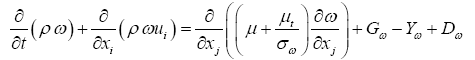
The model of the transport equations for k and ω are as follows:
 (6)
(6)
and,
 (7)
(7)
In these equations, σk and σω are the turbulent Prandtl numbers for k and ω respectively [20]. The term Gk represents the production of turbulence kinetic energy. Gω represents the generation of ω, calculated as described for the standard k-ω model. Yk and Yω represent the dissipation of k and ω due to turbulence and Dω represents the crossdiffusion term.
The turbulent viscosity, μt, is computed as follows [20]:
 (8)
(8)
where S is the strain rate magnitude and the coefficient α* is a function of the turbulence Reynolds number as reported in [20], and provides a damping of the turbulent viscosity in low Reynolds regions where in high Reynolds regions α*=1, and the blending function F2 is given by:
 (9)
(9)
Where, y is the distance to the next surface.
This model works very well inside the boundary layer, but it has to be abandoned in the wake region and outside. This is because the standard k–ω model has a very strong sensitivity to the free-stream conditions as reported in [23]. The standard logarithmic wall functions are considered and the classical linear law is taken for the sub-layer.
Boundary conditions and solution strategy
The governing equations used in mathematical modeling are solved using ‘‘2-D axi-symmetric, steady, absolute velocity formulation and pressure based” solver. A First-order upwind scheme is adopted to discretize convective terms. The well-known SIMPLE algorithm is applied to obtain the pressure field.
The working fluid of the model is ideal gas (air). Its density and other properties such as specific heat, thermal conductivity, viscosity and molecular weight are obtained from Fluent Fluid Materials Database.
Boundary conditions of the primary and secondary flows at inlets are set as ‘‘pressure inlet” condition, while the ‘‘pressure outlet” condition is adopted on the outlet of the ejector, as shown in Figure 3. For each simulation, the solution is iterated until convergence is achieved (residue for each equation is less than 10-5). In general, it is observed that the residue for the momentum equations, the turbulent kinetic energy and turbulent energy dissipation rate are well below 10-5. And the continuity equation residue is below 10-5, while the residue for the energy equation is below 10-7.
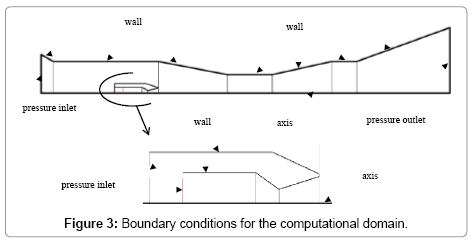
Figure 3: Boundary conditions for the computational domain.
In order to validate the present model, a comparison between the present predicted wall static pressure distributions and published theoretical and experimental data reported in [7] is shown in Figure 4. The presented comparison uses the same conditions of motive stagnation pressure and temperature, POm= 24 bar & TOm = 704 K for the tested ejector. The comparisons show acceptable agreement at the tail part of the ejector model with both theoretical and experimental data of [7] for both discretization methods 1st order upwind, which is used in this model, and 2nd order upwind with momentum. At the straight section of the mixing part there is slight difference between using 2nd order and 1st order upwind where the 1st order upwind data is closer to theoretical data of [7] than 2nd order upwind, so the present theoretical model uses 1st order upwind discretization for all equations. The slight decrease in static pressure at the mixing part of the model is caused because of using the very fine meshing at this part, which captures any changes in flow properties, like that at the intersection with the convergent and divergent section with the constant section in the mixing part. This decrease may be also due to using of the SST–k–ω model, which has further better performances in stream mixing, and better prediction of the shock phase, strength, and the mean line of pressure recovery.
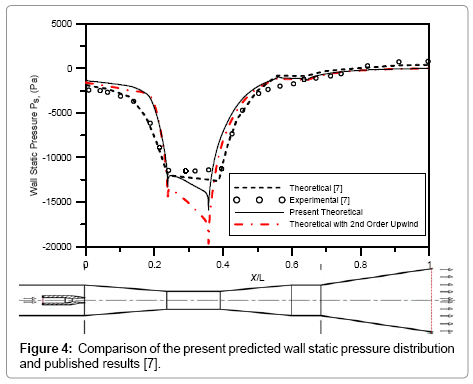
Figure 4: Comparison of the present predicted wall static pressure distribution and published results [7].
Ejector Configurations
Three ejectors with different configurations are used here based on pervious study as given in Table 1. The tested models configurations are selected with geometrical parameters of L/D=10 and NXP=0. These configurations are referred as geometry-1 (G1), geometry-2 (G2) and geometry-3 (G3) respectively.
All ejectors contain the driving convergent-divergent nozzle (motive nozzle). This nozzle is fixed inside the ejector so much so its exit section coincides with the end of suction part. The throat diameter of this nozzle is 2 mm while the area ratio Aratio is taken to be equal 4.
The tested configurations are shown in Figure 5 and the detailed dimensions of each part of the ejectors are summarized in Table 2.

Figure 5: Geometric parameters of tested ejectors.
Effect of ejector geometry on wall static pressure
Figure 6 indicates the effect of configuration of the three simulated ejectors on the wall static pressure at the same motive pressure (Pm=7 bar). For the considered three configurations, the straight part length and the position of injection are identical. From Figure 6 it can be noticed that configuration G2, provides high inlet vacuum pressure (Ps= - 800 Pa). The inlet vacuum pressure for G3 is Ps = - 400 Pa and that for G1 is Ps= - 600 Pa. Therefore, the suction air mass flow rate for G2 is higher than that of geometry-3 for the same motive gas pressure. The figure also shows that, G3 achieves the highest vacuum pressure compared to G2 and G1. This vacuum pressure (Ps= - 4000 Pa) prevails at the throat due to the effect of area change of the mixing part which has no further notice on air suction flow rate but causes better mixing than the two other configurations.
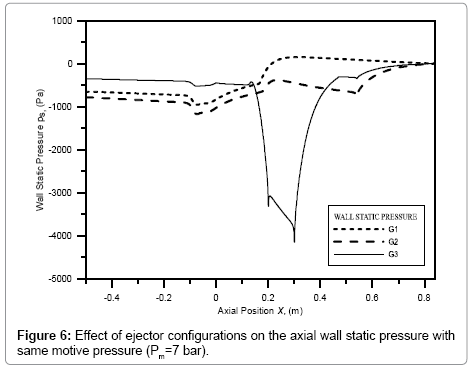
Figure 6: Effect of ejector configurations on the axial wall static pressure with same motive pressure (Pm=7 bar).
Increasing vacuum inlet pressure for G2 rather than G1 is intended to the presence of the tail diffuser, which provides lower pressure at the mixing part of the ejector. On the other hand, for G3 although the diffuser exists but vacuum inlet pressure is lower than both other geometries (G1 and G2) and that is related to the presence of the convergent section in the mixing part which provides higher pressure at the mixing part of the ejector. It is seen that G3 has the most changes in flow characteristics other than G1 and G2, so more investigation will be presented on G3 for the comparison of ejectors performance for the same geometrical parameters.
Effect of motive pressure on wall static pressure
Figure 7 depicts the effect of motive gas pressure on the wall static pressure distribution along the ejector for G3. From this figure it can be concluded that increasing the motive gas pressure tends to increase the vacuum pressure. The minimum value of wall static pressure changes from -800 Pa for Pm= 3 bar to -4000 Pa for Pm = 7 bar. The figure shows also that the minimum pressure prevails at the end of throat for the tested three motive pressures. This behavior reveals that the area of the convergent-divergent part has more influence on the static pressure compared with the mixing process between the motive and the suction fluids.
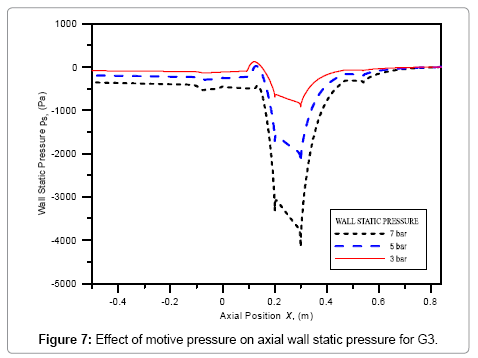
Figure 7: Effect of motive pressure on axial wall static pressure for G3.
Effect of ejector configuration on air velocity along mean streamline of the half shape
The magnitude of the vacuum pressure affects the air velocity distribution. The velocity of the mixing flow at throat for G3 reaches the highest value (ug = 90 m/s) due to the change of ejector area as shown in Figure 8a. The mean streamlines of the half shape for the three simulated ejectors are presented in Figure 8b. The gas velocity along mean streamline of the half shape is used to describe the secondary flow stream.
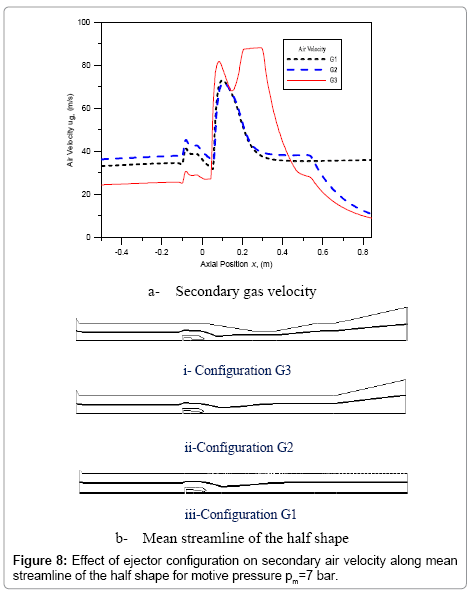
Figure 8: Effect of ejector configuration on secondary air velocity along mean streamline of the half shape for motive pressure pm=7 bar.
Effect of ejector configuration on centerline gas velocity
The centerline velocity of the flow at nozzle exit for G3 reaches the highest value ug = 600 m/s which represents a supersonic flow with about Mach number of 2.7 and then the flow starts to oscillates as shown in details in Figure 9 and then the centerline velocity in the jet core is reduced under effects of mixing with entrained flow until at certain position complete mixing is achieved as shown in Figures 9a and 9b.
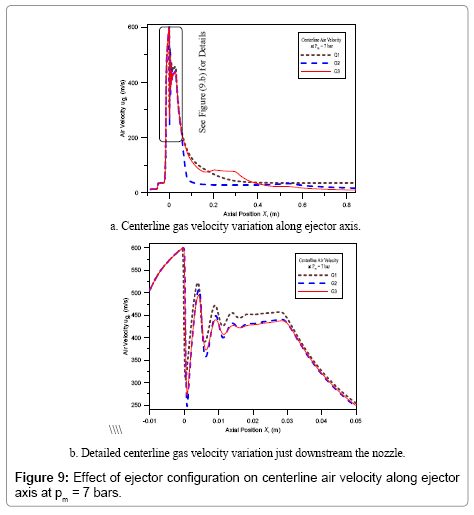
Figure 9: Effect of ejector configuration on centerline air velocity along ejector axis at pm = 7 bars.
Effect of ejector motive pressure on centerline gas velocity for G3
Figure 10 shows the effect of changing the motive pressure on the centerline gas velocity for G3 configuration. The figure indicates that if the motive velocity just exceeds the sound speed oscillations inside and downstream the nozzle in the mixing part will properly exist as shown for motive pressure values of 3, 5 and 7 bar.

Figure 10: Effect of motive pressure on centerline air velocity downstream the nozzle along ejector axis for G3 configuration.
Mixing between entrained and motive flows
Figure 11 shows the predicted air velocity variation along the ejector for the three tested configurations. While Figure11a shows velocity distribution for motive flow and entrained flow streamline where motive flow streamline indicated by ejector centerline streamline downstream the nozzle and entrained flow streamline indicated by mean streamline of the half shape for ejector G3 at motive pressure of Pm=7 bar. From the figure it is seen that the motive flow at x = 0 starting to exit from the convergent-divergent nozzle while gas velocity reaches ug=600 m/s. This flow starts to oscillate under the effect of shock waves until it decays at x = 30 mm where the momentum exchange between the two flows starts to take place. During mixing the motive flow velocity starts to decrease and entrained flow velocity increases until full mixing occurs at xmixing=200 mm and the two flow streams start to take the same behavior through the mixing part of the ejector. Figures 11b and 11c show the effect of configuration G1 and G2 on the full mixing position where xmixing= 530 mm and xmixing= 300 mm for G1 and G2 respectively.
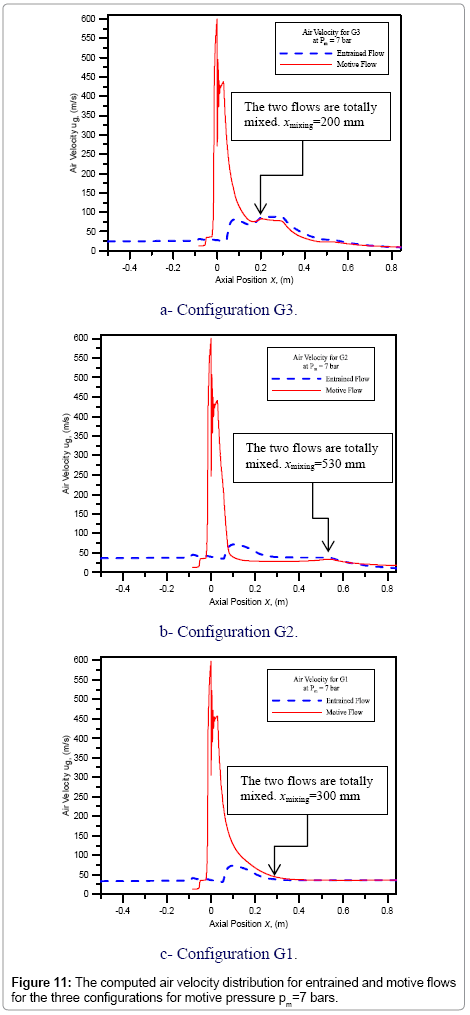
Figure 11: The computed air velocity distribution for entrained and motive flows for the three configurations for motive pressure pm=7 bars.
Velocity profiles
In order to give a good indication of the internal flow patterns for tested geometry, Figure 12 shows development of the velocity profiles at motive pressure Pm = 7 bar at different sections of the ejector for the mixing parts and tail parts of the three tested configuration G1, G2 and G3 respectively.
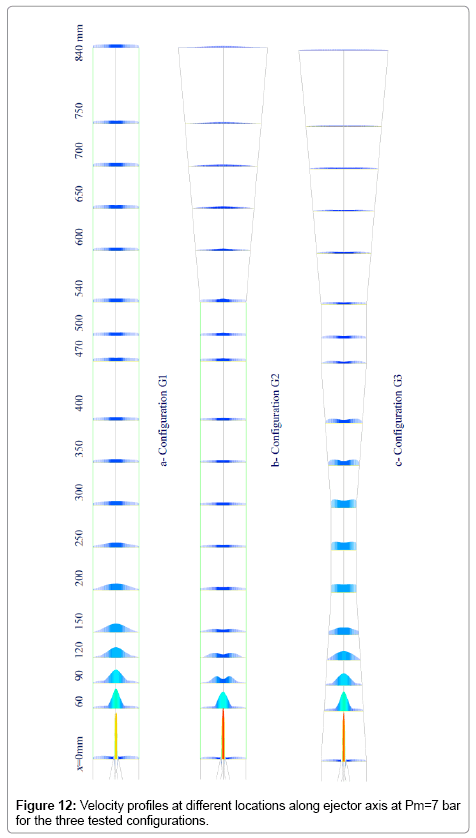
Figure 12: Velocity profiles at different locations along ejector axis at Pm=7 bar for the three tested configurations.
In addition to understand the flow behavior through configuration G3 Figure 13 indicates the effect of motive air pressure on the velocity profiles for the ejector in case of G3 configuration at different axial positions along the ejector geometry. From this figure it can be concluded that increasing the motive air pressure tends to increase the velocity magnitudes. For x = 0 mm (exit from the nozzle) the velocity magnitude changes from 20 m/s "subsonic" along the radial direction from wall to almost at R=2 mm to 580 m/s "supersonic" at the nozzle exit. For x = 250 mm where mixing and shock waves start to decay the minimum value of velocity changes from 33 m/s at the ejector centerline for Pm= 3 bar to 79 m/s for Pm = 7 bar.
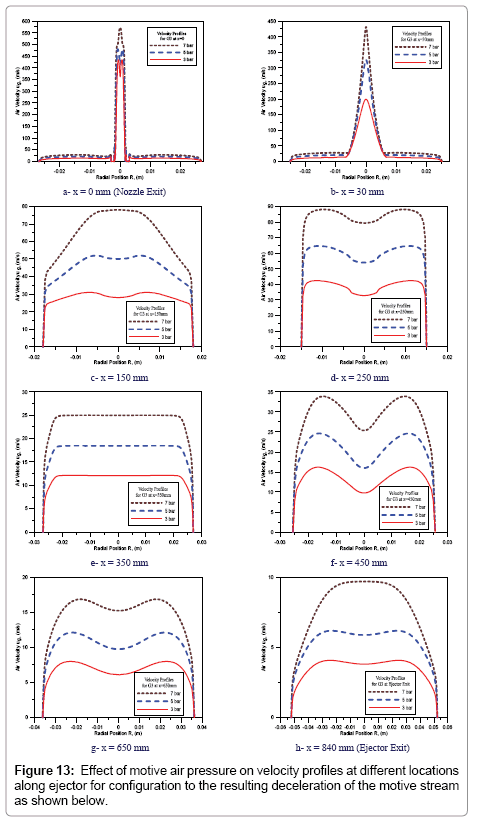
Figure 13: Effect of motive air pressure on velocity profiles at different locations along ejector for configuration to the resulting deceleration of the motive stream as shown below.
Effect of ejector configurations on shock wave and internal flow field
Figure 14 shows the Mach number contours for G3 configuration at Pm = 7 bar, in which the centerline Mach number variation downstream the nozzle exit is calculated and plotted in the Figure 15.
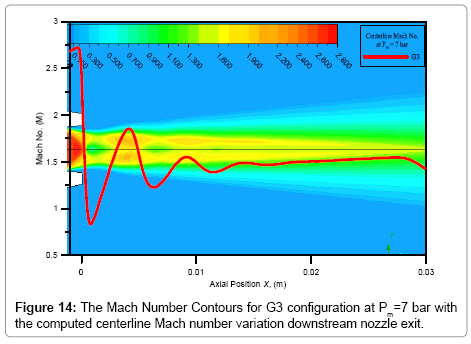
Figure 14: The Mach Number Contours for G3 configuration at Pm=7 bar with the computed centerline Mach number variation downstream nozzle exit.
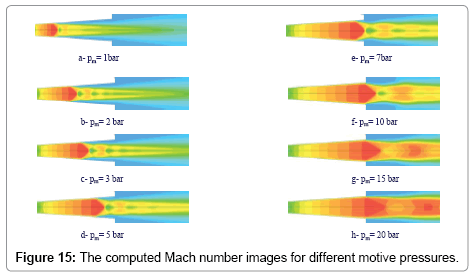
Figure 15: The computed Mach number images for different motive pressures.
Due the existing shock wave pattern (pseudo-shock) the Mach number changes from supersonic flow condition M = 2.7 into subsonic M = 0.8 and then it rises again to M = 1.8 and Mach no value decays until it reach almost M = 1.5, after which the momentum exchange between the motive and entrained flows takes place where the shock waves vanish at this state. According to Figure 14, it can be noticed that when the motive-flow velocity exceeds the speed of sound, shock waves are unavoidable inside ejectors.
Shock waves convert velocity back to pressure, but in an inefficient manner. The motive flow is accelerated to a supersonic velocity through the convergent-divergent nozzle. Then, inside the mixing section, the entrained flow is induced by a strong shear force with the motive flow making the flow inside the ejector is exposed to a strong inviscidviscous interaction where the shock wave occurs in this step leading to the resulting deceleration of the motive stream as shown below.
In order to provide better understanding of turbulent flow behavior inside the convergent–divergent nozzle, the SST turbulence model is applied in the present numerical simulation for supersonic ejector with G3 configuration flow for a wide range of gas motive pressures. The computed Mach number contours for different motive pressures 1, 2, 3, 5, 7, 10, 15 and 20 bars are plotted in Figure 16.
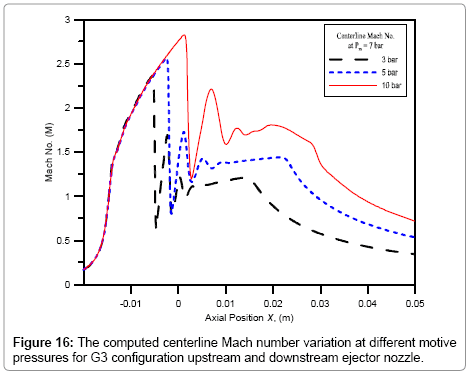
Figure 16: The computed centerline Mach number variation at different motive pressures for G3 configuration upstream and downstream ejector nozzle.
These contours describe briefly the principal separation phenomena and the pseudo-shock in and downstream the supersonic convergentdivergent nozzle. One can see clearly near the wall, the separation shock consists of incident and reflected oblique waves that merge into a Mach stem at the triple point. This is so-called lambda foot of the shock as discussed in [5,22].
The present results show that for Pm = 3 bar as shown in Figure 15c, a nozzle pseudo-shock with a pronounced lambda foot structure and fully detached separation layer extended from the leading lambda shock in downstream. The separation region formed downstream can be considered as consequence of the adverse pressure gradient through the shock, which forces the incoming boundary layer to separate. The oblique shock structures are of the weak type resulting in low supersonic flow downstream while the flow immediately past the Mach stem is subsonic as discussed as reported [22].
The same results are obtained for subsequent motive pressures greater than 3bar, as shown in Figures 15d and 15e Moreover, the separation shear layers emerged as expansion fans and transmitted across the test section to the opposite shear layer and then reflected again as compression waves. This reflection continues downstream, resulting in a series of expansion and compression waves through the separation region which is so-called "shock train".
By increasing the motive pressure, the lambda shook foot is grown significantly, such that the main shock and the trailing lambda foot are located behind the nozzle exit. The nozzle is shock free and the flow is found to be over-expanding externally, as shown in Figures 15f, 15g and 15h for pm= 10, 15 and 20 bars, respectively. Also, these figures show multi interaction of compression and expansion wave downstream of the nozzle exit. This phenomenon is similar to the supersonic jet behavior.
The above results indicate that the shock location inside the nozzle and the separation point are affected by the motive pressure. Therefore, a wide range of motive pressures has been simulated using the SST turbulence model. The results indicate that by increasing the motive pressure, the shock position as well as the separation point moves downstream (Figure 16).
Nozzle wall shear stress τw distribution for different motive pressures is plotted in Figure 17. For separated flow at low motive pressure. The results indicate that the flow did not attach the nozzle surface and the free shear layer started at the trailing lambda foot is completely detaching past the shock. As the separation point becomes near the effective nozzle exit, the lambda shock system adjusted to satisfy continuity of pressure and flow direction. This trend is indicated by a slight increase of the shear stress near the nozzle exit as discussed in [22].
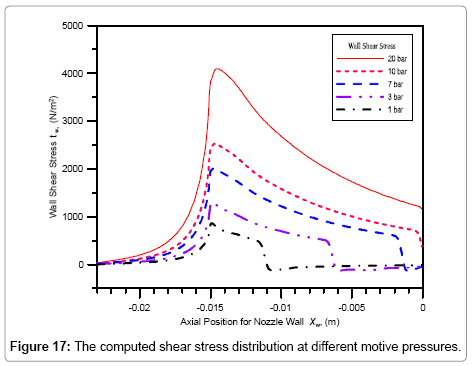
Figure 17: The computed shear stress distribution at different motive pressures.
In general the results indicate that the shock location inside the nozzle and the separation point.
In the present study 2-D axisymmetric air-air ejector performance at different configurations is investigated. The study is performed using the SST- k-ω model with the velocity and pressure SIMPLE coupling algorithm and adopted mesh is considered in order to capture the flow characteristics changes inside the ejector.
The analysis of the theoretical results leads to the following conclusions:
1. The proposed theoretical model is suitable for predicting the flow through the ejector.
2. The ejector geometry has a pronounced effect on the flow parameters (i.e., pressure, air velocity) and the ejector performance.
3. The suction air velocity increases with increasing the motive air pressure.
4. The velocity distribution along the ejector length depends mainly on both the ejector geometry and the motive gas pressure.
5. As the motive-stream velocity exceeds the speed of sound, shock waves are unavoidable inside ejectors
6. Shock wave position is affected directly by the motive air pressure changes.
7. Mixing for the ejector in convergent-constant-divergent mixing section "G3" is much better than the two other ejectors configurations as the mixing is finished earlier than the others.
8. Flow separation inside the nozzle is affected directly by the motive gas pressure where no separation occurs for motive pressure larger than 8 bars.