Journal of Geography & Natural Disasters
Open Access
ISSN: 2167-0587
ISSN: 2167-0587
Research Article - (2015) Volume 5, Issue 1
In the present paper, we analyze the GPS-TEC data which observed at Agra station, India (27.2o N, 78o E) and also see the diurnal variations of global ionospheric maps (GIMs) TEC data over the epicenter of this earthquake (M=7.8) in Pakistan region for the month of April, 2013. We use a statistical technique for the analysis of data and identify the significant precursors using 3σ criterion. These precursors are found in form of enhancements on different days in the interval of 5-7 days prior to the earthquake. We also see the effect of geomagnetic storm and solar activity on TEC data and found no anomaly associated with them.
Keywords: GPS-TEC; Major earthquakes; Case study
In the last few decades, researchers have presented several results to predict the electromagnetic phenomenon [1,2]. For which, Pulinet et al. [3] have presented a very excellent review on the ionospheric precursors of the earthquakes. There are many ways for prediction of earthquake but in the recent time, GPS based measurements have taken more attention due to its availability around the globe. The measurements of GPS based total electron content (TEC) are giving very interesting results in the relation to earthquakes precursors, the statistical study of TEC have also more attainable due to its significant results. Many researchers have shown the statistical study of TEC and show the very convincing results. For example, Liu et al. [4] have shown the results of both the foF2 measurements using Chug-Li ground based ionosonde and GPS based total electron content (GPSTEC) measurements corresponding to Chi-Chi earthquake (M=7.7) in Taiwan and concluded that the ionospheric precursors period was 1-4 days. Liu et al. [5] have examined the effect of 20 earthquakes (M ≥ 6.0) occurred in Taiwan area between 1999 to 2002 on the variation of TEC and found 1-5 days precursory period. They have shown that the success rate of 80% proves that TEC measurements much effective than the other techniques for the prediction of earthquakes. Chen et al. [6] have presented the results of the analysis of foF2 data for pre-earthquake ionospheric anomalies using two statistical tests. The statistical study of TEC data for pre-earthquake ionospheric anomalies have also been presented in two valuable research papers [7,8]. Liu et al. [9] have analyzed the global ionospheric maps (GIM) and GPS data of TEC to see the anomalous variation associated with 35 M ≥ 6.0 earthquakes that occurred in China using a statistical based quartile analysis for the period of 10 years from 1 May 1998 to 30 April 2008 and shows that the GPS-TEC decreased above the epicenter on 3-5 days before 17 M ≥ 6.3 earthquakes. Further they have shown the anomalous variations during the Wenchuan earthquake of magnitude Mw=7.9 on 12 May 2008. Akhoondzadeh et al. [10] have statistically analyzed the variations of electron and ion densities in the light of four large earthquakes and they found a very good agreement between the different parameters estimated by DEMETER satellite and GPS data in the detection of pre-seismic anomalies. The results of statistical analysis show that the anomalous variations prior to earthquakes and the appearance of positive and negative anomalies of GPS-TEC and DEMETER satellite data during 1-5 days before all considered earthquakes during the geomagnetically quiet period. Kon et al. [11] have used a statistical superimposed epoch analysis (SEA) to analyze the GIM data for the period of 12 years and consider the large number earthquakes even low magnitudes, the results show 1-5 days of precursory period. Recently, Akhoondzadeh [12] has studied the GPS-TEC variation associated with the powerful Tohoku earthquake of 11 March 2011, and reported convincing precursors 1-3 days prior to occurrence of earthquake. More recently, Pulinets and Davidenko [13] have presented the study of ionospheric precursors of earthquakes and a good review on the understanding of the seismo-ionospheric coupling. Above discussion proves that statistical studies may be consider as the most dominant tool for the study of earthquakes precursors.
In this study, we analyze the GPS-TEC data observed at Agra station, India (27.2° N, 78° E) and also see the diurnal variation of GIM-TEC data over the epicenter for the month of April, 2013 using the statistical technique. The precursors are found in the form of enhancements beyond the 3σ.
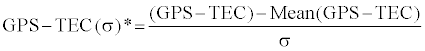
We analyze the GPS-TEC data for the month of April 2013 observed at Agra station corresponding to the occurrence of a major earthquake of magnitude M=7.8 using a statistical technique as suggested by Kon et al. [11] to identify the abnormal signal properly for case study. For which, we compute the mean GPS-TEC values for the previous quiet 15 days, and the corresponding standard deviation (σ). Then, we derive the normalized GPS – TEC (σ)* values by the following equation;
To see the anomalous variations in data, we use the 3σ criteria first time for this purpose to find the significant precursors corresponding to this major earthquake.
Figure 1 shows the map of Asia which consist of epicenter of major earthquake M=7.8 (by star) and observing station Agra (by black solid circle). The radius of influence is calculated by expression R=10(.43M), where M is the magnitude of earthquake [14]. The details of earthquake have been taken from the Indian Meteorological Department (IMD) website of www.imd.gov.in. Figure 2 shows the diurnal variations of GPS-TEC data in upper panel for the month of April, 2013 which observed at Agra and the solid star indicate the day of earthquake. The solid line shows the limit of ±3σ criterion. The second panel of Figure 2 show the plot of anomalous variations in the TEC data during the same period in the form of enhancements (in percentage) by histograms.

Figure 1: Shows the map of Asia which include the epicenters of earthquakes (shown by star) and the observing stations Agra (shown by black circle).

Figure 2: Upper panel shows the temporal variations of GPS-TEC observed at Agra station for the month of April, 2013 corresponding to an earthquake of Magnitude M=7.8. The black star shows the day of earthquake. In second panel, the enactments (%) are shown over the upper limit (3s). The variations of Dst and Kp indices are shown in thrird and fourth panel. The last panle shows the variation of solar flux F10.7 for the same period.
The maximum enhancement (≈ 16%) in the TEC data have found on 9 April at our station. Now, we need to explain these enhancements in the light of earthquake and other factors such as magnetic storms and solar activity. For which, we plotted the Kp, Dst Index and solar index F10.7. The plots of magnetic storm parameters (Dst and Kp) are shown in third and fourth panels of Figure 2. The month of April is magnetically quiet except one isolated storm on 24 April but we have not found the effect of this storm. The last of panel of this figure shows the plot of solar flux F10.7. The solar flux variations are almost quiet during this period of consideration.
We can conclude here that the enhancements in the TEC data only due to earthquake. In order to provide the confirmation of the precursory signature of this major earthquake (M=7.8), we have plotted the diurnal variations of GIM-TEC data over the epicenter of earthquake for the month of April, 2013 in Figure 3. A solid blue line indicated the position of the occurrence of earthquake. The large enhancements in the GIM-TEC data have found on 8, 9 and 10 April, 5-7 days prior to the earthquake of magnitude M=7.8 and the similar variations have also been observed at Agra station. The enhancements have also be seen on other days after earthquake. Here, we are interested only in precursors.

Figure 3: shows the diurnal variations of GIM-TEC data over the epicenter of this earthquake.
Now, question is that how these enhancements have occurred in the TEC data at low latitude so we need to explain the exact reason which cause the anomalous variation in data using the mechanisms as suggested by earlier workers [15-16]. There are several mechanisms suggested by the researchers but still there is no single mechanism which is accepted by the scientific community. One of the more convincing concept is that the lithosphere-ionosphere coupling which is still in dark but the possible explanations have been presented by many workers in terms of E × B drift mechanism where the electric field (E) triggered by an earthquake preparatory process penetrates the ionosphere and, in the presence of local magnetic field (B), causes upward or downward movement of the ionization depending upon the direction of the electric field [17]. At last, the question remains about the mechanism of the electric field generation from the earthquake region. Ref. [16] suggested that radon emissions arise from earthquake epicentral region, the lower Earth-ionosphere ionized over the seismic zone and hence the modification in ionosphere takes place since then ion concentration becomes very high such high level of ion concentration lead to explosive nucleation process and the ion clusters with size of several microns are formed [18]. The diffusion of radon from the Earth crust into atmosphere is not its own and it is due to common gas migration process [19] where, the carbon dioxide and methane play role of main carriers of radon so the concentration of greenhouse gases is enhanced over the earthquake preparation zone which play two important role such as creation of instabilities which are responsible to stimulate acoustic gravity waves generation on the other hand, air motion destroys the ion clusters due to this near Earthatmosphere layer becomes rich in ions within a short duration. Hence the charge separation process then leads to generation of anomalously strong vertical electric field of the order of ≈ KVm-1 with the fair weather electric field (≈ 100 Vm-1). Pulinet et al. [20] provides the explanation of the existence of a vertical atmospheric electric field and coupling between the ground and ionosphere using the concept of Global Electric Circuit (GEC). In brief, Global Electric Circuit (GEC) is system of quasi-stationary electric current between ground and ionosphere driven by global thunderstorm activity and works in transmitting the information from ground surface up to the ionosphere through the changing of its electric properties due to natural ionization and ion induced nucleation changing the conductivity of atmosphere.
In this paper, we have seen the diurnal variations of GPS-TEC data observed at Agra station, India and also the diurnal variations of GIM-TEC data over the epicenter of this major earthquake (M=7.8) at Pakistan-Iran border region for the month of April, 2013. The precursors have found on 5-7 days prior to the occurrence of earthquake using the 3σ. We have also seen the effect of solar activity and geomagnetic storm and found neither anomaly associated with solar activity nor to geomagnetic storm. The possible mechanisms for cause of anomalous variations have also been explained.
The authors are thankful to Department of Science and Technology and Ministry of Earth Sciences, Government of India, New Delhi for their financial support.