Journal of Oceanography and Marine Research
Open Access
ISSN: 2572-3103
ISSN: 2572-3103
Research Article - (2013) Volume 1, Issue 1
Strong organic ligand in oceanic Particulate Matter (PM), as determined from amount of thorium adsorption onto PM in 0.1 M HCl, was measured for surface waters of mid-latitude region (ca. 32.5°S) in the South Pacific Ocean. The Particulate Organic Ligand (POL) concentrations in surface waters of the South Pacific, ranging from 2.6 to 13.3 nM, showed a longitudinal variation with low concentrations in the South Pacific subtropical gyre (180°-100°W) and high in the eastern South Pacific. The POL concentrations in the South Pacific surface waters increased with increasing nutrients (nitrate and phosphate) and chlorophyll concentration, which means that POL in surface waters is closely related to biological activity in the ocean; the high POL occurs in highly productivity region, whereas the low POL appears in the oligotrophic ocean. This is a first basin-scale measurement of POL in surface waters of the South Pacific. POL is a useful tool for better understanding of biological activity, particle dynamics and trace metal cycling in surface layer, if we have more detail knowledge on chemical and biogeochemical properties of POL, as do factors controlling spatial and temporal variability.
<Keywords: Strong organic ligand, Particulate matter, South Pacific, Chlorophyll, Phosphate, Nitrate
Particulate Matter (PM), which consists of suspended and sinking particles, is one of the most important constituents in seawater because it is related to carbon export flux and cycling of trace elements in the ocean [1-5]. PM in the open ocean comprises a complex mixture of living and dead cells, excretory products, detrital matter and amorphous aggregates. To better understand production and fate of PM, and its biogeochemical roles such as trace metal-particle interactions, characterization of PM from different geochemical aspects is important; ex. chlorophyll a has been globally measured as an indicator of phytoplankton biomass (or living PM). Ligands in PM are important components in PM because ligands play a role as interface to trace metal-particle interaction.
We have proposed that the concentration of Particulate Organic Ligand (POL), which is a peculiar functional group as a complexant defined by measuring the amount of thorium adsorbed onto PM in a 0.1 M solution of HCl [6], is an important factor for characterizing PM because the POL concentration is closely related to concentrations of particulate trace metals such as Fe, Cu, U, Th and Pu bound to PM [7-11]. POL found in the Pacific Ocean has been chemically characterized as a kind of chelator containing carboxylic acids like as aminopolycarboxylic acids, which form stable complexes with Fe, Cu, Th and Pu [12,13]. POL, therefore, is a candidate of source of the dissolved organic ligand regarding Fe complexation in the ocean because Fe-binding ligands dissolved in seawater are released from bacterial degradation of sinking particles [14]. Knowledge of the spatial distributions of POL would be useful for development of ocean Fe biogeochemistry including biogeochemical modeling [15-21]. Furthermore, POL is a marker of biogenic Particulate Organic Matter (POM), because the organic ligand specified in PM has been detected in microorganisms such as bacteria, phytoplankton and zooplankton [12,13]. Measurements of the POL are easily acquired by filtration of small volumes of seawater, making these measurements advantageous from an experimental viewpoint [6].
The mid-latitude region in the South Pacific is characterized as three sea areas from oceanographic conditions [22-24]: the western South Pacific (WSP; Tasman Sea; 154.5°E-180°), corresponding to the East Australian Current (EAC) system; the South Pacific Subtropical Gyre (SPSG; 180°-100°W) and the Eastern South Pacific (ESP; 100°W-72.5°W). WSP is characterized as the presence of meso-scale eddies formed from EAC [25]; warm eddies, containing poor nutrients, are oligotrophic, whereas cold eddies contain nutrient-rich waters [26]. SPSG appears to be the most oligotrophic and stable body [27]. Especially, hyperoligotrophic conditions were observed at the center of the gyre, with the clearest natural waters ever described [28]. ESP, including Chilean coastal upwelling, is recognized as highly biological productivity region [29]. In 2003-2004, the Japan Agency for Marine- Earth Science and Technology (JAMSTEC) conducted the Blue Earth Global Expedition (BEAGLE2003), a 7-month expedition that spanned the South Pacific (winter), Atlantic (late spring) and Indian (summer) Oceans [30]. This cruise provided a rare opportunity to collect numerous suspended matter samples in the South Pacific water columns, as well as a valuable hydrographic and tracer data set for investigating the oceans’ response to climate change. In this cruise, a lot of suspended matter samples were obtained and the cross sections of POL in the twilight zone (100-1000m depth) of the Southern Hemisphere Oceans were acquired [23]; POL concentrations in the twilight zone decreased with increasing depth except the central Indian Ocean, which is controlled by sinking of particulate matter and bacterial decomposition of PM in deeper layer [12]. In contrast of POL in the twilight zone, there is no information on POL in surface waters of the South Pacific. Knowledge of the spatial distribution of POL in surface waters, including relationships between POL and biogeochemical factors such as nutrients, may also be useful for understanding the biogeochemical and ecological roles of POL in the South Pacific.
In this paper, we describe the spatial distribution of POL in surface waters of the South Pacific Oceans measured in terms of Th adsorption amount. In order to better understand the biogeochemical roles of POL in the South Pacific surface waters, we examine relationships between POL and some biogeochemical parameters (phosphate, nitrate and chlorophyll).
Sampling
Surface water samples were collected using a submergible pump on board the R/V Mirai during the JAMSTEC BEAGLE2003 expedition from 2003 to 2004. The cruise track is shown in figure 1. The water volumes collected in surface layer (about 10-m depth) in the South Pacific Oceans were 80 L. The spacing of sampling stations was about 2.5° of longitude. All water samples were filtered through a membrane filter (Millipore HA, 298 mm diameter, 0.45 μm pore size) immediately after sampling. We defined residues retained on a filter as Particulate Matter (PM) in this paper. All filter samples were stored frozen (-30°C) on board the ship and transferred to the laboratory, where they were again stored frozen (approximately -20 to -30°C) until used for analysis. A membrane filter with retained PM was divided quantitatively into subsamples for analysis of POL.
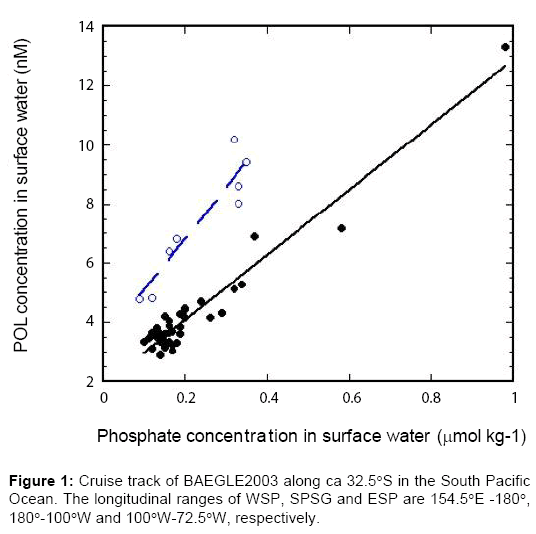
Figure 1: Representative photomicrograph of histopathological features in pulmonary necropsies.
Methods
To determine the concentration of POL, the adsorption of Th onto PM was examined at ambient temperature in a 0.1 M solution of HCl as described in detail elsewhere [6]. For this analysis, a portion of the frozen filtered sample corresponding to 1.5-5.25 L of seawater (25% of the total sample volume) was equilibrated in 20 mL of ~1 μM Th aqueous solution for 24 hours. The Th was then separated from the PM by filtration using a membrane filter with a pore size of 0.22 μm (Millipore HA, 25 mm diameter), and the residue on the filter was washed three times with 2-mL portions of 0.1 M HCl. The adsorbed Th was extracted into 8 M HNO3 on a hot plate and purified by anionexchange chromatography (anion exchange resin: Dowex 1x2) with a 9 M HCl eluent. The Th isotopes were electrodeposited on a silver disc (30-mm diameter), and Th was determined by α-spectrometry comprising silicone surface-barrier detectors and multi-channel pulse height analyzer.
A filter blank was determined to be 0.1 mBq 232Th (a 142-mm diameter membrane filter) after soaking the filter in 20 mL of a 232Th solution (1 Bq L-1; about 1μM) for 24 hours. The amount of Th in the filter blank accounted for <0.1% (for samples acquired from surface waters) of the total amount of Th measured in the seawater samples.
Previous experiments [6] have indicated that Th associates with a ligand in POM as a 1:1 (mole ratio) complex in 0.1 M HCl. Thus, the POL concentration, [POL], measured by Th concentration analysis can be defined by the following equations.
 (1)
(1)
In these equations, [ThLp], [Th4+] and [Lp] are the concentrations (M) of Th adsorbed onto PM, free Th ion and free POL in solution, respectively, and KThLp is the conditional stability constant for the binding of Th to the binding site on PM in 0.1 M HCl. We used a value of 106.6 M-1 for KThLp to calculate the concentration of POL, which was an average of the values determined for two different PM samples. Under the experimental conditions, the uncertainty of the KThLp value led to a systematic error of less than 10% for the POL. The POL concentration measurements were reproducible within ~5% for repeated analyses [6,23].
Geographical distribution of POL in the South Pacific surface waters
The POL concentrations in surface waters were determined at 48 stations along 32.5°S of latitude in the South Pacific Ocean. The results are summarized in table 1. The geographical distributions of the POL concentration in the South Pacific surface waters as does the POL in the 100m-depth layer are shown in figure 2. The POL concentrations in surface waters ranged from 2.6 to 13.3 nM. The geographical POL distribution showed that the highest POL concentrations were observed in the eastern South Pacific, whereas the lowest value was observed for samples obtained from the oligotrophic area in the South Pacific Subtropical Gyre. The previous studies [8,9,12] revealed that the POL concentrations in surface waters of the western North Pacific, subarctic Pacific and the Japan Sea were in the ranges of 1.08 to 9.47, 9.9 to 13.5, and 10 to 21 nM, respectively. These findings suggest that the POL concentrations in surface waters of the South Pacific were the same order of magnitude as that in the North Pacific, although the geographic variability of the POL concentrations in open ocean waters depended on oceanographic conditions including biological productivity. Although there is little information about concentrations of dissolved organic ligand (DOL) corresponding to the POL in the South Pacific, the POL concentrations in surface waters of the South Pacific mid-latitude region are comparable with that of the DOL (2.43- 2.96 nM), taken into account the previous results in the North Pacific and the Japan Sea [31]. This finding suggests that the POL plays an important role to trace metal cycling in the marine environment, as does the DOL.
| Latitude | Longitude | POL (nM) | 100 m POL (nM) | Nitrate (mmol kg-1) | Phosphate (µmol kg-1) | Chlorophyll (mg m-3) | ||
|---|---|---|---|---|---|---|---|---|
| -30.09 | 154.49 | 3.63 | ± | 0.19 | 2.9 ± 0.11 | 0.73 | 0.14 | 0.0944 |
| -30.08 | 156.52 | 3.36 | ± | 0.19 | 0.31 | 0.14 | 0.1244 | |
| -30.08 | 158.34 | 6.85 | ± | 0.24* | 2.2 ± 0.1 | 0.64 | 0.18 | 0.116 |
| -30.09 | 161.50 | 4.04 | ± | 0.20 | 0.3 | 0.16 | 0.112 | |
| -30.07 | 165.41 | 3.66 | ± | 0.20 | 2.6 ± 0.08 | 0.27 | 0.12 | 0.112 |
| -30.09 | 167.00 | 3.65 | ± | 0.20 | 0.98 | 0.16 | 0.0811 | |
| -30.08 | 169.50 | 4.45 | ± | 0.23 | 4.5 ± 0.16 | 1.21 | 0.2 | 0.0866 |
| -30.10 | 172.01 | 4.78 | ± | 0.22* | 3.1 ± 0.1 | 0.36 | 0.09 | 0.112 |
| -30.07 | 175.18 | 6.41 | ± | 0.29* | 0.7 | 0.16 | 0.0944 | |
| -32.51 | -179.92 | 3.61 | ± | 0.17 | 0.71 | 0.19 | 0.0692 | |
| -32.50 | -177.66 | 3.37 | ± | 0.19 | 5.36 ± 0.25 | 0.39 | 0.16 | 0.0582 |
| -32.51 | -174.00 | 4.20 | ± | 0.22 | 1.12 ± 0.12 | 0.4 | 0.15 | 0.0582 |
| -32.50 | -171.91 | 3.91 | ± | 0.20 | 0.35 | 0.16 | 0.0372 | |
| -32.51 | -169.50 | 3.84 | ± | 0.24 | 0.7 ± 0.1 | 0.3 | 0.19 | 0.0313 |
| -32.49 | -166.50 | 3.37 | ± | 0.20 | 0 | 0.1 | 0.0413 | |
| -32.50 | -163.17 | 3.16 | ± | 0.18 | 0.83 ±0.1 | 0.15 | 0.15 | 0.0385 |
| -32.50 | -161.15 | 3.46 | ± | 0.21 | 0 | 0.11 | 0.0245 | |
| -32.50 | -157.32 | 4.82 | ± | 0.25* | 0.56 ± 0.09 | 0 | 0.12 | 0.0292 |
| -32.49 | -154.00 | 3.68 | ± | 0.20 | 2.9 ± 0.11 | 0.73 | 0.14 | 0.0132 |
| -32.50 | -147.35 | 3.12 | ± | 0.19 | 0 | 0.12 | 0.0146 | |
| -32.51 | -144.00 | 2.88 | ± | 0.15 | 2.2 ± 0.19 | 0 | 0.14 | 0.018 |
| -32.50 | -141.49 | 2.58 | ± | 0.17 | 0.01 | 0.12 | 0.0282 | |
| -32.50 | -139.32 | 2.93 | ± | 0.16 | 2.1 ± 0.1 | 0 | 0.14 | 0.0302 |
| -32.49 | -135.33 | 3.52 | ± | 0.18 | 2.2 ± 0.13 | 0.07 | 0.13 | 0.0229 |
| -32.50 | -132.67 | 3.70 | ± | 0.21 | 0 | 0.17 | 0.0162 | |
| -32.49 | -130.00 | 3.67 | ± | 0.21 | 3.3 ± 0.18 | 0 | 0.16 | 0.0302 |
| -32.49 | -128.00 | 3.80 | ± | 0.20 | 0.04 | 0.13 | 0.0428 | |
| -32.51 | -124.67 | 3.37 | ± | 0.15 | 2.1 ± 0.13 | 0 | 0.15 | 0.0385 |
| -32.49 | -122.66 | 3.30 | ± | 0.18 | 0.06 | 0.18 | 0.0385 | |
| -32.49 | -117.32 | 3.61 | ± | 0.19 | 0.02 | 0.15 | 0.0582 | |
| -32.50 | -113.99 | 3.25 | ± | 0.16 | 3.1 ± 0.22 | 0.08 | 0.17 | 0.0193 |
| -32.50 | -112.00 | 3.04 | ± | 0.20 | 0.03 | 0.17 | 0.0193 | |
| -32.50 | -109.34 | 4.17 | ± | 0.21 | 0.34 | 0.2 | 0.0427 | |
| -32.50 | -106.02 | 4.47 | ± | 0.21 | 2.5 ± 0.19 | 0 | 0.2 | 0.0507 |
| -32.50 | -103.00 | 6.09 | ± | 0.28 | 0.43 | 0.24 | 0.0292 | |
| -32.51 | -101.32 | 4.69 | ± | 0.23 | 2.0 ± 0.17 | 0.16 | 0.19 | 0.0457 |
| -32.50 | -99.33 | 4.28 | ± | 0.22 | 1.91 ± 0.13 | 0.97 | 0.26 | 0.0442 |
| -32.51 | -95.33 | 4.17 | ± | 0.22 | 0 | 0.12 | 0.0146 | |
| -32.51 | -93.33 | 5.10 | ± | 0.25 | 1.31 | 0.29 | 0.0997 | |
| -32.51 | -90.67 | 5.12 | ± | 0.26 | 1.02 | 0.32 | 0.0667 | |
| -32.50 | -87.34 | 6.91 | ± | 0.27 | 2.3 ± 0.13 | 2.32 | 0.37 | 0.0944 |
| -32.50 | -85.34 | 5.29 | ± | 0.25 | 1.52 | 0.34 | 0.0822 | |
| -32.50 | -84.01 | 8.59 | ± | 0.26* | 0.67 | 0.33 | 0.112 | |
| -32.50 | -82.00 | 8.01 | ± | 0.30* | 2.49 ± 0.16 | 0.01 | 0.33 | 0.176 |
| -32.51 | -79.99 | 10.2 | ± | 0.35* | 0.13 | 0.32 | 0.194 | |
| -32.50 | -76.65 | 9.40 | ± | 0.31* | 2.36 ± 0.18 | 0.49 | 0.35 | 0.188 |
| -32.50 | -74.66 | 7.18 | ± | 0.28 | 2.39 | 0.58 | - | |
| -32.50 | -72.49 | 13.3 | ± | 0.38 | 5.12 ± 0.22 | 6.16 | 0.98 | - |
Table 1: The POL concentrations in the South Pacific Ocean surface waters.
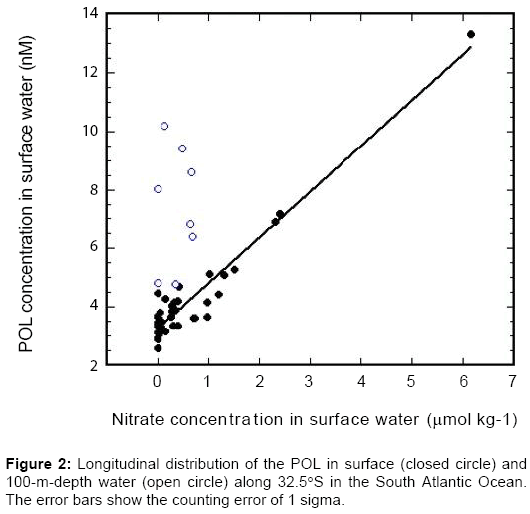
Figure 2: Representative photomicrograph of histopathological features in pulmonary necropsies.
The variability in the longitudinal distribution of the POL concentration in surface waters along 32.5°S of latitude seemed to depend on biogeochemical conditions characterizing each sea area. We therefore examined three sea areas (WSP, SPSG and ESP) of the South Pacific mid-latitude region as described previously [22-24]. In the WSP, the POL concentrations in surface waters ranged from 3.4 to 6.8 nM. The POL concentrations in the WSP surface waters increased from west to east, which corresponds to waters upstream and downstream of the EAC, respectively [32]. A peak of the POL concentrations occurred near the boundary between the WSP and the SPSG. The POL concentrations in the 100m-depth layer of the WSP were comparable with POL in surface waters. The POL concentrations in the SPSG surface waters ranged from 2.6 to 6.1 nM, whose variability was lower than that in waters at 100m-depth; in the western region of the SPSG, which is a typical oligotrophic ocean, the POL concentration (less than 1 nM) in waters at 100m was markedly lower than that observed at surface water, whereas the 100m-depth POL concentrations in the eastern SPSG were comparable with POL in surface waters. In the ESP, the POL concentrations in surface waters, ranging from 4.2 to 13.3 nM, increased from west to east. The high POL in the ESP is comparable with that in the subarctic Pacific and the Japan Sea [9,12]. The POL concentrations in the ESP surface waters were higher than those in waters at 100 m in the ESP, which were similar to those obtained in the western SPSG with the exception of concentrations obtained in the most eastern station of the ESP.
Relationships between POL and nutrients
PM in oceanic waters is closely related to biological productivity because PM dominantly consists of living and non-living organisms including bacteria [5]. Biological productivity is governed by nutrients such as nitrate and phosphate. To understand the factors governing the geographical distribution of POL in surface waters, therefore, we examined the relationship between the nutrients (phosphate and nitrate) and the POL concentrations in surface waters, in which phosphate and nitrate concentrations in the BEAGLE2003 cruise as shown in table 1 were documented in the database [30]. The plots of the POL concentration to nitrate and phosphate concentrations in the South Pacific surface water are shown in figure 3 and 4. The plots of POL vs. nitrate divided into two groups (A and B); group A, which is a dominant group covered in the South Pacific mid-latitude region, showed a good positive correlation ([POL: nM] = 3.24 + 1.56 [NO3: μmol kg-1] with a correlation coefficient of 0.962), whereas some points, which are classified as group B, exhibited higher POL under the low nitrate concentrations. In the group B, biological activity supporting higher POL may occur although nitrate is scant in surface water. It is recognized that nitrogen fixation as such biological activity occurred in the Tasman Sea [33]. On the other hand, the POL concentrations for two groups well correlated with the phosphate concentrations in surface water; [POL: nM] = 1.86 + 11.0 [PO4: μmol kg-1] with a correlation coefficient of 0.967 for the group A, and [POL: nM] = 3.28 + 17.5 [PO4: μmol kg-1] with a correlation coefficient of 0.934 for the group B. It is noteworthy that most of the group B occurred in the WSP and ESP. These findings suggest that the high POL concentrations in surface waters appeared in lower nutrients concentrations in the WSP and ESP, whose causes, including nitrogen fixation, are further issues.
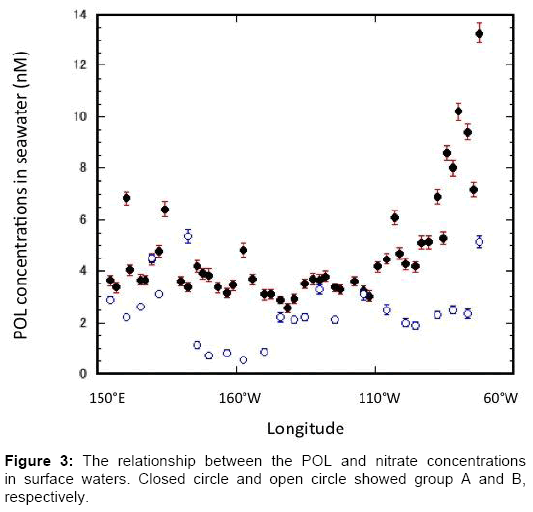
Figure 3: Representative photomicrograph of histopathological features in pulmonary necropsies.
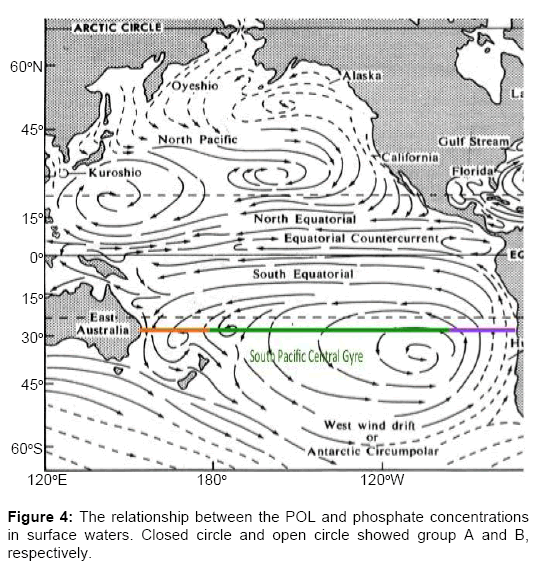
Figure 4: Representative photomicrograph of histopathological features in pulmonary necropsies.
Relationships between POL and chlorophyll
We examined the relationship between the POL and chlorophyll concentrations in the South Pacific surface waters, in which corresponding chlorophyll data were derived from standard SeaWiFS ocean color algorithms. The result is shown in figure 5. The POL concentrations in the SPSG and ESP surface waters well correlated with the corresponding chlorophyll concentrations; [POL: nM] = 2.40 + 36.9 [Chlorophyll: mg m-3] with a correlation factor of 0.919, whereas there is a poor correlation between POL and chlorophyll in the WSP surface waters. The result reveals that POL in surface waters is closely related to the living PM because the chlorophyll is a labile chemical marker of living PM [5]. In fact, the same organic ligand as specified in PM exists in microorganisms such as bacteria, phytoplankton and zooplankton [12,13]. The good correlation between the POL and remote-sensing chlorophyll concentrations in the SPSG and ESP suggests that the POL concentration in surface waters can be expressed by the simple function of the remote-sensing chlorophyll concentration, which is an important tool for biogeochemical modeling, although it is necessary to examine the relationship between the POL and remote-sensing chlorophyll concentrations in all of the oceans.
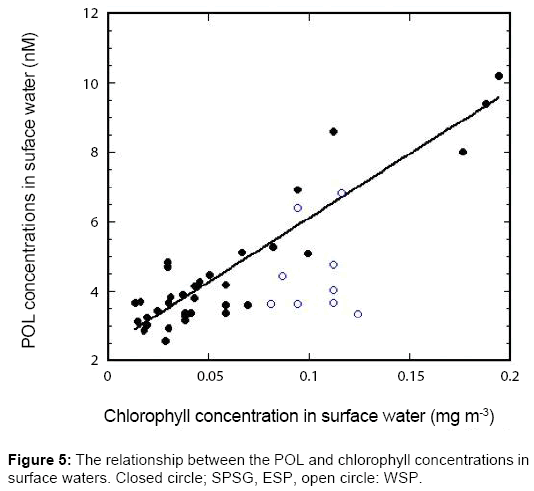
Figure 5: Representative photomicrograph of histopathological features in pulmonary necropsies.
The organic ligand concentrations in marine organisms depend on their size; smaller organisms such as bacteria enrich the organic ligand [13]. This finding suggests that the biological compositions in PM affect the POL-chlorophyll relationship. The result that the plots of the POL to chlorophyll in the WSP surface waters were lower than regression line implies that the biological composition of the surface PM in the WSP differed from that in the SPSG and ESP. In this connection, [34] revealed that abundance of Prochlorococcus, which is the smallest and most abundant phytoplankton in the global ocean and contributes substantially to the primary productivity of tropical and subtropical oceans, is low in the WSP and relatively high in the central part of the SPSG. The distribution of the 100-m depth POL in the SPSG was similar to that of picoplankton abundance such as Prochlorococcus, whereas these distributions in the WSP differed largely from that of Prochlorococcus abundance [23]. According to sediment trap results [35], dominant plankton in the WSP comprised large species such as diatom and coccolithophorids rather than Prochlorococcus. These findings suggest that larger species in the WSP may contribute to lower POL to chlorophyll ratio.
We have measured the Particulate Organic Ligand (POL) concentrations in the South Pacific surface waters and provided a first sight of the POL distribution in surface waters of the South Pacific midlatitude region. Our main conclusions are as follows:
1. The geographical distribution of POL in surface waters indicated that the concentrations of POL tends to be high in high-productivity areas and low in oligotrophic areas, and thus the POL concentration in surface waters positively correlates with phosphate and nitrate concentrations in the South Pacific mid-latitude region.
2. The POL concentration in surface waters of the SPSG and ESP showed a positive correlation with chlorophyll concentration, which is derived from standard SeaWiFS ocean color algorithms. The significant part of POL in surface waters is related to the living POM including phytoplankton, bacteria and others. However, there was poor correlation between the surface POM and chlorophyll concentration in the WSP. POL in surface waters is deduced from the remote-sensing chlorophyll in case when POL in surface waters is incorporated into biogeochemical modeling.
In the ocean, complicated physical and biogeochemical processes governing the distribution of POL occur, including temporal and spatial changes in biological activity on various scales. In this paper, we have shown that POL in surface waters is a good tool for elucidating the biogeochemical behavior of POM in the surface ocean. We believe that the POL is useful for modeling the biogeochemical processes involving carbon and bioactive trace metals in ocean surface because the POL is easily determined by a simple technique using small samples of water [6].
The authors thank the Captain and the crew of the R/V “Mirai” for their assistance during the BEAGLE2003 expedition. They are indebted to Masao Fukasawa, Takeshi Kawano, Shuuichi Watanabe and Koji Yoshikawa, all at JAMSTEC, for their help during the BEAGLE2003 expedition. Several cruise participants from Marine Works Japan Ltd. assisted with water sampling. The authors are also indebted to Akira Takeuchi for sample collection. The authors thank reviewers for constructive comments and suggestion. This research was partly supported by a Grand-in-Aid for Scientific Research from the Ministry of Education, Culture, Sport, Science and Technology of Japan (No. 18310017). The International Atomic Energy Agency is grateful to the Government of the Principality of Monaco for support provided to its Marine Environmental Laboratories.