Fisheries and Aquaculture Journal
Open Access
ISSN: 2150-3508
ISSN: 2150-3508
Research Article - (2015) Volume 6, Issue 3
The present preliminary study was undertaken from April to September 2013 in order to assess the limnological factors and phytoplankton communities in three dams, having depth of 6 m and area of 10 ± 2 Hectares, at Node Khanduz (Dam 1), Seyed Abad (Dam 2) and Marzban (Dam 3) in Azad Shahr, Gorgan, Iran. During the study period, a total number of 8 families and 28 genera were identified from all sampling sites. Of these 28 genera, 6 genera were belonging to family Bacillariophyceae, 5 genera were from Cyanophyceae, 2 genera from Charophycea, 2 genera from Chrysophyceae, 2 genera from Euglenophyceae, 8 genera from Chlorophyceae, 2 genera from Dinophyceae and 1 genus was belonging to Xanthophyceae. It was concluded that all the dams were having very well balanced phytoplankton communities yet changes in individuals’ composition and numbers were significantly varying among the three studied dams. Further studies focusing on other factors such as presence of heavy metals in the dams and of lengthy periods are recommended.
Keywords: Phytoplanktons; Food chain; Bio-indicator; Assemblage; Composition
Phytoplanktons are the primary producers forming the first trophic level in the food chain. It is the basic available food in water, for all consumers such as zooplankton and fish [1]. The life cycle of phytoplankton varies from a few hours to a few days; therefore they are very sensitive to environmental changes [2]. Diversity of planktonic organisms is quite high in fertile standing water bodies. Several phytoplankton species are also employed as bio-indicator for water’ specifications such as pollutant or contaminant [3-6].
Dams have been constructed all across the globe that provide water and fulfill other necessities of men [7]. These might be constructed for multiple purposes such as for transport, domestic or agricultural use, defense, ritual or industrial use, social aggrandizement, swimming, fish farming or the creation of the picturesque [8-10]. Dams are thought to have profound effects on the composition and abundance of both terrestrial and aquatic organisms such as phytoplankton assemblages are effected by low water exchange ratio, prevailing environmental conditions and dam operations [11,12]. Although several studies have been carried out on phytoplankton communities in dams, closed lakes or ponds around the world [1,7,13,14] but data on comparison of phytoplankton communities in similar habitat are scarce. It is assumed that same habitat should have similar phytoplankton communities [15]. Therefore this study was designed to evaluate the phytoplankton communities of three similar dams, situated in the same area in Gorgan, Iran.
Physico-chemical parameters of the selected three dams located at Node Khanduz (Dam 1), Seyed Abad (Dam 2) and Marzban (Dam 3) in Azad Shahr, Gorgan, Iran were studied. The dams were having a depth of 6 m and area of 10 ± 2 Ha. The factors were investigated using standard procedures.
Water samples were collected from selected dams for seven months from April to September 2013. Samples were collected periodically every month during morning hours between 9.00 and 11.00 A.M. or 6-8 P.M. according to circumstances by P.V.C tube with 1.5 m length and 6 cm diameter and 2 liters of surface water was collected for further analysis. The collected plankton samples were transferred to polyethylene bottles and preserved with 4% formalin. Quantitative analysis was performed by Sedgwick Rafter Counting Cells. Plankters were studied under microscope and identified with the help of standard references [16,17]. Surface water temperature was recorded on the spot using Centigrade thermometer. The pH of the water samples was measured by using gun pH meter on the spot and transparency were estimated by secchi disk. One-Way ANOVA and Spearman rank correlation were used to analyze data in SPSS 20 and Microsoft Excel 2010 software.
During the study period, a total of 8 families and 28 genera were identified, of which 6 genera were belonging to family Bacillariophyceae, 5 genera were from Cyanophyceae, 2 genera from Charophycea, 2 genera from Chrysophyceae, 2 genera from Euglenophyceae, 8 genera from Chlorophyceae, 2 genera from Dinophyceae and 1 genus was belonging to Xanthophyceae.
Maximum phytoplankton density in Dam 1, 2 and 3 was belonging to Chlorophyceae family. Bacillariophyceae and Cyanophyceae family were placed in the next level respectively (Figures 1-3). Although Xanthophyceae was not observed in April and August in dam 1 and 2 yet it was being observed in dam 3 continuously. The results revealed that dam 3 was having better phytoplankton communities. There was a significant difference (P<0.05) in plankton communities and most of the species were different in all dams, specifically in dam 3.
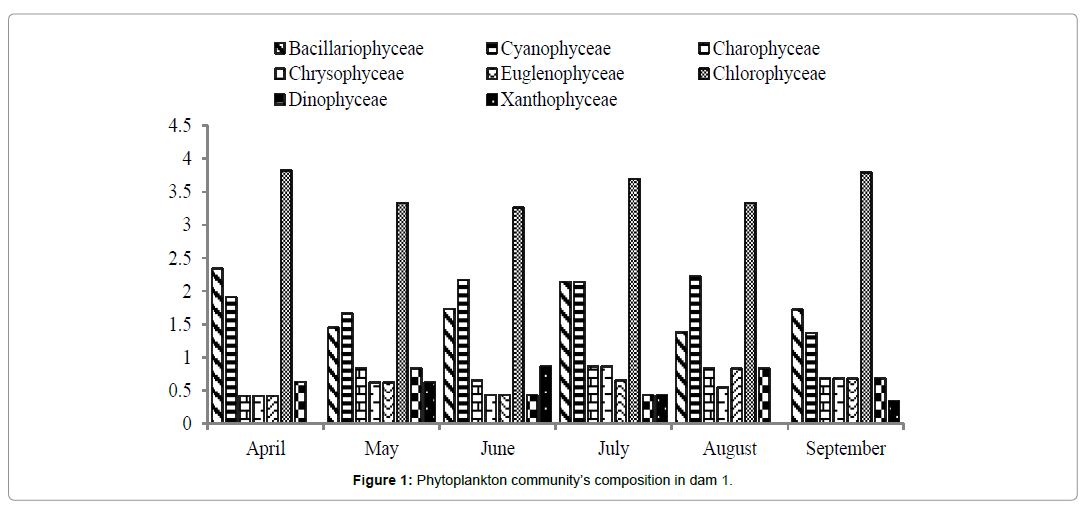
Figure 1: Phytoplankton community’s composition in dam 1.

Figure 2: Phytoplankton community’s composition in dam 2.
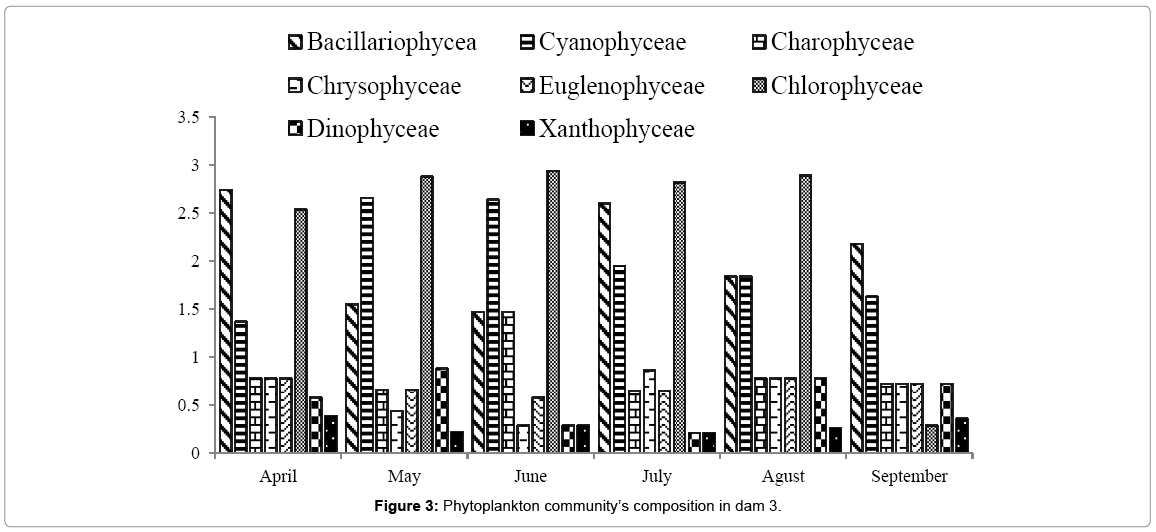
Figure 3: Phytoplankton community’s composition in dam 3.
Change in the phytoplankton communities in the dams may be attributed to the change in habitat across the tropic spectrum [18]. There are different co-variable factors with trophic state including physical environment, carbon problem, resources and energy, herbivory and factor interaction (such as local climate and, hence, latitude, altitude and relative exposure, water clarity and alkalinity). These changes lead to different composition of phytoplankton in different areas or aquatic bodies. These phytoplankton species are also different as they are having different level and limits of tolerance or adaptability to different prevailing conditions such as hazardous environmental setup. Changes in phytoplankton communities are also due to changes in concentration of phosphates and nitrogen as well as light and temperature [19]. Phytoplankton communities establishment is also dependent on the density, wind induced circulation of water and turbulence etc. of that specific dam or aquatic body [20].
Physicochemical factors are greatly influenced by phytoplankton population. In fact, cloudy weather, low transparency and heavy flood caused the decline of phytoplankton density and physico-chemical parameters [7]. The physicochemical parameters of the dams are shown in Table 1.
| Dam | Factors | April | May | June | July | Aug | Sep | Mean ± SD |
|---|---|---|---|---|---|---|---|---|
| Dam 1 | pH | 7.8 | 8.2 | 8.5 | 9 | 9.3 | 9.5 | 8.71 ± 0.6 |
| Transparency (cm) | 25 | 22 | 20 | 20 | 25 | 24 | 22.66 ± 2.13 | |
| Salinty (g L-1) | 0.18 | 0.1 | 0.25 | 0.28 | 0.3 | 0.35 | 0.24 ± 0.08 | |
| Surface Temperature °C | 26 | 29 | 33 | 30 | 34 | 32 | 30.66 ± 2.68 | |
| Dam 2 | pH | 8.2 | 8.5 | 8.9 | 9.1 | 9.5 | 9.4 | 8.93 ± 0.46 |
| Transparency (cm) | 22 | 25 | 29 | 22 | 20 | 24 | 23.66 ± 2.86 | |
| Salinty (g L-1) | 0.1 | 0.1 | 0.1 | 0.3 | 0.4 | 0.45 | 0.24 ± 0.14 | |
| Surface Temperature °C | 28 | 30 | 31 | 32 | 31 | 31 | 30.5 ± 1.25 | |
| Dam 3 | pH | 8.4 | 8.7 | 9 | 9.2 | 9.4 | 9.2 | 8.98 ± 0.33 |
| Transparency (cm) | 25 | 28 | 30 | 25 | 22 | 21 | 25.16 ± 3.13 | |
| Salinty (g L-1) | 0.3 | 0.1 | 0.5 | 0.45 | 0.7 | 0.75 | 0.46 ± 0.22 | |
| Surface Temperature °C | 27 | 29 | 31 | 33 | 32 | 30 | 30.33 ± 1.97 |
**Shows correlation at the 0.01 level; *shows correlation at the 0.05 level
Table 1: Physico–chemical parameters of 3 dams during April to September 2013 (Numbers are monthly average).
Planktonic communities can describe complex interactions and community structure in lakes habitat [21]. In fact, same habitats have similar species compositions. In this study, all the three dams were not having similar habitat’s conditions especially in transparency (Table 2). Results showed that only Euglenophyceae family was having significant correlation with salinity and pH. However, statistical analysis showed that three phytoplankton communities were significantly different in the dams studied.
| Factor | Bacillariophyceae | Cyanophyceae | Charophyceae | Chrysophyceae | Euglenophyceae | Chlorophyceae | Dinophyceae | Xanthophyceae |
|---|---|---|---|---|---|---|---|---|
| pH | -0.305 | -0.103 | 0.106 | 0.379 | 0.620** | 0.038 | 0.059 | -0.246 |
| Transparency (cm) | 0.028 | 0.280 | 0.154 | -0.255 | -0.053 | -0.326 | -0.017 | -0.090 |
| Salinty(g L-1) | 0.031 | -0.300 | 0.042 | 0.381 | 0.513* | -0.132 | -0.227 | -0.269 |
| Surface Temperature °C | -0.269 | 0.227 | 0.066 | 0.201 | 0.210 | -0.054 | -0.220 | -0.006 |
Table 2: Spearman rank correlation between physicochemical factors and phytoplankton communities.
This study concluded that all the three dams are having same phytoplankton communities on account of being in the same habitat but their compositions, numbers of individuals in each family and relative abundance are significantly different in all the dams. This shows that all the dams are having very well balanced communities of phytoplankton consisting of almost all species. Change in individuals’ composition and numbers were significantly varying among the three studied dams which may be due to the dynamic nature of these ecosystems [22]. In order to reduce impacts of pollutants, remedial steps ought to be taken.
It is concluded from the current study that similar habitat was not having similar phytoplankton communities. However, the current study is still scanty on account of its study period and sampling months. Further studies focusing on other aspects such as physico-chemical characterizations and toxicants’ presence in the very same habitats are recommended.