Fisheries and Aquaculture Journal
Open Access
ISSN: 2150-3508
ISSN: 2150-3508
Research Article - (2021)
A 6-weeks study was conducted in the domestic fish markets and at the River Nile landing sites of Juba city to determine the demand of fish products. A total of 45 fish traders and 3 focus groups (8 individuals per group) discussions were selected by means of sampling techniques. 6 other government officials from different levels of institutions and academia were interviewed using a well-structured questionnaire. Focus group discussions were provided with a well- structured guide together with the key informant interviews. Results of the study showed that, fish traders have got very low savings while running the fish businesses in Juba, Kator and Munuki Payams of Juba city. Respondents in the study area mentioned poor transport networks and marketing structures, multiple levies and taxes imposed on the fish traders, high transport cost, high rental fees for the business premises in the fish markets, limited and poor storage facilities and the lack of credits from the financial institutions to the fish traders’ associations and individuals were the major challenges confronting the domestic fish marketing in Juba city.
The experiences of the fish traders in fisheries business ranged from 2-5 years old and the motivations of the fish traders in joining fisheries business was the source of income generation activities and employment. Fish traders’ income generated from fisheries business not sufficient enough to cover their monthly expenses. Boats, small- sized trucks and motorbikes were the main transportation system for fish products from the production areas to Juba city. Fish traders used ice, sisal sacks, wooden boxes, woven baskets, plastic buckets on boats, defreezers, wooden tables, carpets and concrete slaps to handle their fish products during the transportation and selling processes at the fish markets. Marketing structures observed to be dominated by traditionally made systems causing high fish spoilage and loses. Majority of the fish traders were not members to any business associations or cooperatives. Few fish traders mostly women were members to Konyokonyo Women SACCO and the fish traders from Uganda were members in their country of origin. There is no fisheries policy framework to regulate domestic fish marketing in Juba city. Central Equatoria State Ministry of Animal Resources and Fisheries has a Fishery draft bill laying before Central Equatoria Revitalarised Legislative Assembly for readings and amendment. Long term planning by the government and partners for the development of fisheries sector with a focus on fish marketing structures and the landing sites to strengthened fish value chain in Juba city is required.
Fish traders; Producers; Transportation; Storage facilities; Marketing structures
A Fisheries contribute to meeting the sustainable development goals of many countries in the world through employment, provision of nutritious food, generation of revenues for local and national governments from licenses and taxations on landings, from export revenues and various upstream and downstream multipliers. Fish products are important proteins sources much needed by human beings for growth and health living. Aquaculture plays a vital role in the global food security and the national economies of the states involved.The purpose for the remarkable increase in the consumption of fish products is to meet the body’s nutritional requirements. However, the distribution and marketing of fish products depend largely on the marketing systems and transport structures [1-4].
In south sudan, domestic fish and fishery products marketing routes are closely tight between production areas (Sudd region and the Nile tributaries) to the urban centers of greater regions of Bahr Ghazal, Equatorial and Upper Nile. At present, about 45% of the total fish landings were estimated at 30-40,000 MTs per annumare marketed and consumed within the greater Upper Nile only, 35% within the greater Bahr Ghazal region and 20% within the greater Equatorial region. Due to the remoteness of production areas from the urban markets, fish prices go high depending on Species ranging from USD 0.8-2.2 per kg on account of higher transport costs and taxes [5-7].
Fresh fish are very expensive in the urban cities of South Sudan in contrast to beef, chicken and other animal protein. At least 400 million people from developing counties of Africa and Asia were able to take essential animal protein. The fish intermediaries sell or buy either fresh fish or processed fish from the fishermen and traded the product at the market. The connection between the fish producers and fish consumers is an important and indispensable function without it, the core objectives of fish productions can never be realized. The market plays a vital role for society in terms of income- generating activities for the groups or individual traders which involved assembling various started from production and processing and trading of the commodities to the consumers [8-11]. Cooperatives in the small- scale fisheries sector are a way of maximizing long- term community benefits to deal with the threats of fisheries mismanagement, livelihood insecurity and povertyharsh realities for many of the world’s small-scale fishers. Communities with successful community- based organizations are better off than those without. This research study was designed to examine the domestic fish marketing of Juba city, Central Equatorial state [12].
Domestic fish marketing in IGAD countries is dominated by freshwater species with a strong preference towards tilapia, catfish, Nile perch and also small pelagic freshwater fish species called mukene or omena, with exception of Djibouti and Somalia which have access and preference to marine fish species. Data extracted from the IGAD countries reports indicate that the market sizes for fish products are relatively small and the total fish supply (live weight) to IGAD countries was around 697,000 MT only. This was mainly supplied by local harvests with a total population of around 216 million. IGAD member countries have a great potential to become a huge market for fishery products, driven by increasing purchasing power, changing consumer’s lifestyle, health consciousness and increasing supplies from aquaculture [13].
Fish market structures in south Sudan
All markets in the RSS are traditional and have evolved in an unplanned manner. Markets do not receive utility services, fish sales operations; in particular, require access to clean water and waste disposal services. Although some infrastructure has been constructed in some sites comprised of concrete structures with concrete tables, for the most part, markets are comprised of make- shift wood shelters and tables put up on the bare ground. For instance, during the rainy seasons, the surrounding area becomes extremely muddy. The limited infrastructure witnessed in markets is partially the result of insecure property rights. The markets are often on land leased for short periods, limiting the incentives for vendors to invest in their businesses. In addition to a limited number of concrete structures, markets lack basic amenities ranging from appropriate undercover structures, electricity, sanitation and hygiene, appropriate storage facilities and ice availability and quality. As a result, vendors lose in terms of income and consumers lose in terms of receiving inferior product. Despite the taxes collected by various government institutions/ departments, fish vendors used to pool their resources to pay individuals to carry out required services. The high and multiple formal/informal taxes and levies imposed on fish products along the entire value chain disproportionately increases the price of fish, especially for the most vulnerable groups in society. This means that large sections of the South Sudanese population are deprived of access to high- quality protein such as fish which is too abundant in the RSS [7,12,14].
Problems statements
Fishermen and fish traders tend to be discouraged in the fisheries industry businesses due to the fact that the fishermen and fish traders encountered a lot of challenges along the fisheries value chain. The physical infrastructures such as roads are problematic for the fish traders to transport their fish products to the urban markets of Juba city in a shorter time due to its remoteness. Besides, fish intermediaries have suffered from the multiple taxes imposed on them along the roads and in the markets by the various governmental institutions/departments apart from the rental fees in the markets. The consequence of all these implications has resulted in a steady increase in the prices of fish products in Juba City. Fish are transported to the urban marketing are either by motorbike, fiberglass boats and pick- up Toyotas. Large motorboats are used for transportation between Bor and Juba, long transit times often between 10-21 days combined with ineffective onboard cold and hygienic storage facilities significantly reduce the quality of fish products. These boats are also subjected to multiple taxes along the way to fish markets in Juba. The transportation system of fish products from the production areas is not organized into a formal organization. Fish products are transported at ambient conditions on the backs of the motorbikes in either wooden boxes or sisal sacks which are open to the elements such as rains, heat and dusts. This contributes to the spoilage of such perishable stuffs, but the limited amount of time spent on the motorbikes during transportation reduces the amount of fish lost or spoilage. Fish marketing structures in Juba city are locally built of poles and roofed iron sheets shades having some raised stalls of 1-2 meters for selling the fish products. Fish markets in Juba are not meeting the fish marketing standards in the region. Fish are sold on the ground placed on the plastic sheets or else fresh fish are sold on the concrete slaps with iced/or defreeze. The sanitary conditions of the fish markets in Kator, Munuki and Northern Bari Payams are extremely poor. I n addition, fish marketing centers in Juba city lack the required materials for handling, preservation and storage of fish products [14,15].
Juba city
Juba City covers an area of about 32,175 square kilometers bounded in the South by Latitude 4 N, in the North by latitude 5.5 N, in the west by Longitude 29.5 E and in the East by Longitude 32.3 E. I t constitutes most of the CES area where the Nile basin starts and gently slopes down Northwards away from the Nile flows in Lake Victoria in Uganda. Juba city council administration covers Juba, Kator and Munuki Payams respectively. Meanwhile, Juba County is bordered by Trekked County to the North; Lainya County and Kajo- Keji Counties to the South. To the Southeast Juba is bordered by Eastern Equatoria State and the West is Western Equatoria state. The study was carried out in the five Payams of Juba, Kator, Munuki, Luri and Rajaf of Juba County. Juba County is one of the six counties of Central Equatoria state in South Sudan and is the largest county in Central Equatoria which consists of sixteen Payams. Juba is the state capital of Central Equatoria as well as the national capital city of the Republic of South Sudan. The population in Juba is projected to be 1,395,905 people residing in Juba (Figure 1) [16].
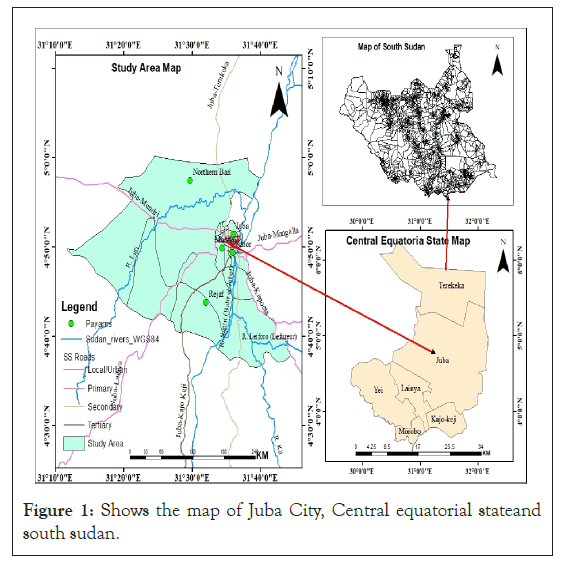
Figure 1: Shows the map of Juba City, Central equatorial stateand south sudan.
Data collection sources
Secondary data information were collected from the official sources of the governmental institution such as the National and the State Ministry of Animal Resources and Fisheries, University of Juba library, project reports from the Non- Governmental Organizations such as GIZ-IS, FAO, SNV, Compass, Camp-project-JI CA and UNIDO-I inception team report 2015. Web of science was used to source valuable information on the general condition of the domestic fish marketing in South Sudan shall be collect and analyzed. Participatory techniques were used to collect qualitative data; these techniques were useful for inductive research which captured specific information about the perspectives of local populations in Juba City fish markets. While collecting data in the field, different participatory techniques were used by the researcher to collect qualitative data, of which focus group discussions (FGD) with the local fish traders in the markets of Juba city was carried out. The questionnaires were designed to find information on the current domestic marketing of fish products in Juba City. Total samples of 51 (fish traders and key informants) respondents were selected for interviews in each market of Juba city and the various government institutions/ departments. In focus group discussions (FGD), at least three to eight members were selected in each market visited. The guidelines for the group discussions were focused mainly on the factors affecting domestic fish marketing, challenges facing the fish traders, government services to the fish traders, motivations seen in joining fish businesses and their future plans in the fish businesses. Face-to-face discussions were conducted in the preparatory stages of the study as a way of streamlining and identifying the key targeted fish traders with first- class information in the course of the market survey approach. The respondents were asked questions in groups and individuals comprising of fish retailers, vendors and wholesalers in the markets [17].
Data collection management
The field survey was carried out by interviewing a total of 45 fish traders were randomly selected from the 5 fish markets of Konyokonyo, Custom, Jebel, Suk Libya and Gudele 2 including two Landing sites of Konyokonyo and Lolo go respectively. In addition, six government officials were also selected for interview by reaching themat their various institutions/departments. However, it would be worth mentioning that the questionnaires went through several changes and formatting, the first set of questionnaires were used in the markets and the landing sites while the second set was used at the various government institutions/ departments to gather first- class information regarding the domestic fish marketing in Juba city. The observation method was also used in the field. Both English and local spoken Arabic languages were used for interviewing the respondents including Bari language in the locations reached.
Participant’s observations
Participant observations were considered in this research in order to provide direct access to the behaviors of the local fish traders during the interviews and a technique that served their interest was applied for easy collection of data. This involved watching, recording and taking on- spot photographs. In the observation process, some information was collected based on the fish market stalls, fish health and species, fish traders and their environment sanitation including the handling conditions at the markets. This has clearly indicated whether the participants feel isolated or no due to the government’s current marketing policies in Table 1 [18-24].
| Characteristics of fish traders | Kator (n=23) | Munuki (n=18) | Northern bari (n=4) |
| Sex | |||
| Male | 28.8 | 24.4 | 2.2 |
| Female | 22.1 | 15.6 | 6.7 |
| Age | |||
| 18-29 | 13.3 | 8.9 | 2.2 |
| 30-49 | 33.3 | 28.9 | 6.7 |
| 50-79 | 4.4 | 2.2 | - |
| Marital status | |||
| Single | 8.9 | 4.4 | - |
| Married | 35.5 | 33.4 | 8.9 |
| Divorced | 2.2 | - | - |
| Widowed | 4.4 | 2.2 | - |
| Education | |||
| None | 24.4 | 15.6 | 6.7 |
| Primary | 17.7 | 13.3 | 2.2 |
| Secondary | 6.7 | 8.9 | - |
| Tertiary | 2.2 | 2.2 | - |
| College | - | - | - |
| Originality | |||
| Fish traders from CES | 26.6 | 24.5 | 6.7 |
| Fish traders from other states | 13.3 | 2.2 | |
| Foreign fish traders | 11 | 13.3 | 2.2 |
| Residency | |||
| 1-3 years | 15.5 | 13.3 | - |
| 3-5 years | 8.9 | 6.7 | 2.2 |
| >5 years | 22.2 | 20 | 6.7 |
Table 1: This section describes the demographic characteristics of the fish traders such as sex, age, marital status, education level, originality and the duration of their residents in Juba city in form of percentages.
Characteristics of fish traders
The sexes of the respondents were divided into two such as male and female as indicated in Table 1 above. The finding of the research study alludes that the majority of fish traders in Juba fish markets were males 28.8% in Kator, 24.4% in Munuki and 2.2% in Northern Bari. However, female fish traders represent only 17.7% in Kator, 15.6% in Munuki and 6.7% in Northern Bari Payam respectively. The age of the fish traders was classified into three such as young age ranging from 18-29 years old, middle- age ranging from 30-49 years old and old age ranging from 50-79 years old. The results of this study show the majority of fish traders were found to be at the middle age of 33.3% in the Kator Payam fish market, 28.8% in Munuki Payam fish market and Northern Bari represent 6.7%. The marital status of the fish traders was categorized into: single, married, divorced and widowed. The findings of this study revealed that the majority of the fish traders were married 35.5% in Kator Payam Fish Markets, 33.3% in Munuki Payam Fish Markets and 8.9% in Northern Bari Payam Fish Markets. Moreover, the results allude that 4.4% of the fish trader were single in both Kator and Munuki Payam. In addition, 4.4% in Kator Payamand 2.2% of fish traders in Munuki Payamwere found to be widowed. However, 2.2% of the fish traders in Kator Payamwere divorced.
The education background of the fish traders was broadly categorized into: none educated primary, secondary and tertiary/ college level. The results of the research study show that the majority of the interviewees have never attended school 24.4% in Kator Payam fish markets, 15.5% in Munuki Payam fish markets and Northern Bari Payam fish market with 6.7%. Furthermore, the finding of the results shows that 13.3% of fish traders in Kator Payam, 13.3% in Munuki Payam and 2.2% in Northern Bari Payam have attended primary school education. At least 6.7% of the fish traders in Kator Payamand 8.9% in Munuki Payamhave attended secondary school. I t is interesting that 2.2% of fish traders in both Kator and Munuki Payam have attended tertiary school. The origins of the fish traders were grouped based on the duration of the residency in Juba. Findings of the study indicated that the majority of the fish traders 22.2% in Kator Payam Fish Markets, 24.4% in Munuki Payam Fish Markets and 6.7% in Northern Bari Payam Fish Market were originated from Central Equatoria state. Moreover, the findings of the research study revealed that 13.2% of the fish traders in Kator Payam and 2.2% in Munuki Payam were originated from other states of South Sudan. The research further alludes that foreign fish traders represent 11.0% in Kator Payam fish Markets, 13.3% in Munuki Payam fish markets and 6.7% in Northern Bari Payam fish market respectively. Hence, Ugandans’ fish traders dominate most of the fish markets in Juba followed by other foreign fish traders such as Bangladesh, Kenyans and Sudanese. Furthermore, 4.4% of the respondents interviewed in both Kator Payam fish market and Munuki Payam fish market were fish vendors working with some companies dealing in fish products businesses imported from China, Kenya, Norway, Thailand and Uganda into the RSS- Juba city. Whilst the duration of residency of the fish traders were assess during the research study. Findings of the study show that: the majority of the fish traders had resided for more than five years in Juba representing 22.2% in Kator Payam fish markets, 20.0% in Munuki Payamfish markets and 6.7% in Northern Bari Payamfish market.
Experience of the fish traders in fisheries business
The experiences of the fish traders were assessed during the study. Findings of the results indicated that, the majority of the fish traders were involved in the fishing business for the periods ranged between 2- 5 years old, Kator Payam Fish Markets represents 15.6%, Munuki Payam Fish Markets represent 22.2% while Northern Bari Payam Fish Market represent 4.4%. Moreover, it’s interesting that 11.1% in Kator Payam fish markets and 8.9% in Munuki Payam fish market had >15 years’ experience in the fish business industry (Figure 2).
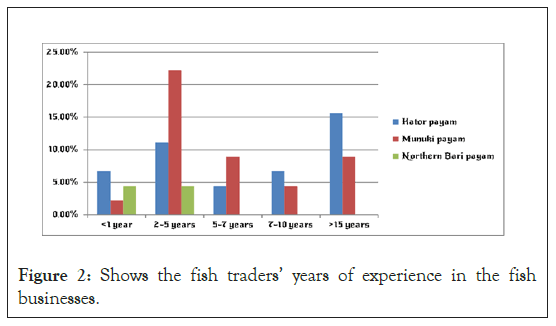
Figure 2: Shows the fish traders’ years of experience in the fish businesses.
Motivation of the fish traders towards fisheries related business
The fish traders were asked on what motivated them to join fisheries- related businesses. The majority of the interviewees revealed that they have ventured into fisheries- related business as a source of employment and income- generating activity representing 22.2% in Kator Payam Fish Markets, 24.4% in Munuki Payam Fish Markets and 8.9% in Northern Bari Payam Fish Market.13.3% in Kator Payam fish markets and 15.6% in Munuki Payam fish markets joined fish related business due to the market stability and high demand for fish products (Figure 3).
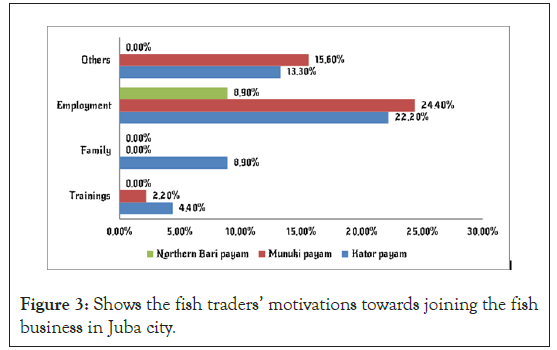
Figure 3: Shows the fish traders’ motivations towards joining the fish business in Juba city.
Fish trading business and the start-up capital of the traders
However, the fish traders’ start- up capital was categorized into personal savings and others. The results of the research study revealed that, majority of the fish traders interviewed revealed that, they used personal savings to start- up their fish businesses which represent 26.6% in Kator Payam fish markets, 22.2% in Munuki Payam fish markets and 8.9% in Northern Bari Payam fish market.17.8% in Kator Payam fish markets, 22.2% in Munuki Payam fish market and 2.2% in Northern Bari Payam fish market changed from their different former businesses into fisheries-related businesses (Figure 4).
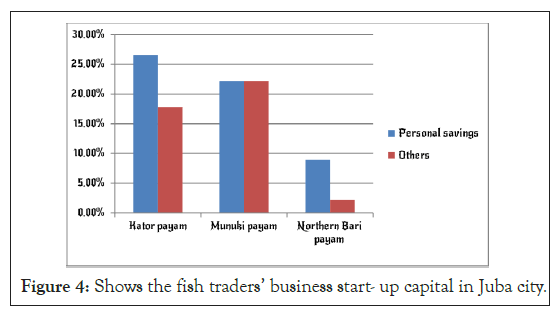
Figure 4: Shows the fish traders’ business start- up capital in Juba city.
Fish traders and expenditures of the household’s income
The results of the research study revealed that: the majority of the fish traders interviewed expressed that income generated from fisheries- related businesses is not sufficient enough to cover the households monthly expenses represents 37.8% in Kator Payam fish markets, 44.4% in Munuki Payam fish markets and 4.4% in Northern Bari Payam fish market.11.1% in Kator Payam fish markets and 2.2% in Munuki Payamfish markets emphasized that income generated from the fishing business is sufficient enough in covering the household’s monthly expenses (Figure 5).
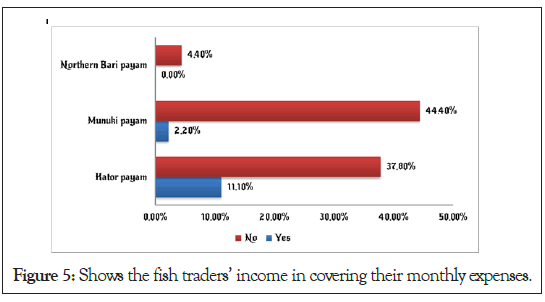
Figure 5: Shows the fish traders’ income in covering their monthly expenses.
The column graph below indicated that the majority of the fish traders interviewed coped up in their monthly expenditures by spending interest got daily and maintained the capital in running the fish businesses representing 35.6% in Kator Payam fish markets, 40.0% in Munuki Payam fish markets and 4.4% in Northern Bari Payam fish market. 2.2% in Kator Payam fish markets and 4.4% in Munuki Payam fish markets borrowed money from friends to maintain their fish businesses while income not enough in the markets of Juba city (Figure 6).
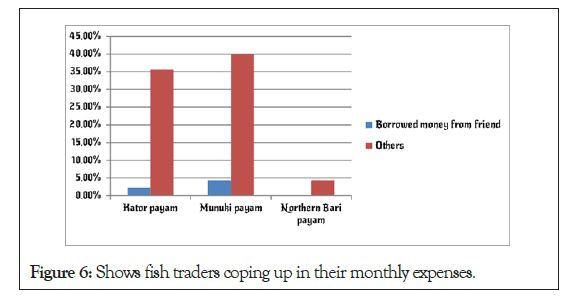
Figure 6: Shows fish traders coping up in their monthly expenses.
Fish distribution channels
The research study has investigated the production areas and how do the fish intermediaries distribute the fish products in the respective fish markets in Juba. Findings of the study show that, the higher number of fish traders interviewed obtained their fish products from Terekeka representing 15.6% in Kator Payam fish markets, 20.0% in Munuki Payam fish market and 2.2% in Northern Bari Payam fish market. Moreover, 13.3% in Kator Payam fish market and 15.6% in Munuki Payam fish markets obtained there fish products from Shambe, Goliar, Sudan safari, China, Kenya, Norway, Thailand and Uganda respectively (Figure 7).
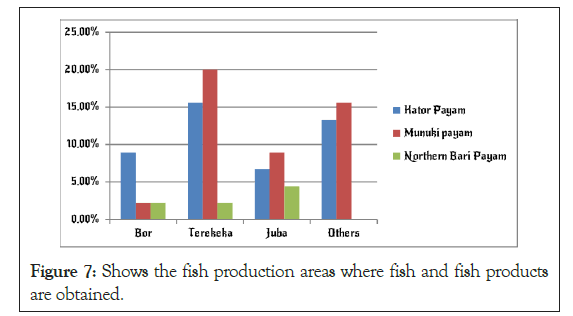
Figure 7: Shows the fish production areas where fish and fish products are obtained.
Fish transportation system
According to the research study carried out, the findings of the results revealed that: the majority of the fish traders interviewed were using boats and small- sized trucks to transport their fish products to Juba which represents 24.4% in Kator Payamfish markets, 20.0% in Munuki Payamfish markets and 6.7% in Northern Bari Payam fish market. 11.1% of respondents in Kator Payam fish markets and 17.8% in Munuki Payam fish markets used trucks only to transport their fish products to the urban markets of Juba. I nterestingly, 8.9% of the fish traders in Kator Payam fish markets, 6.7% in Munuki Payam fish markets and 2.2% in Northern Bari Payam fish market used motorbikes in transporting their fish products to Juba (Figure 8).
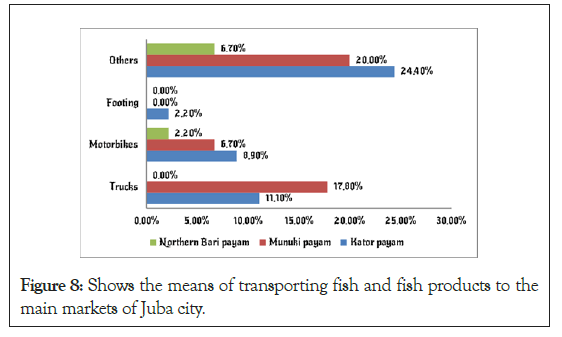
Figure 8: Shows the means of transporting fish and fish products to the main markets of Juba city.
Fish handlings, processing and preservation
Fish handling practices during transportation to the domestic markets of Juba were categorized into: ice, sisal sacks, carried on the head, wooden box with ice and others. According to the results of the research study, it revealed that: the majority of the fish traders interviewed were using iced plastic buckets on the boats, boxes and woven baskets to handling their fish products during transportation to the main markets of Juba having 28.9% in Kator Payamfish markets, 17.8% in Munuki Payamfish markets and 6.7% in Northern Bari Payam fish market.15.6% in Kator Payam fish markets, 6.7% in Munuki Payam fish markets and 2.2% in Northern Bari Payam fish market used ice to handle their fish products during transportation. Moreover, sisal sacks used in handling fish products during the transportation process to the urban markets of Juba represent 8.9% in Kator Payam fish markets and 6.7% in Munuki Payamfish markets (Figure 9).
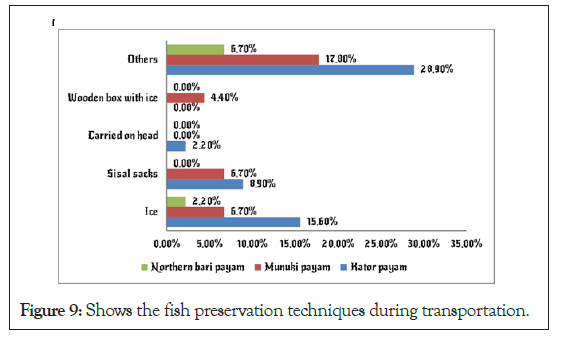
Figure 9: Shows the fish preservation techniques during transportation.
Frequency of fish supply to the urban fish market
The operations and frequency of fish supply to the markets were assessed during the research study. Findings of the research allude that, the majority of the fish traders interviewed used to supply fish products basing on the fish products demand, once a month, and twice a month which represents 31.1% in Kator Payam fish markets and 28.9% in Munuki Payam fish markets respectively. 8.9% in Kator Payam fish markets, 6.7% in Munuki Payam fish markets and also 6.7% in Northern Bari Payam fish market used to supply fish products every day to Juba city. I nterestingly, 6.7% in Kator Payam fish markets, 8.9% in Munuki Payam fish markets and 2.2% in Northern Bari Payam fish market used to supply fish products once a week to Juba city (Figure 10).
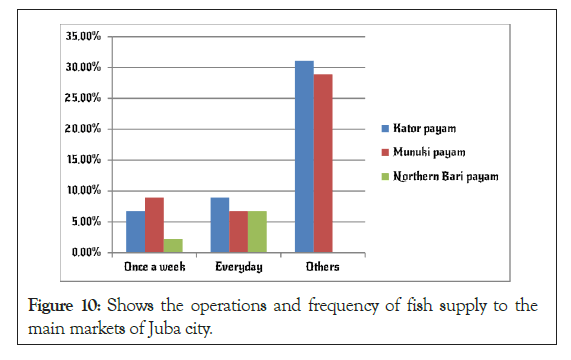
Figure 10: Shows the operations and frequency of fish supply to the main markets of Juba city.
Fish marketing and trading
Fish traders sold different categories of fish products in the urban market such as smoked fish, sun–dried and fresh fish products. Interviews with the beneficiaries’ reveal that the majority of the fish traders were found to be 31.1% in Kator Payam fish market, 22.2% in Munuki Payam fish markets and 6.7% in Northern Bari Payam fish market. While 22.2% in Kator Payam fish markets, 11.1% in Munuki Payam fish markets and 2.2% in Northern Bari Payam fish market were selling their fish products kept in defreezers. Moreover, 2.2% in Munuki- Libya fish market used the wooden box with ice and also 2.2% in Munuki-Libya fish market used to lay their fish products on the concrete slap in Munuki Payamfish market which was the only one seen throughout Juba city markets (Figure 11).
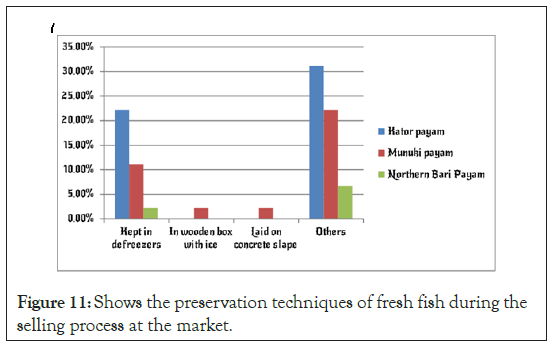
Figure 11: Shows the preservation techniques of fresh fish during the selling process at the market.
Taxes and levies in fish markets
The study alluded that, there were several actors such Criminal investigation department police, security police officer, Juba city council, Department of river transports, and the State Department of Fisheries Central Equatoria State charged fish traders to paid tax/levies in the market. The majority of the interviewee responded that they were paying multiple taxes to different governmental institutions/departments. 42.2% in Kator Payam fish markets, 46.6% in Munuki Payam fish markets and 8.9% in Northern Bari Payam fish market. It’s interesting that 2.2% of the respondents in Kator Payam- Lolo go landing site do not pay levies at all to the government institutions/ departments in Juba.
Services offered at the fish markets
Findings of the research study indicate that the majority of the interviewee 35.6% in Kator Payam and 37.8% in Munuki Payam expressed that responsible governmental institutions such as State Department of Fisheries and juba city council have not offered basic services in the fish markets such as garbage collections. Instead, international non- governmental organization such SNV- Netherland have offered basic training on fish handling to the beneficiaries in 2013 (Figure 12).
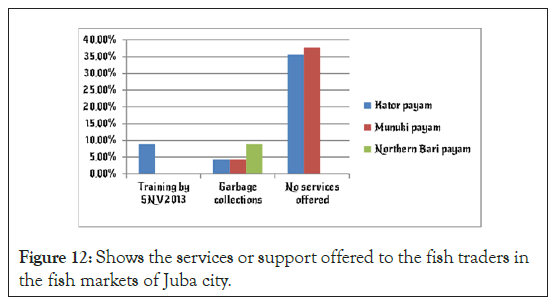
Figure 12: Shows the services or support offered to the fish traders in the fish markets of Juba city.
Fish trader’s organization
However, the bar graph provided below describes whether the fish traders’ have any membership to business cooperatives/ associations or not. The findings of the research study revealed that: the majority of the fish intermediaries interviewed were found not members of any business associations/ cooperatives which had 37.8% in Kator Payam fish markets, 35.6% in Munuki Payam fish markets and 8.9% in Northern Bari Payamfish market (Figure 13).
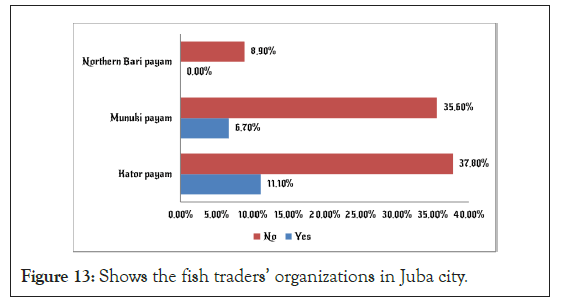
Figure 13: Shows the fish traders’ organizations in Juba city.
The major fish species sold at the market
Findings of the research study revealed that different types of fish species which include fresh, smoked, sun- dried and braided sun-dried fish were sold at the different levels of fish markets in Juba city (Figure 14).
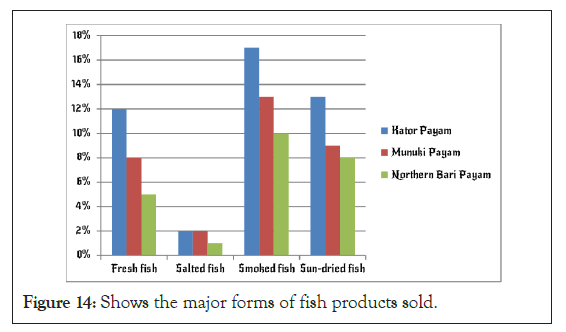
Figure 14: Shows the major forms of fish products sold.
It was observation that smoked fish represent 40% in all fish markets in juba, braided sun-dried fish represents 30%, fresh fish represent 25% and salted fish represent 05%.
The characteristics of the fish traders
It was observed female fish traders represent the highest group in fisheries businesses in Juba although the larger percentage of the respondents interviewed were male fish traders. The findings of this research contradicting the research study conducted by stated that the majority of fish traders are dominant men [1]. It is interesting that the age ranges between 30-49 years old dominated fisheries trading in the markets. The middle-class age stated the fisheries business is relatively stable and this has encouraged the majority of middle-age people. However, the younger age range between 18-29 years old represents the least percentage in fisheries business. This is because the perceptions of the younger generation were negative towards the fisheries business. Informal discussion with the interviewee asserted that the younger generation prefers to do other business rather than fisheries business. The age group of the fishers/fish traders constitutes the economically active population especially in developing countries. The diverse culture and traditions, the highest percentage of the respondents married at the early age ranges between the 14-18 years old. Interestingly the findings of this research study were similar to the research study conducted by, which revealed that most of the fish traders/fishers are married and had numerous dependents per fish trader, indicating a large family size to feed. I n the focus group discussion, the respondents allude that payment of dowry is very critical nowadays and this result to fish traders were single due to insufficient resources to pay the dowries for them to get married [1,20]. The respondents in the focus group discussion stated that the highest percentage of fish traders has not attended schools and this is due to the long civil war in the country. In addition, the respondents stated that limited number of schools in the country during the pre- independent period. The findings of this research study are similar to which stated that the literacy rate among fisher folks is low. It was noted that the majority of the fish traders originated from central equatorial state. The motive for involvement in the fisheries business is because of the high demand of fish products in the markets. However, the least proportions of fish traders were foreigners that have resided for more than 5 years were involved in fisheries in fish markets in Juba.
Experience of the fish traders
Regarding the experience of the fish traders in the study area, it was found that the majority of the fish traders in Kator Payam fish market, Munuki Payam fish market and Northern Bari Payam fish market have spent 2-5 years old in fisheries businesses. This finding indicates that fish traders in the study area have more experience in fish businesses. According to the interviewee, some of them have returned to the country particularly from Khartoum and neighboring countries after the independence of South Sudan in 2011. Fish traders revealed during the focus group discussions that, some of them who remained in the Juba throughout the 21 years of civil war has over 15 years of experiences in fisheries business as a result, some of them built semi- permanent houses in their plots and also pay their children’s tuition fees at the universities in Khartoum. Fish products demand is stable which has encouraged many fish traders in the business up to date according to the focus group discussions.
Motivation of the fish traders
Fish traders were mainly motivated in joining fisheries- related business because it’s their main source of employment and incomegenerating activity. Moreover, during the focus group discussions, fish traders revealed that income generated from fisheries business is sufficient enough to pay their children at schools, buy foods, medicines, cows, plots and other basic needs such as clothes for the households. Furthermore, a high percentage of fish traders allude that, they inherited fisheries-related business (professions) from their parents and guardians who were fish traders during their childhood and grew up while assisting their parents/ guardians. Moreover, other fish traders revealed that they ventured into the fisheries business due to the skills gained from the training offered by the international non-governmental organizations (INGOs) supporting fisheries sector development in South Sudan. Findings of this research study have contradicted research study conducted by who revealed that, although small- scale fish businesses supply most of the fish consumed in the developing world, many of them are extremely food- in secured and lack access to the resources and opportunities they need to lift themselves out of extreme poverty [5].
Fish trading business and start-up capital of the traders
Interestingly, the relatively high number of fish traders stated that the start- up capital was from personal savings. The author of this research study noted that a relative good number of the fish traders in the market were fishermen who mean to catch the fish and bring the catch to the market. However, relative a few fish traders stated that the start- up capital was obtained through selling the fish of the fellow colleagues in the market to raise some money for living. I n the focus group discussion, a few fish traders stated that before they could venture into fisheries-related business, they were involved in the selling of mixed goods such as selling of charcoal and meat. CAMP reported that financial institutions in most parts of the world generally avoid fisheries businesses due to a perceived high risk and knowledge insufficiency in the fisheries industry [7].
Fish traders and expenditure of household income
The fish traders in the research area of study express their views during the discussion that their household’s income from fisheries business is not sufficient enough to cover monthly expenses. The incomes generated fromthe fisheries business are used for paying their children’s school fees, rental fees, taxes and levies at the fish markets and to acquire their basic needs such as foods, medicines and clothes. Other fish traders expressed that, their incomes are used for buying domestic animals such as cows and goats after accumulating the good number of themcan be used for paying dowries. Based on the research discussions and observations taken at the fish markets, the current inflation rate in the country has affected fish traders as the majority of the ordinary people were not able to afford the prices of the fish especially fresh fish at the fish markets of Juba. This has negatively affected the household’s expenditures. However, a relative high percentage of fish traders in the research area of study asserted that the household’s income generated from the fishing businesses is sufficient enough to cover the household’s monthly expenses. Furthermore, the fish traders stated that the small margins of interest got from the fish businesses can afford their basic needs such as foods, school fees, medicines, rental fees and clothes while continuing their Fisheries businesses. The differences among the fish traders indicated that the little number of fish traders is knowledgeable about business spending but most of the fish traders are poor in managing their expenditures.
Fish distribution channels
Several fish distribution channels supplied Juba with various forms of fish products. In the focus group, discussion indicated a relative high percentage of fish products were channeled through Terekeka County. Smart-fish reported that there is an increase in fish production in locations such as Terekeka County due to the awareness- raising, technical supports by training the fishermen. The major fish production areas in South Sudan were identified in the needs and livelihoods report. The research found that foreign countries such as China, Norway, Thailand and Uganda are the main importers of fish products into South Sudan [10,16,21].
Fish transportation system
The network of the transportation system is not organized in Juba. For instance, the fish intermediaries were using several means of transport such as boats, motorbikes and small- sized trucks with insulated boxes to collect different forms of fish products from the fishing camps and transport the products to the urban fish markets. The fish traders usually carried ice logs from Juba to the landing site as well as in the fishing camps to collect fresh fish. CAMP reported that the transports of fish products were estimated at 2 tons per week and more than 100 tons per year. However, the transport of fish products was estimated at 25 tons per week during peak season. Traditional, fish transporters use wooden boxes, sisal sacks during the transportation of fish to the markets [7].
Fish handling, processing and preservation
It was observed that fish handling, processing and preservation in the markets were poor. For instance, the fresh fish products are commonly displayed on the one- meter stall or display on the plastic sheet on the ground with ice, which resulted to the spoilage of the fish. Furthermore, it was observed during the period of research that a relatively high percentage of the fish traders used to burn timber scene (bohur) under the stalls producing smoke that chases flies from landing on the fish products while fish products are either laid on the carpet stalls or wooden stalls. The author of this research noted that limited percentages of fish traders use ice while selling fresh fish products. The fresh fish products are kept in defreeze that us not connect with the electricity since there is the irregularity of power in Juba. However, the fish traders often use defreeze with ice to avoid the spoilage of the fresh fish products.
Frequency of fish supply
It is interesting that, the frequency of fish supply varies from one fish trader to another. However, during the focus group discussion relative high percentages of fish traders received fish supply from their customers/fish transporters at least once or twice a week depends on the demand of fresh fish in the market. However, a relative small percentage of fish traders mentioned that they buy fresh fish on daily basis from the fishermen and fish intermediaries.
Fish marketing and trading
The market has basic structure and lack necessary facilities such as a platform for selling, fish storage facilities, cleaning slabs, electricity and water drainage. The platform for selling fish was either made from bamboos, poles, timbers iron sheets and its height ranged between 1.5 m-2 m. It was noted that the fish traders display fish boxes and carpets during the processing of selling fish. The platforms where fish products are displayed were in poor sanitary conditions containing dust and littering of garbage’s. Informal discussion with the members of Konyokonyo Women SACCO mentioned that they used to clean faces left in their business premises every morning, and this is due to the absence of a fence in the market. The research study noted that, there is one concrete slab used for selling fish products at Suk Libya fish market. Very limited incentives were given by the investors in the private sector in areas dedicated to fish markets structures development [14].
Taxes and levies at the fish market
It was noted that no fish market policy document will guide the trading of fisheries products in the market. Based on the discussion with the fish traders reveals that multiple stakeholders were collecting different types of taxes and levies from the fish traders whether in the markets or along the roads when transporting fish to the urban Centre. Reported that the formal and informal multiple taxes and levies imposed on fish products along the entire value chain disproportionately increases the fish prices especially for the most vulnerable groups in society [14].
Services offered at the fish markets
It is interesting that the local government authority and the Juba City Council collect fees from the traders on daily basis. The fish traders argue that the pay multiple fees to different governmental institution but the responsible government authority without returning services such renovating the physical structure of the markets, installation of drainage for water, routing cleaning which will sustain the management of the fish markets. Report indicate that, the high taxes imposed on fish products sets a large section of the South Sudanese population were deprived of access to high- quality protein such as fish products. During the focus group discussions, the fish trader’s complaints of irregular garbage collections done by Juba city council authority which could be once or twice a month. Moreover, in Northern Bari Payam fish markets, garbage collections are done regularly on daily basis [12].
Fish trader’s organization
Lack of awareness and sensitization on the importance of associations and cooperatives remains the major obstacle. For instance, the ministry of cooperative and rural development would have fulfilled its mandate as to encourage the fish traders to form their groups. It was noted that, relatively small percentages of fish traders were members of business associations and cooperative societies. However, the highest percentages of fish traders were not knowledgeable regarding the formation of the fisheries associations and cooperatives. I n addition, the fish markets were allotted temporarily, this has discouraged the fish traders to organize themselves because they feel that the local government authority will demolish the allotted business land abruptly making the traders susceptible to business collapse. I t was noted that relative high number of fish traders have not space in the market making it difficult to form an association or cooperative because they feel the organization will not benefit them [14].
Konyokonyo women’s savings and cooperative society (KWSACCO) is the only fisheries established in 2013. Informal discussion with the members of KWSACCO reveals that KWSACCO is exploring possibilities of linkages with the financial institution to access credits to their members. ML and FI stated that both fishermen and fish traders in the country have no access to formal credits from the financial institution. The fishermen and fish traders obtained loans from the members of the family and saving or they have ton sold out assets for them have capital. Benansio argues that there is insufficient financial credit for the fish producers or farmers in South Sudan; as such it hinders the development and growth of fisheries in the country. The cooperative societies in the small- scale fisheries sector are a way of maximizing long- term community benefits to deal with the threats of fisheries mismanagement, livelihood insecurity and poverty. Communities with successful community- based organizations are better off than those without at all [21-24].
This study was the first to show fish processing and value chain analysis in Juba City of South Sudan. Results of the study revealed that, the majority of the fish intermediaries involved in fish businesses were the fish retailers and fishermen with fewer wholesalers’ from both South Sudan and Uganda nationals. Large fish products quantities were obtained from Terekeka and Juba Counties. Other areas of fish production in South Sudan were Bor, Shambe, Goliar and Upper Nile State. Fish imports are obtained from China, Kenya, Norway, Thailand and Uganda that dominate the fish business. The central equatorial state need to pass the Fishery bill into law and revitalizes the existing policies passed by the National government. Future studies into the fish marketing centers in Juba city can help the government and partners to regulate prices and development the facilities sustainably.
There is no conflict of interest; any individual or institution can use the information for their use of the publication.
Many thanks go to the supervisors and the co- authors at the Fisheries and Aquaculture Development Organization of South Sudan in Juba. Fisheries department of the College of Natural Resources and Environmental Studies of the University of Juba, Juba City and the Agricultural Research Council, Animal Production Campus, Aquaculture Unit, Irene, South Africa for their valuable contributions in reaching the final stage of this study.
Citation: Mamuru GLS, Luban DB, Emmanuel FM, Talamuk R, Bali JI, Benansio JS, et al. (2021) South Sudan Fish Processing and Value Chain Analysis of Juba City. Fish Aquac J. S2: 002.
Received: 13-May-2021 Accepted: 27-May-2021 Published: 03-Jun-2021 , DOI: 10.35248/2150-3508.21.s2.002
Copyright: © 2021 Mamuru GLS, et al. This is an open-access article distributed under the terms of the Creative Commons Attribution License, which permits unrestricted use, distribution, and reproduction in any medium, provided the original author and source are credited.