Journal of Sleep Disorders & Therapy
Open Access
ISSN: 2167-0277
ISSN: 2167-0277
Research Article - (2015) Volume 4, Issue 6
Background: It has been reported that a 10% increase in s body weight predicts a 6-fold increase in the odds of developing moderate to severe obstructive sleep apnea syndrome (OSAS). Blood levels of apoptosis inhibitor of macrophage (AIM), produced by macrophages, increase with obesity progression. We aimed to investigate the association between plasma AIM levels and OSAS severity. We hypothesized that plasma AIM levels are influenced by OSAS severity.
Methods: Plasma levels of AIM, monocyte chemotactic protein-1 (MCP-1), and ln high sensitivity-C-reactive protein were measured by ELISA in 97 male participants. Blood samples were obtained after overnight polysomnography (PSG) before and after nasal continuous positive airway pressure (nCPAP) treatment.
Results: In 97 OSAS patients, their plasma AIM levels were positively correlated with the apnea hypopnea index (AHI) (r=0.353, p=0.0003) and oxygen desaturation of >3% events per hour (r=0.302, p=0.0025). Plasma AIM levels were significantly higher in patients with moderate to severe OSAS (AHI 15; 1,144.3 ± 342.5 ng/mL, mean + SD) than in mild OSAS (5 AHI < 15; 895.5 ± 237.6 ng/mL) (p=0.0006). In 38 OSAS patients with AHI > 20, plasma AIM levels significantly decreased following nCPAP treatment (p<0.0001).
Conclusion: The present study is the first to show that patients with OSAS have elevated plasma AIM levels, and that these levels are influenced by AHI but not by weight.
Keywords: Plasma apoptosis inhibitor of macrophage; Apnea hypopnea index; Nasal continuous positive airway pressure
OSAS: Obstructive Sleep Apnea Syndrome; nCPAP: Nasal Continuous Positive Airway Pressure; BMI: Body Mass Index; ESS: Epworth Sleepiness Scale; EDS: Excessive Daytime Sleepiness; PSG: Polysomnography; AHI: Apnea Hypopnea Index; TST: total sleep time; SE: Sleep Efficiency; AIM: Apoptosis Inhibitor of Macrophage; NF-κB: Nuclear Factor-kappa B; MCP-1: Monocyte Chemotactic Protein-1; IL-6: Interleukin-6; hs-CRP: High Sensitivity-C-Reactive Protein.
Obstructive sleep apnea syndrome (OSAS) is a common disease with an estimated prevalence of 2% and 4% in middle-aged women and men, respectively [1]. The prevalence of sleep apnea syndrome in Japanese patients is estimated to be 3.3% in men and 0.5% in women [2]. It has been reported that a 10% increase in weight predicts a 6-fold increase in the chances of developing moderate-to-severe OSAS [3].
In OSAS, activation of nuclear factor-kappa B (NF-κB) [4] accelerates the production of tumor necrosis factor-alpha (TNF-α) [5,6], monocyte chemotactic protein-1 (MCP-1) [5], matrix metalloproteinase (MMP-9) [5,6] and interleukin-6 (IL-6) [6,7] in monocytes of OSAS patients. These cytokines induce an increase in C-reactive protein (CRP) levels [7,8]. Thus, cytokine dynamics in OSAS may suggest systemic inflammation.
Apoptosis inhibitor of macrophage (AIM) is produced by macrophages, and contains three scavenger receptor cysteine-rich domain superfamily domains [9].
AIM blood levels increase with obesity progression; AIM-dependent lipolysis has been found to induce obesity in mice fed a high-fat diet for 12 weeks [10].
AIM-dependent lipolysis subsequently stimulates cytokine production in adipocytes via the activation of the toll-like receptor 4, which is required for the recruitment of adipose tissue macrophages [10].
However, adequate reports on the association between OSAS and AIM have not yet been made.
The purpose of the present study was thus to investigate whether plasma AIM levels in peripheral blood are influenced by systemic inflammation with OSAS severity.
Participants
Participants with somnolence tendency in the daytime, snoring, and sleep apnea (n=97) were recruited from the outpatient clinic for the examination of sleep apnea between May 2011 and June 2013. Within the three-month period before diagnostic polysomnography (PSG), outpatients who were treated for diseases other than the sleep breathing disorder (n=25) were excluded from the study; this included coronary heart disease (n=6), chronic heart failure (n=3), arrhythmia (n=3), stroke (n=2), aortic dissection (n=1), pulmonary embolism (n=1), other surgery (n=4), and non OSAS patients (n=5). The apnea-hypopnea index (AHI) of 97 OSAS patients (AHI >5) was measured using full standard PSG for diagnosis (diagnostic PSG) (Figure 1).
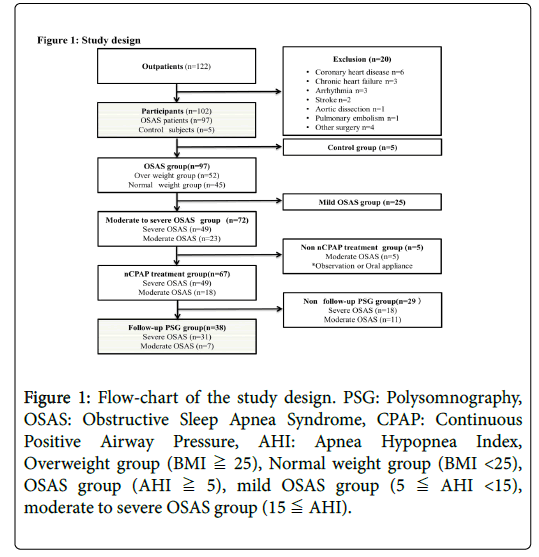
Figure 1: Flow-chart of the study design. PSG: Polysomnography, OSAS: Obstructive Sleep Apnea Syndrome, CPAP: Continuous Positive Airway Pressure, AHI: Apnea Hypopnea Index, Overweight group (BMI ≧ 25), Normal weight group (BMI <25), OSAS group (AHI ≧ 5), mild OSAS group (5 ≦ AHI <15), moderate to severe OSAS group (15 ≦ AHI).
OSAS patients were also classified according to disease severity; mild OSAS (n=25; 5
In addition, we considered the influence of body weight on each measurement item, in particular the influence on AIM. The World Health Organization [11] defines overweight as a body mass index (BMI) of 25 or more. Of the 97 OSAS patients, 52 were classified, as overweight (25 kg/m2 BMI) and 45 as having a normal weight (BMI <25 kg/m2).
Height and weight were measured at each hospitalization, diagnostic PSG, and follow-up PSG (Figure 1). BMI was calculated as weight in kilograms divided by the square of height in meters.
This study was approved by the Institutional Review Board of Iwate Medical University (H24-117), and all participants gave written consent.
Daytime sleepiness evaluation
At the first visit, the attending physician at the inpatient clinic of our hospital took a detailed disease history and conducted a physical examination of each subject. The ESS is a set of self-administered questions that aims to assess the degree of sleepiness during eight common situations, for which subjects are asked to rate their chances of dozing on a scale of 0 to 3. The total score can range from 0 to 24, with a lower score indicating less sleepiness. A Japanese version of the ESS (JESS) has been developed, and its reliability and validity have been confirmed [12].
Polysomnography test
PSG was conducted with a SomnoStar-α (SensorMedics, CA, USA). All sleep studies were carried out in an individual air-conditioned room of the Iwate Medical University Hospital. PSG began at 8 p.m. and ended at 6 a.m. the following morning, and, as far as was possible, was carried out under uniform conditions across participants and time points.
All sleep stages were scored by two well-experienced sleep technologists and further checked by a sleep specialist according to the EEG sleep staging criteria defined by Rechtschaffen and Kales [13]. We included patients with OSAS undergoing concurrent polygraphic cardiorespiratory monitoring that was evaluated. According to the criteria of the American Academy of Sleep Medicine [14].
An episode of apnea was defined as a drop in airflow by 90% of baseline for at least 10 sec. An episode of hypopnea was defined as a drop in oronasal pressure-signal excursions by 50% of baseline for 10 sec, associated with either arousal or an episode of 3% oxygen desaturation relative to pre-event baseline. AHI was defined as the average number of episodes of apnea and hypopnea per sleep hour. The arousal index was defined as the number of EEG arousals per sleep hour.
PSG at least 2 months (157.8 ± 74.6 days) after the start of nCPAP treatment was carried out under settings identical to those of pre-treatment PSG, except for the use of the nCPAP device.
nCPAP introduction and titration
The nCPAP treatment employed the REMstar Auto M series device (Philips Respironics, MA, USA), and was administered to patients with OSAS with an AHI of 20 events/h or more, in accordance with the criteria for coverage by the National Health Insurance System of Japan.
The auto-CPAP mode for the pressure setting was adopted during the first 2 weeks of treatment. A fixed pressure was determined as optimum pressure based on the 90% pressure from autotitration of PAP therapy. Treatment was continued under the fixed conditions for at least 2 months. The average optimum pressure was 8.6 ± 1.8 cm H2O and the estimated residual AHI (from machine memory) was 1.9 ± 1.2 events/h.
Blood sampling
Blood was sampled from the cubital vein with EDTA-treated and aprotinin-treated vacuum tubes at 6 a.m. one day after the first diagnostic sleep test and one day after the sleep test conducted after the start of treatment. Each blood sample was immediately subjected to separation of plasma (15 min, 1,000 rpm, 4°C) and was stored at -80°C.
Plasma levels of AIM, MCP-1, and hs-CRP were measured using the aprotinin-treated sample. All other markers were measured using EDTA-treated sample.
Measurement of plasma AIM and MCP-1 levels
Plasma levels of AIM (CycLex Co., Ltd. Nagano, Japan) and monocyte chemotactic protein-1 (MCP-1) (R&D Systems, Inc., Minneapolis, MN, USA) were measured with ELISA. AIM levels were measured using plasma that had been diluted at 1:50, and plasma MCP-1 levels were measured using plasma diluted at 1:2.
Measurement of plasma high sensitivity-C-reactive protein
Plasma high sensitivity-C-reactive protein (hs-CRP) levels were measured by radioimmunoassay in SRL, Inc. (Tokyo, Japan). hs-CRP values were logarithmically expressed as ln hs-CRP.
Statistical analysis
Statistical analysis was performed using StatView version 5.0 (SAS Institute Inc, Cary, NC, USA). AIM, MCP-1, ln hs-CRP, PSG parameter and anthoropometric data were analyzed using Pearson’s correlation coefficient, expressed as mean ± SD. Significant differences were analyzed by Fisher’s exact test, and a probability value of <0.05 was considered as statistically significant. Due to their right-skewed distribution, CRP levels were natural-log-transformed prior to analysis. To assess the relative strength of the association of AIM levels with possible contributing factors, we used a stepwise multiple regression analysis. Between-group differences were analyzed using Mann-Whitney U tests. The relationship between OSAS severity and overweight was analyzed using a two-way analysis of variance (ANOVA) with post hoc Bonferroni analysis. Within-group differences were analyzed using Wilcoxon signed-ranks tests.
Elevated plasma AIM, MCP-1, and hs-CRP levels in OSAS patients
In 97 OSAS patients, their plasma AIM levels were positively correlated with the apnea hypopnea index (AHI) (r=0.353, p=0.0003, Figure 2A) and oxygen desaturation of >3% events per hour (3%ODI) (r=0.302, p=0.0025, Figure 2B) (Table 1). AIM levels were also positively correlated with BMI (r=0.273, p=0.0067) in diagnostic PSG (Table 2).
| Parameter | Mean ±S.D. | AIM (ng/ml) | lnhs-CRP (lnng/ml) | MCP-1 (pg/ml) | |||
|---|---|---|---|---|---|---|---|
| 1084.0 ±329.9 | 2.66 ±0.53 | 157.3 ±57.9 | |||||
| r | p-value | R | p-value | r | p-value | ||
| TST(mins) | 415.7 ±90.3 | -0.146 | 0.1423 | -0.092 | 0.3598 | -0.17 | 0.0877 |
| S.E. (%) | 72.6 ±15.7 | -0.151 | 0.1307 | -0.088 | 0.3777 | -0.164 | 0.0999 |
| Stage N1 (%) | 25.7 ±12.1 | 0.011 | 0.912 | 0.183 | 0.066 | 0.323 | 0.0008 |
| Stage N2 (%) | 52.7 ±10.7 | -0.039 | 0.6965 | -0.123 | 0.2172 | -0.212 | 0.0324 |
| Stage N3 (%) | 5.5 ±5.5 | -0.044 | 0.6851 | -0.154 | 0.1225 | -0.116 | 0.245 |
| Stage REM (%) | 16.1 ±5.8 | 0.088 | 0.3788 | -0.011 | 0.9133 | -0.178 | 0.074 |
| AHI(events/hr) | 29.7 ±18.2 | 0.312 | 0.0013 | 0.295 | 0.0025 | 0.121 | 0.2253 |
| 3%ODI (events/hr) | 25.1 ±18.7 | 0.278 | 0.0044 | 0.306 | 0.0017 | 0.127 | 0.2053 |
| SpO2 mean (%) | 93.3 ±2.6 | -0.059 | 0.5572 | -0.286 | 0.0034 | -0.136 | 0.1743 |
| SpO2 mini (%) | 81.7 ±7.4 | -0.056 | 0.5781 | -0.314 | 0.0012 | 0.029 | 0.7723 |
| Arousal index (events/hr) | 37.7 ±29.3 | 0.012 | 0.9012 | -0.074 | 0.4601 | 0.0002 | 0.9985 |
| lnhs-CRP (lnng/ml) | 2.66 ±0.53 | 0.236 | 0.0166 | - | - | - | - |
| MCP-1 (pg/ml) | 157.3 ±57.9 | -0.038 | 0.7061 | 0.305 | 0.0017 | - | - |
Table 1: Correlations Among hs-CRP, MCP-1, Sleep Study Results, and AIM. Data are shown as mean ±SD; TST: Total Sleep Time; S.E: Sleep Efficiency; SpO2: Oxygen Saturation of Peripheral Artery; AHI: Apnea Hypopnea Index; 3% ODI: 3% Oxygen Desaturation Index; AIM: Apoptosis Inhibitor of Macrophage; MCP-1: Monocyte Chemoattractant Protein-1; ln hs-CRP: ln High-sensitivity C-Reactive Protein.
| Physical data | Correlations between physical data and AIM | ||
|---|---|---|---|
| Mean ± S.D. | r | p-value | |
| Age(y.o.) | 56.7 ± 16.7 | 0.055 | 0.5842 |
| ESS score | 6.9 ± 4.4 | -0.008 | 0.9339 |
| BMI(kg/cm2) | 25.4 ± 3.9 | 0.259 | 0.0083 |
Table 2: Correlations between Physical Data and AIM. Data are shown as mean ± SD, ESS: Epworth sleepiness scale, BMI: Body mass index, AIM: Apoptosis inhibitor of macrophage.
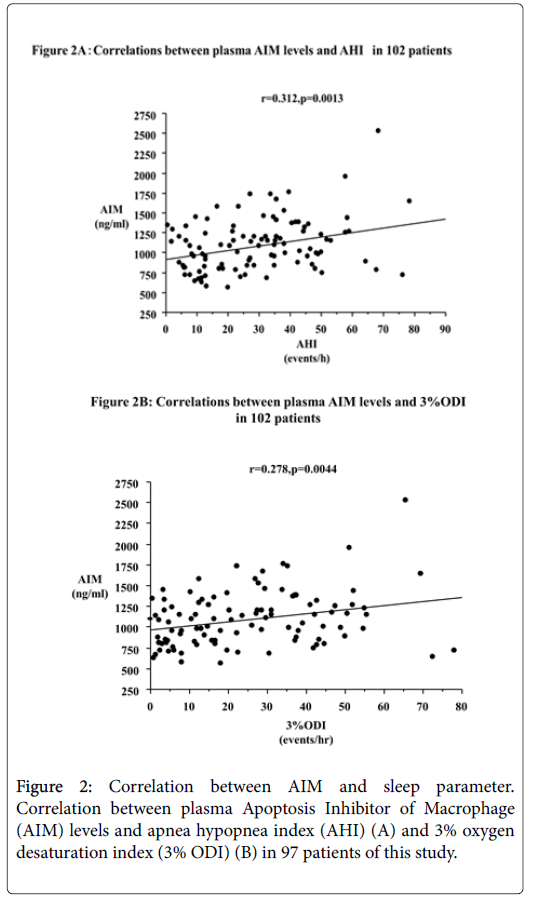
Figure 2: Correlation between AIM and sleep parameter. Correlation between plasma Apoptosis Inhibitor of Macrophage (AIM) levels and apnea hypopnea index (AHI) (A) and 3% oxygen desaturation index (3% ODI) (B) in 97 patients of this study.
In addition, AIM levels were positively correlated with BMI. BMI-adjusted AIM levels, obtained by dividing the AIM levels by BMI, were not correlated with AHI (r=0.154, p=0.132) and 3%ODI (r=0.039, p=0.7081).
MCP-1 levels were significantly and negatively correlated with Stage N2 (r=-0.203, p=0.0455). Moreover, there was a significant positive correlation between plasma MCP-1 levels and Stage N1 (r=0.318, p=0.0014) (Table 1).
ln hs-CRP levels were positively correlated with AHI (r=0.283, p=0.0048) and 3%ODI (r=0.293, p=0.0034), and negatively correlated with the mean oxygen saturation of peripheral artery (SpO2 mean; r=-0.285, p=0.0044) and SpO2 minimum (r=-0.305, p=0.0023) in diagnostic PSG.
Plasma AIM levels were independent of MCP-1 and hs-CRP levels
AIM levels were positively correlated with ln hs-CRP levels (r=0.256, p=0.0113) in diagnostic PSG. ln hs-CRP levels were positively correlated with MCP-1 levels (r=0.299, p=0.0028), but AIM levels were not correlated with MCP-1 levels (Table 1).
The predictive factor for plasma AIM levels
We selected age, BMI, AHI, 3% ODI, and ln hs-CRP, with which AIM levels were positively correlated, as independent variables. Stepwise multiple regression analysis revealed AHI to be the only predictors of increasing AIM levels.
Association between plasma AIM levels and OSAS severity
Moderate to severe OSAS than Mild OSAS (Table 3).
| OSAS Subject(n=97) | Moderate to severe OSASgroup(n=72) | Mild OSAS group(n=25) | P-value | |
|---|---|---|---|---|
| Physical data | ||||
| Age (y.o.) | 57.7 ±16.0 | 59.0 ±16.0 | 54.0 ±15.8 | 0.2282 |
| ESSscore | 6.9 ±4.4 | 7.5 ±4.6 | 5.2 ±3.0 | 0.0484 |
| BMI (kg/cm2) | 25.5 ±4.0 | 26.2 ±4.0 | 23.4 ±3.1 | 0.0017 |
| Sleep Study | ||||
| TST(mins) | 415.2 ±91.4 | 403.0 ±97.5 | 450.5 ±59.7 | 0.0351 |
| S.E. (%) | 72.5 ±15.9 | 70.2 ±17.0 | 79.0 ±9.9 | 0.0243 |
| Stage N1 (%) | 26.6 ±11.7 | 28.5 ±11.9 | 21.1 ±9.3 | 0.0033 |
| Stage N2 (%) | 52.3 ±10.6 | 50.6 ±10.2 | 57.1 ±10.3 | 0.0124 |
| Stage N3 (%) | 5.2 ±5.3 | 5.0 ±5.0 | 5.7 ±6.2 | 0.8752 |
| Stage REM (%) | 15.9 ±5.8 | 15.9 ±6.1 | 16.1 ±5.2 | 0.665 |
| AHI(events/hr) | 31.1 ±17.6 | 38.2 ±14.7 | 10.7 ±3.5 | <0.0001 |
| 3%ODI (events/hr) | 26.2 ±18.5 | 32.0 ±16.3 | 9.4 ±13.7 | <0.0001 |
| SpO2 mean (%) | 93.2 ±2.6 | 92.6 ±2.6 | 95.1 ±1.5 | <0.0001 |
| SpO2 mini (%) | 81.4 ±7.3 | 80.3 ±7.4 | 84.3 ±6.5 | 0.0076 |
| Arousal index (events/hr) | 38.9 ±29.4 | 43.5 ±32.7 | 25.9 ±8.1 | <0.0001 |
| labo data | ||||
| AIM (ng/ml) | 1080.2 ±335.9 | 1144.3 ±342.5 | 895.5 ±237.6 | 0.0006 |
| MCP-1 (pg/ml) | 157.8 ±57.7 | 162.7 ±63.6 | 143.9 ±32.8 | 0.3599 |
| lnhs-CRP (lnng/ml) | 2.67 ±0.53 | 2.75 ±0.52 | 2.44 ±0.51 | 0.0138 |
Table 3: Clinical Characteristics and Sleep Study Data from 72 Patients with Moderate-to-Severe Obstructive Sleep Apnea Syndrome (OSAS) and 25 Subjects with Mild OSAS. Data are shown as mean ± SD, ESS: Epworth sleepiness scale, BMI: Body mass index, TST: Total sleep time, S.E: Sleep efficiency, SpO2: Oxygen saturation of peripheral artery, AHI: Apnea hypopnea index, 3% ODI: 3% Oxygen desaturation index, AIM: Apoptosis inhibitor of macrophage, MCP-1: Monocyte chemoattractant protein-1, ln hs-CRP: ln High-sensitivity C-reactive protein
Weight and OSAS severity
We analyzed 97 OSAS patients (AHI > 5; Overweight group, n=52; Normal weight group, n=45) confirmed by diagnostic PSG. Levels of AIM (p=0.0059) and ln hs-CRP (p<0.0001) in the overweight group were significantly higher than the normal weight group. There were no group differences in MCP-1 levels (p=0.1804, (Table 4).
| OSAS group(n=97) | normal weight(n=45) | over weight(n=52) | p-value |
|---|---|---|---|
| AIM (ng/ml) | 969.9 ±236.4 | 1175.6 ±379.7 | 0.0039 |
| MCP-1 (pg/ml) | 151.7 ±59.8 | 163.1 ±55.8 | 0.2398 |
| lnhs-CRP(lnng/ml) | 2.45 ±0.51 | 2.86 ±0.48 | <0.0001 |
Table 4: Difference of AIM, hs-CRP, and MCP-1 concentration between overweight group and normal weight group in OSAS. AIM: Apoptosis Inhibitor of Macrophage, MCP-1: Monocyte Chemoattractant Protein-1, ln hs-CRP: ln high-sensitivity C-reactive protein, AHI: Apnea Hypopnea Index, Overweight group (BMI≧ 25), Normal weight group (BMI <25), OSAS group (AHI≧ 5), mild OSAS group (5 ≦ AHI <15), moderate to severe OSAS group (15 ≦ AHI)
Because AIM levels were higher in the Moderate to severe OSAS group, we then considered influence weight using a two-way ANOVA (OSAS severity × presence of overweight).
This revealed a significant main effect of OSAS severity on AIM levels (F=5.462, p=0.0216).
There was no significant interaction between OSAS severity and presence of overweight (F=0.259, p=0.6122). There was also a significant difference between Mild OSAS + normal weight group and other groups (Mild OSAS + over weight group, Moderate to severe OSAS + normal weight group, and Moderate to severe OSAS + over weight group (Figure 3).
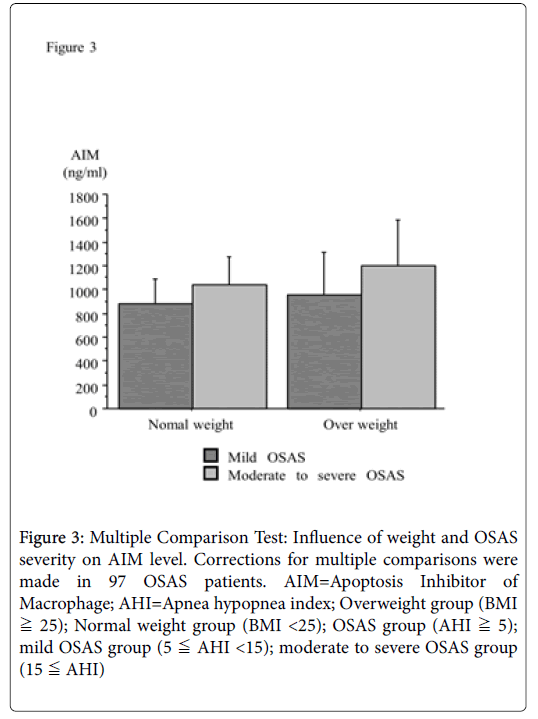
Figure 3: Multiple Comparison Test: Influence of weight and OSAS severity on AIM level. Corrections for multiple comparisons were made in 97 OSAS patients. AIM=Apoptosis Inhibitor of Macrophage; AHI=Apnea hypopnea index; Overweight group (BMI ≧ 25); Normal weight group (BMI <25); OSAS group (AHI ≧ 5); mild OSAS group (5 ≦ AHI <15); moderate to severe OSAS group (15 ≦ AHI)
Decreased plasma AIM levels after n-CPAP treatment
Thirty-eight OSAS patients with AHI > 20 underwent nCPAP treatment for least 2 months, which resulted in a significant decrease in ESS scores (p=0.0392), AIM levels (p<0.0001, Figure 4), and MCP-1 levels (p=0.0044), but a significant increase in BMI (p=0.0128) (Table 5).
| Before | After | p-value | |
|---|---|---|---|
| n=38 | n=38 | ||
| Physical data | |||
| ESSscore | 7.0 ±4.3 | 6.0 ±4.2 | 0.0392 |
| BMI (kg/cm2) | 25.9 ±3.7 | 26.2 ±3.8 | 0.0128 |
| Sleep Study | |||
| TST(mins) | 387.9 ±104.9 | 410.0 ±93.1 | 0.0831 |
| S.E. (%) | 67.2 ±17.9 | 71.9 ±16.2 | 0.0436 |
| Stage N1 (%) | 32.4 ±11.1 | 19.6 ±11.5 | <0.0001 |
| Stage N2 (%) | 47.7 ±10.0 | 54.4 ±8.7 | 0.0004 |
| Stage N3 (%) | 4.7 ±4.9 | 6.7 ±6.0 | 0.0954 |
| Stage REM (%) | 15.2 ±5.4 | 19.2 ±7.3 | 0.003 |
| AHI(events/hr) | 41.6 ±13.4 | 7.1 ±7.4 | <0.0001 |
| 3%ODI (events/hr) | 33.3 ±15.0 | 3.4 ±3.2 | <0.0001 |
| SpO2 mean (%) | 93.1 ±2.3 | 95.2 ±1.3 | <0.0001 |
| SpO2 mini (%) | 80.8 ±7.3 | 88.8 ±3.7 | <0.0001 |
| Arousal index (events/hr) | 45.7 ±15.4 | 23.5 ±19.7 | <0.0001 |
| Labodata | |||
| AIM (ng/ml) | 1210.2 ±288.2 | 999.0 ±242.1 | <0.0001 |
| MCP-1 (pg/ml) | 165.8 ±52.8 | 150.5 ±45.0 | 0.0044 |
| lnhs-CRP(lnng/ml) | 2.70 ±0.45 | 2.76 ±0.54 | 0.6478 |
Table 5: Clinical Characteristics and Sleep Study Data Before and After 2-Month nCPAP Treatment of 38 Patients with OSAS. Data are shown as mean ±SD, ESS: Epworth sleepiness scale, BMI: Body mass index, TST: Total sleep time, S.E.: Sleep efficiency, SpO2: Oxygen saturation of peripheral artery, AHI: Apnea hypopnea index, 3% ODI: 3% Oxygen desaturation index, AIM: Apoptosis inhibitor of macrophage, MCP-1: Monocyte chemoattractant protein-1, ln hs-CRP: ln High-sensitivity C-reactive protein
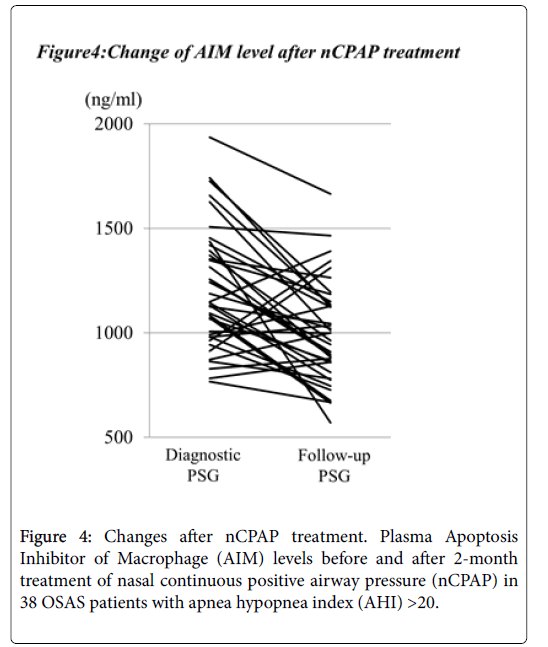
Figure 4: Changes after nCPAP treatment. Plasma Apoptosis Inhibitor of Macrophage (AIM) levels before and after 2-month treatment of nasal continuous positive airway pressure (nCPAP) in 38 OSAS patients with apnea hypopnea index (AHI) >20.
This study investigated the relationship between OSAS-related sleep parameters and AIM levels. Overall, we found that AIM levels were significantly correlated with AHI and 3%ODI in diagnostic PSG.
The regulation of AIM via the Liver X receptor / retinoid X receptor (LXR/RXR) suggests that after incorporation of oxidative LDL, which is LDL oxidized by free radicals of reactive oxygen species to yield oxysterols, the native ligands of LXR may also upregulate AIM expression in macrophages [15-17]. Liu et al. [18] reported that long-term intermittent hypoxia is associated with significant increases in malondialdehyde (MDA), a toxic product of lipid peroxidation that is used as a measure of free radical injury. In OSAS, intermittent hypoxia by apnea and hypopnea made lipid peroxidation may product oxysterol. Secondly, AIM expression in macrophages may be upregulated. Finally, AIM levels may increase.
Hartmann [19] reported that CRP is upregulated in response to hypoxic conditions at high altitude. Consistent with this finding, we found that ln hs-CRP levels were positively correlated with AHI and 3%ODI, and negatively correlated with SpO2 mean and SpO2 minimum in this study. This suggests that ln hs-CRP increased as result of repetitive disordered breathing caused by hypoxia. Sulciner et al. [20] suggest that rac1 regulates intracellular oxygen species (ROS) production, NF-κB activity is through the production of ROS. Furthermore, MCP-15 and CRP7,8 levels are increased with NF-κB activity. It is considered that both MCP-1 and CRP levels might increase through NF-κB activity, which is induced by free radicals that are produced by repetitive disordered breathing in OSAS.
Total sleep time (TST) and sleep efficiency (SE) were significantly different between patients with mild OSAS and moderate to severe OSAS. However, TST and SE exclusion criteria were not enforced as these factors did not interact with AHI.
Levels of CRP, IL-67, MCP-1, and adiponectin [21], which are the systemic inflammatory biomarkers of OSAS severity, were significantly higher in Moderate to severe OSAS than Mild OSAS. The current study reports differences in AIM and ln hs-CRP levels by OSAS severity.
Previous results have found that in vivo AIM expression is markedly increased with obesity progression in mice10. Similarly, AIM levels in our overweight group were significantly higher than that of the normal weight group in this study. The relationship between weight and AIM levels thus extends to humans. In addition, AIM levels were positively correlated with BMI. BMI-adjusted AIM levels, obtained by dividing the AIM levels by BMI, were not correlated with AHI and 3%ODI. However, when assessing whether overweight and OSAS severity influence AIM levels, it suggested that OSAS severity is independent of increasing AIM levels.
AIM levels significantly decreased after nCPAP treatment; this method may control rising AIM levels by decreasing lipid peroxidation in OSAS patients [22]. Treatment with nCPAP also significantly decreased ESS scores and Arousal index, but not ln hs-CRP levels. Sleep deprivation increases daytime IL-6, which is also elevated in patients with excessive daytime sleepiness (EDS) [23-25]. IL-6 might play a significant role in CRP synthesis [26]. CRP levels increased in OSAS patients in the process OSAS occur repetitive hypoxemia [19], and increasing CRP levels may be made increasing IL-6 levels. It is presumed that increasing IL-6 levels induced sleep deprivation and EDS.
It might suggest that nCPAP is able to ameliorate repetitive hypoxemia and to suppress IL-6 levels increased by OSAS. One way to suppress increasing IL-6 levels may be to decrease CRP. CRP is a nonspecific marker of inflammation, and an important risk factor in atherosclerosis and coronary artery disease [27,28]. It may be that while hs-CRP did not decrease after nCPAP treatment, factors other than OSAS may have been influenced.
This study demonstrated AIM level is influenced by AHI, but is not necessarily related to weight and BMI.
Firstly, it is assumed that oxidative LDL, oxysterol, and the LXR/RXR heterodimer influenced increasing AIM levels in OSAS patients, but other possible contributing factors have not been considered in this study. Future comparative examinations should thus be made with oxidative stress markers of thiobarbituric reactive substances, peroxides, and paraxonase-1. Secondly, we did not recruit a non-OSAS control group, which could be matched to the OSAS group for BMI. And one major shortcoming of the present study was the small number (n=38) of OSAS patients after n-CPAP treatment. It should be necessary to increase the number of female patients in future studies. Thirdly, OSAS is a disease with many coexisting symptoms that were not considered in the current study. Finally, blood was collected from subjects at 6:00 a.m. and circadian variation often exists in peptides. Comparative concentrations at different times of day are currently being collected in 10 participants of this study.