Fisheries and Aquaculture Journal
Open Access
ISSN: 2150-3508
ISSN: 2150-3508
Research Article - (2016) Volume 7, Issue 2
A fisheries management plan was required in Central Africa, which integrated a reduced regional hydrographical network and limited amounts of data in the overall regime. The current data and knowledge on fish populations and fisheries impacts are very poor in this region, particularly in Chad. Therefore, any new knowledge, especially on the structure of the ichthyological stands can be considered as valuable. Information on the status of Lake Iro fisheries resources was thus established by this study, which can serve as a model fisheries management regime in Central Africa. We performed assessment of fish resources in Lake Iro, Chad, achieved by a characterization of the exploited ichthyofauna, and the location of nursery and fishing areas. Results indicated that the overall size range of fish species showed negative effects of fishing pressure on size structure of the fish resources. Fishing has increasingly exerted pressure on fish species and affected the primary consumer species. We hypothesized at Lake Iro fish catches were below optimal fish production levels, essentially due to excessive localized fishing efforts, and selective fishing techniques by fisherman. Such reports call for the development of an integrated plan for sustainable management of Lake Iro fisheries resources. Sustainable and equitable exploitation of Lake Iro resources can be promoted by implementation of the following recommendation: a protected area at the lake inlet to limit excessive juvenile fish catches, which disturbs the aquatic food chain and prevents juvenile fish supply and growth in Lake Iro.
Keywords: Species-based indicator, Fish assemblage, Trophic level, Integrated 48 management, Lake Iro, Chad, Central Africa
Fish resources of aquatic ecosystems in Chad face several challenges, including a reduction in the hydrographical network, the unregulated fishing effort, the high fish juvenile predation, the imbalances in ichthyology fauna and the lake species composition [1]. The country has experienced recurring droughts during the four past decades that have altered the hydrographical network and silting of watercourses and inland lakes. An excess of 210,000 hectares of former spawning ground and juvenile growing areas have been lost to silting [1]. Anglers exerted excessive fishing pressure due to heavy localized fishing practices using small scale fishing gear, much of which is prohibited. The fishing materials, including bait, are not selective enough on a species basis, and anglers readily catch many different fish taxa [2]. Former studies reported predation pressures were essentially caused by ichtyophagous species, which have higher reproductive success rates and survival than forage fish, therefore, the predator and prey balance can be reestablished [3,4]. However, the imbalance of fish species composition can result from strong commercial fishing pressure of ichtyophagous species to the detriment of forage fish, which can alter the aquatic food chain [5]. Finally, during the dry season, the local community harvests fish by hand, which prevents new generations of fish to grow and reproduce, considerably reducing available resources [6].
Fisheries management use simple or complex models that require large amounts of data. The cost for data collection and analyses can be considerable [7]. Therefore, where costs are prohibitive, it is necessary to develop simple and efficient alternative methods to establish if there is a link between anthropogenic and environmental perturbations (including fishing pressure), and effects on fish communities [8,9]. The monetary incomes of the logistics cost for science in Central Africa are limited. In the current study, we present results from scientific fishing investigations performed at Lake Iro applying a simple quantitative method to characterize the primary fish species exploited by anglers in this ecosystem. This was achieved through an ad hoc data collection system, including scientific fishing operations (seine net fishing) and data derived from the current literature. The analysis is based on a comparison between samples collected at the mouth and on the border of the lake, by examining the abundance of species, the mean sizes or size distributions, as well as more global indicators such as the slope of the size spectrum, trophic levels, and diversity indices. Overall, our results provided the first information available for the development of integrated survey plans, which are indispensable tools for a sustainable management of fisheries resources in Chad; and equally important an understanding of ecological productivity in shallow tropical lakes of poorly studied areas [10].
Study area
Lake Iro is located in Chad northeast of Kyabe City (10°06’30’’N 19°25’19’’E) (Figure 1). Waters from the Bahr Salamat is one of the tributaries of the Chari River. The Bahr Salamat flows past Am-Timan City and contributes to an inland delta, which forms Lake Iro, before the tributary joins the Chari River. The length and width of the lake are 14 and 11 km, respectively, with an average 3 m depth. The lake area is estimated at 11,700 ha in dry and 20,500 ha in high water periods. Fisheries data on Lake Iro are sparse in the literature due to the low number of fisheries studies carried out on this type of ecosystem.
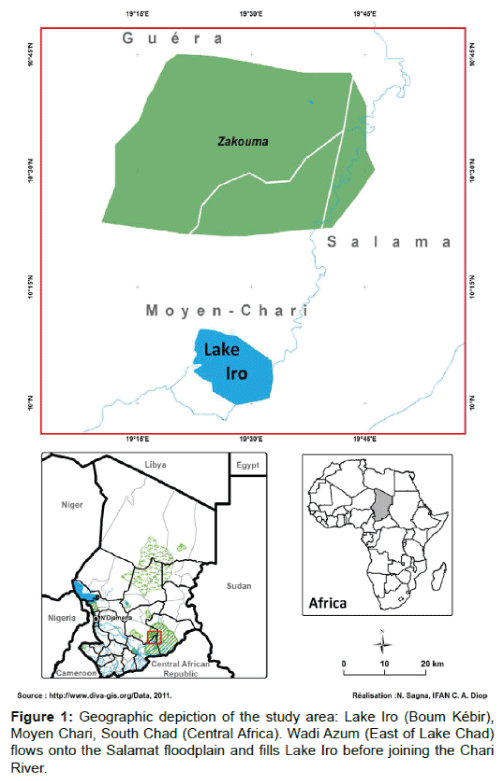
Figure 1: Geographic depiction of the study area: Lake Iro (Boum Kébir), Moyen Chari, South Chad (Central Africa). Wadi Azum (East of Lake Chad) flows onto the Salamat floodplain and fills Lake Iro before joining the Chari River.
In situ data collection
Data obtained during experimental fisheries surveys were collected at different points of Lake Iro, i.e., two fishing operations on the borders and one at the river inlet, over three days during one week of collection surveys. The objective of these scientific surveys was to analyse the ichthyofaunal lake dynamics. Thus, biological and ecological parameters, length and weight measurement of each species in the catch, and intra- and interspecific and predator-prey relationships were examined. Additional information on fish populations was obtained from literature reviews [11]. Bellemans method was used to identify species collected in fishing areas [12]. We also used trophic levels from the metabase fishbase to our landed species. When the trophic level for one species was unavailable, it was estimated using the value from Fishbase for the same genus of species concerning its diet [11]. After, we defined trophic categories referring to Lauzanne [13].
The sampling methods, techniques, protocols and the type of biological information used in this study are the same than those used to describe the fish assemblages in Sine Saloum [14-16]. They are also the same than those used to evaluate the evolution of the fish assemblages in the MPA since its closure to fishing in 2003 [17-19]. The data were collected in fishing surveys carried out during the main hydro-climatic season of the region in May 2011 (at end of the dry season). Fishes were captured during the day using a beach seine net with 95 m length, 4 m depth, and a 15 mm mesh size. The sampling protocol use a fishing haul unit. The net was operated from a canoe that samples the entire water column (via circles) to obtain a fishing effort unit well defined and repeatable. These sampling techniques were previously used with success in many West African estuarine and lagoon ecosystems [20]. The fishing operations were performed randomly without prior fish species targets, following standard protocols [21]. This fishing method allowed relative homogeneous, replicate and reproducible sampling. The application of this protocol enabled the comparison of results obtained in two types of the lake area: the borders and the river inlet.
Each fish sampling site was associated with a hydrological station where salinity, temperature and dissolved oxygen at the surface, the transparency, as well as the depth (m) were measured. Fish species were identified, counted and weighed (to the nearest gram) for each fishing haul. A sub-sample of fifty individuals per species and per fishing haul was measured (total length). The whole fish sample was individually weighed (total weight in g) and the fork length (FL in cm) measured. Fifty individuals of each surveyed species were dissected for macroscopic sex determination and stage of gonad sexual maturity, which was based on the following criteria: general ovary or testicle condition; oocyte visibility through the ovary membrane or testicle vasculature; and/or size and maturation level. The Albaret sexual maturity scale was applied to samples collected during the fishing survey for males and females [22].
Fisheries data analysis
A literature review on species at local and sub-regional levels, and at a global scale was first conducted. Thus, experimental fisheries data was mined. In this study, information on the biology, ecology and exploitation of fish species have been included. Simple descriptive analyses were performed to identify major trends in the life history traits and ecological affinities of the species were examined. The sexual maturity stages based on the same specific criteria to determine fish reproduction state were identified and applied to fish species collected from Lake Iro. The percentage of all fish species present in the borders and the lake mouth were used to evaluate species distribution in the ecosystem. Species distribution in the lake resulted in the potential to determine spatial variation. Fish life history traits were estimated from the literature and new data collected from Lake Iro, whereas each species diet was established using information collected from FAO, Fishbase databases, and literature reviews [14,22-29]. The percentage of mature females and males present in the lake was estimated to determine if Lake Iro can be considered as a fish spawning area at the time of the sampling season.
Diversity and evenness indices
The diversity indices N1 of Hill, an exponential function of Shannon-Weiner’s index H′, and N2, the reciprocal of Simpson’s index, were chosen for their complementarily [30]. They were calculated using the following formulae:
N1 = exp(−Σpiln( pi))
N2 =1 /Σpi2
Where “pi” is the proportion of species “i” in terms of abundance
The N1 index increases with the sampling effort, in contrast to the N2 index [31]. However, N2 is sensitive to changes in the abundance of the species present in few numbers, as each proportion is squared. In contrast, N1 is less sensitive because each proportion is weighed by its logarithm [31].
Species diversity is comprised of two components; namely, the number of species (S) in the sample, and the evenness (E) of their frequency distribution, which characterizes the shape of the distribution. E was calculated on the basis of the following formula:
E = ln(N1) / ln(S)
when all species are equally represented, E=1.
Size spectrum analysis
Fishing impacts on fish populations were assessed by analysing size structure according to the following variables: (1) overall size range; (2) average size per species; and (3) size range per ecologically distinctive area (the borders and the lake mouth). Fish size range is a relevant parameter to analyse size trends in fish communities of aquatic ecosystems affected by heavy exploitation, because the general size range profile observed in catches is altered in favour of smaller size species [32]. Size classes are defined, with each class represented by its mid-value. A linear regression of the logarithm of the number of individuals in each length class was calculated for the region of the spectrum where the number of individuals was decreasing. The slopes and intercepts were then compared using ANCOVA. Logarithmic transformation was used to normalise the length distribution and homogenise the variances [33].
Trophic level and spectra
The definition of trophic categories or classes leads to simplify the complex interaction of the trophic web of an ecosystem [13,34-36]. Hence, for all species, we used the same definition as of trophic categories from various data sources [26]. After compiling the literature dealing with similar ecosystems, we can assume that the trophic regimes do not differ much from what we found in the Lake Iro. The following data were included in our analyses: Lauzanne from Lake Chad, Olojo from Osun River, Nigeria, Kantoussan from Manantali and Salingue Lakes in Mali [13,37-39]. In addition to his information, we also used trophic levels derived from the metabase Fishbase to our landed species [40]. When the trophic level for given species was unavailable, it was estimated using the value from Fishbase for the same genus or species.
For the trophic spectrum study, the trophic levels of species are pooled into one-unit trophic classes, each class being presented by its mean value. Then, the mean trophic levels (TLm) of species are balanced according to the following formula:
where Yi is the yield for the species i; TLi mean trophic level of species i and S the total number of species [41].
The trophic structures of fish catches of different sites are analysed according to the respective contributions of the different trophic levels and classes to the total yield (kg ha-1). Yield per surface area is indicative of the quantity of resources fished along a spatial scale without any information on fishing effort. Distributions as a percentage of total fish counts were analysed along the trophic spectra to minimize bias or differences in capture probability related to differences in fishing effort at Lake Iro. The definition of trophic category was used to simplify trophic web complexity of the ecosystem.
Fish species composition
Hill’s and Simpson’s diversity indices estimated in this study were equal to 7.9. The species richness of Lake Iro was estimated at 23. However, the presence of a large number of juveniles was observed. More than 40% of the catches of each fishing operation were juveniles, including Alestes baremoze, Schilbe mystus, and Citharinus citharus. This juvenile biomass constituted the primary prey for predatory fish species, including Clarias gariepinus and Oreochromis niloticus. The most abundant catch species of medium and large size were O. niloticus, Bagrus bajad, Bagrus docmak, and Lates niloticus.
Results suggested that O. niloticus, B. bajad and B. docmak are successfully reproducing in the Lake Iro. O. niloticus exhbited three fish in pre-spawning and one fish laying eggs; and fish in the prespawning stage were identified for the two species of Bragrus. These species showed high abundance and sexually active individuals. For other species, individuals were predominantly immature or in sexual rest (45% of all fish sampled).
Indicators based on fish size spectra
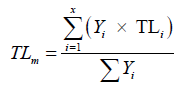
The main species targeted by fishermen fish are the larger species, i.e., B. docmak, B. bajad, O. niloticus, Heterobranchus bidorsalis and Gymnarchus niloticus. A total of 344 specimens were captured during daytime fishing. These individuals were subsequently measured. Global size spectrum analysis observed for Lake Iro showed the modal class was 225 mm. The average total catch size was 219.7 mm. Depending on species, the size range was less broad overall. However, the proportion of individuals with size exceeding 500 mm was 1.8% (Figure 2). The linear regression of the logarithm of the total number of specimen measured against length at the upper end of the distribution exhibited a slope of 0.013 and y-intercept of 7.5 (Linear regression, R2=0.99).
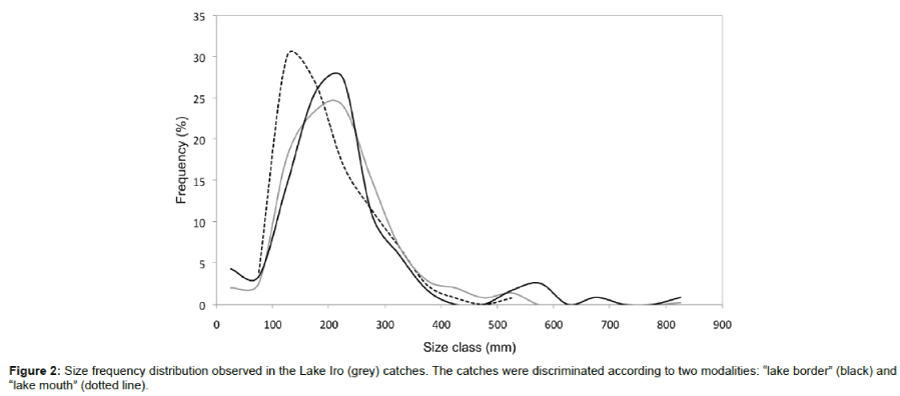
Figure 2: Size frequency distribution observed in the Lake Iro (grey) catches. The catches were discriminated according to two modalities: “lake border” (black) and “lake mouth” (dotted line).
The average size of each species at the different sites visited is shown in Figure 3. The size of fish samples from all the Lake ranged from 10 to 800 mm (Table 1). The proportion of individuals with size exceeding 500 mm (the largest individuals) was 1.8%. In addition, the average size of species caught at the lake mouth was less than or equal to that of species captured at the lake borders (Figure 3).
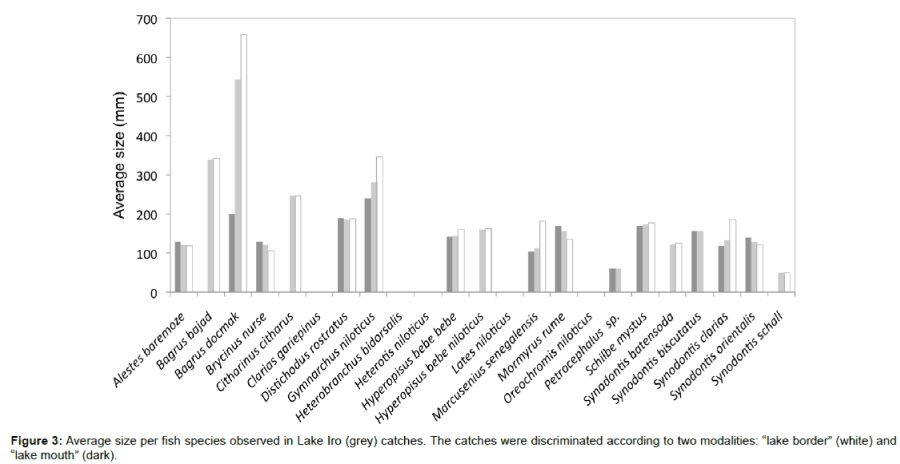
Figure 3: Average size per fish species observed in Lake Iro (grey) catches. The catches were discriminated according to two modalities: “lake border” (white) and “lake mouth” (dark).
| Species | LF/LT | N | Lmin | Lmed | Lmax | Standard deviation |
|---|---|---|---|---|---|---|
| Alestes baremoze | LF | 13 | 14 | 121.1 | 178 | 49.7 |
| Bagrus bajad | LF | 22 | 220 | 339.9 | 670 | 115.5 |
| Bagrus docmak | LF | 4 | 200 | 543.0 | 800 | 257.1 |
| Brycinus nurse | LF | 10 | 101 | 121.6 | 170 | 20.2 |
| Citharinus citharus | LF | 5 | 200 | 246.0 | 270 | 28.8 |
| Clarias gariepinus | LT | 47 | 170 | 266.4 | 519 | 66.3 |
| Distichodus rostratus | LF | 6 | 167 | 186.7 | 218 | 18.9 |
| Gymnarchus niloticus | LF | 5 | 190 | 281.2 | 359 | 66.0 |
| Heterobranchus bidorsalis | LT | 1 | 660 | 660.0 | 660 | - |
| Heterotis niloticus | LT | 3 | 341 | 379.7 | 428 | 44.3 |
| Hyperopisus bebe bebe | LF | 15 | 120 | 144.0 | 160 | 13.0 |
| Hyperopisus bebe niloticus | LF | 5 | 159 | 161.6 | 168 | 3.8 |
| Lates niloticus | LT | 16 | 188 | 368.9 | 532 | 102.4 |
| Marcusenius senegalensis | LF | 11 | 90 | 111.8 | 180 | 25.2 |
| Mormyrus rume | LF | 11 | 16 | 156.5 | 200 | 50.6 |
| Oreochromis niloticus | LT | 94 | 170 | 242.3 | 340 | 35.7 |
| Petrocephalus sp. | LF | 3 | 60 | 60.0 | 60 | 0.0 |
| Schilbe mystus | LF | 20 | 100 | 173.1 | 210 | 29.2 |
| Synodontis batensoda | LF | 15 | 10 | 123.9 | 190 | 69.5 |
| Synodontis biscutatus | LF | 6 | 140 | 156.5 | 170 | 11.9 |
| Synodontis clarias | LF | 9 | 100 | 134.3 | 185 | 30.1 |
| Synodontis orientalis | LF | 21 | 100 | 128.9 | 190 | 23.3 |
| Synodontis schall | LF | 2 | 10 | 50.0 | 90 | 56.6 |
Table 1: Fish length (in mm): medium (Lmed), maximum (Lmax), and minimum (Lmin) fish species sizes found in all catches. The catches were conducted from our three study sites on Lake Iro; N=Number of individuals sampled.
Spatial variation in size range
Global size ranges observed from the two border and lake mouth catches showed the modal class at borders was 225 mm and the lake mouth fish were 125 mm (Figure 2). The average size for the borders catch was 214.5 mm and 189.9 mm at the lake mouth. The right adjustment for size range at the lake mouth exhibited a slope of 0.009 and a y-intercept of 4.7 (R2=0.92). The slopes of the linear models adjusted for size range for the two areas (borders and mouth) were significantly different (P<0.001). By contrast, the y-intercept coordinates were significantly different (P<0.001). The straight lines of adjustment for size range were located at different levels but had comparable profiles.
Juvenile fish were caught in high numbers at the lake mouth, where fishing pressure is severe due to the high number of set nets observed at the lake mouth channel. At lake borders, the highest occurrence of large fish was observed, but a large number of juveniles were also noted. Most of the fish analysed (n=68) exhibited full stomachs.
Trophic dynamics of Lake Iro
Among the 23 surveyed species in Lake Iro catches, the most abundant trophic category in number of species are secondary consumers, with represented 56.5% (Table 2). Two primary consumers (O. niloticus and Citharinus citharus) composed 27.4% of the total weight landed (Figure 4). In the secondary consumers category, Clarias gariepinus, Synodontis clarias, Synodontis batensoda and Streptomyces orientalis represented the majority of the catches. The tertiary consumers in the catches were largely composed by Labeo niloticus, B. bajad, and B. docmak. The mean trophic level of the Lake Iro calculated from the experimental fisheries was 3.1.
| Trophic category | Number of species | Species |
|---|---|---|
| Primary consumers | 3 | Citharinus citharus |
| Distichodus rostratus | ||
| Oreochromis niloticus | ||
| Secondary consumers | 13 | Alestes baremoze |
| Clarias gariepinus | ||
| Gymnarchus niloticus | ||
| Hyperopisus bebe bebe | ||
| Hyperopisus bebe niloticus | ||
| Marcusenius senegalensis | ||
| Mormyrus rume | ||
| Petrocephalus sp. | ||
| Synodontis batensoda | ||
| Synodontis biscutatus | ||
| Synodontis clarias | ||
| Synodontis orientalis | ||
| Synodontis schall | ||
| Apex predators | 4 | Bagrus bajad |
| Bagrus docmak | ||
| Heterotis niloticus | ||
| Schilbe mystus | ||
| Omnivores | 3 | Brycinus nurse |
| Heterobranchus bidorsalis | ||
| Heterotis niloticus | ||
| Total | 23 |
Table 2: Species distribution recorded in the catch range by trophic category.
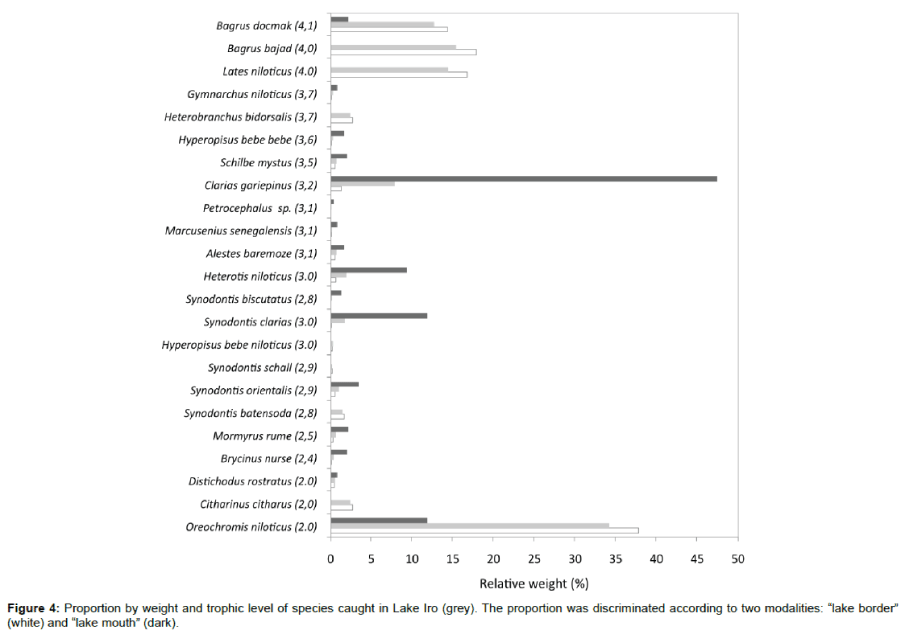
Figure 4: Proportion by weight and trophic level of species caught in Lake Iro (grey). The proportion was discriminated according to two modalities: “lake border” (white) and “lake mouth” (dark).
The primary consumers (37.2%) and tertiary consumers (44.6%) composed the majority of Lake Iro fish abundance (Kg/ha). At the mouth of Lake, tertiary consumers and omnivores abundance was very low; however, abundance was high in the same categories at the borders sites (Figure 5). The abundance, depending on trophic level, was calculated as 52% for trophic levels 2 to 3, and 48% for trophic levels 4 to 5.
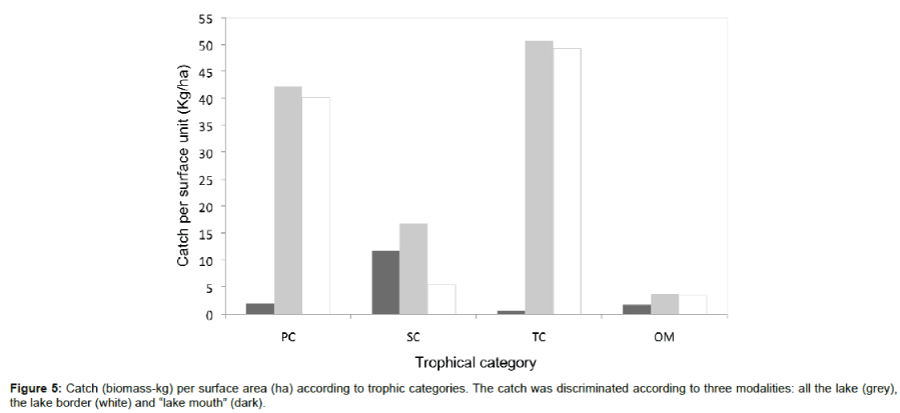
Figure 5: Catch (biomass-kg) per surface area (ha) according to trophic categories. The catch was discriminated according to three modalities: all the lake (grey), the lake border (white) and “lake mouth” (dark).
In addition, numbers of distribution trends according trophic categories are conform to those of weight. In Lake Iro, the proportions in number of primary and secondary consumers in the catches were more important. The proportion of secondary consumers fish was very high at the mouth of the lake and low at the two borders sites (Figure 6). The higher trophic levels were also relatively important in the lake catch.
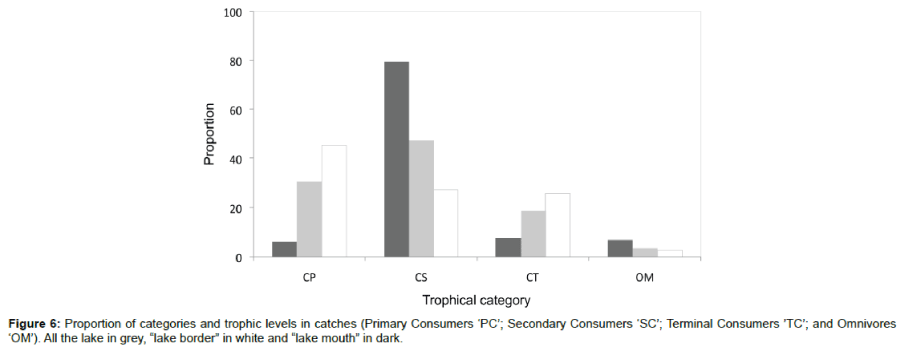
Figure 6: Proportion of categories and trophic levels in catches (Primary Consumers ‘PC’; Secondary Consumers ‘SC’; Terminal Consumers ’TC’; and Omnivores ‘OM’). All the lake in grey, “lake border” in white and “lake mouth” in dark.
Lake Iro is a breeding area for many fish species, including but not limited to B. docmak, B. bajad and O. niloticus, which are important food sources for local communities in developing countries in the Central African region [1]. Our results indicated small scale fishing efforts exhibited negative effects on the size structure of Lake Iro fish populations. These observations were consistent with expected impacts of fishing on the size range of intensively exploited fish populations, i.e., a marked decrease in the proportion of large fish [5,36]. At the mouth of Lake Iro, intense fishing pressure and a decline in large fish abundance resulted in a change in fishermen’s selection of preferred angling gear. The seine net mesh sizes were reduced to accommodate smaller fish, and in some cases, an illegal monofilament net was put into practice.
The lake catch composition was amended, and more fish of small sizes were inventoried: the modal class of fish size distribution at the lake mouth is 125 mm. We assumed the exploitation intensity modified the population trophic structure at the lake mouth. The observed changes in the trophic spectrum showed that high fishing pressure was increasingly exerted on species at the bottom level of the food chain, even if predatory species were identified in scientific catches.
The current lake exploitation levels in the absence of selective fishing gear have led to a shift in the expected impacts on an overexploited aquatic ecosystem (i.e., increase in lake trophic levels). The results of this study indicate the lake manager and stakeholders should regulate all fishing activities, e.g., fishermen must adhere to specific fishing techniques. Based on our results, catches at Lake Iro are not at optimum production levels due to fishing pressures, which are too localized and do not exhibit adequate species diversity. Implementation of a protected area at the river inlet will protect juvenile fish from exploitation and will serve to maintain the predator/prey balance in the aquatic food chain. Consequently, new generations of fish can mature and be harvested by the entire community operating throughout Lake Iro and not only fishermen working on the river inlet.
The argument presented here justifies the assertion that differences observed between sampling sites can be attributed to the impact of fishing. The results reported here also supports the assertion that a shift has occurred at the mouth of the lake and the statement that catches at Lake Iro are not at optimum production levels due to fishing pressures. There is, however, one main drawback of this study which is the analysis relies on a set of data that can be assumed as insufficient to hope answering the question about the impact of fishing on fish populations present at the mouth of Lake Iro, in Chad. Catches of the two samples from the border of the lake are pooled and compared with those of the mouth. Although having these two observations is interesting and provided good arguments for the findings, the statistically significant differences observed between sites would be more reliable if the observations were conducted in independent replicates. Indeed, it can be assumed that there is a risk that some of the claimed results come from a sampling randomness. It is, however, evident from the results that findings presented and discussed here are supported by the results. Further studies with more efficient surveys including repetitive, replicate and reproductive protocol are needed to confirm the results reported in this study. These studies should also take into consideration the pollution pressures, which are known to have considerable influences on fish composition. Such additional studies will probably improve the management of the Lake Iro and can be used as model to study other ecosystems of the Central African region.
In conclusion, the main scientific issue raised by this study is to investigate the impact of fishing on fish populations present at the mouth and summarise the actual situation of Lake Iro, in Chad. Both literature and scientific survey data were used to perform appropriate analyses that allowed developing indices or finding information for this Central African Lake. The analysis based on a comparison between samples collected at the mouth and on the border of the Lake examined the abundance of species, the mean sizes or size distributions, but also more global indicators such as the slope of the size spectrum, trophic levels, and diversity indices. The analyses enabled to gain new knowledge, especially on the structure of the ichthyological stands in Chad where the current data and knowledge on fish populations and fisheries impacts are really poor. The key component of this study is the informative fish description, which included size, composition, biomass, trophic level in the Lake Iro. The study has a richness of 23 fish species, defined in different tropical categories, which are primary and secondary consumers, predators and omnivores. The different indicators developed and the choice of the indices helped to define the fish composition, diversity and trophic level. Although the approach used in this study shed slight light on the management plan as announced in the abstract, it has a limitation which is the limited set of data that can be assumed as insufficient to draw definitive conclusions. The results presented here are the first step towards the establishment of a sustainable and durable fisheries management plan in Central Africa.
The authors would like to thank Timothée Brochier (IRD) for the English editing. We also thank the two anonymous reviewers whose comments have helped to considerably improve the manuscript. Conflict of interest and funding eventual conflicts of interest (including personal communications or additional permissions, related manuscripts), sources of financial support, corporate involvement and patent holdings are disclosed. The project that allowed collecting the data related to this manuscript was funded by the French Institute for the Environment.