Journal of Hematology & Thromboembolic Diseases
Open Access
ISSN: 2329-8790
ISSN: 2329-8790
Research Article - (2013) Volume 1, Issue 4
Background: Effective management of warfarin dose to get therapeutic range of International Normalized Ratio (INR) is complex. The present study was designed to know the quality of warfarin control.
Methods: We consecutively enrolled 113 patients taking warfarin. Two groups of patients were divided according to different settings of therapeutic INR. We compared their time in therapeutic range in these two groups.
Results: Totally 113 patients, with 1976 INR tests, were enrolled. Total follow-up period was 188.4 patient-years. Group A included 25 patients, with mean age 43.4 ± 16.0 years, mean INR 2.96 ± 1.61, and mean warfarin dose 4.69 ± 2.03 mg. Group B included 88 patients with mean age 52.7 ± 16.7 years, mean INR 2.67 ± 2.16, and mean warfarin dose 4.80 ± 2.44 mg. One hundred fifty-four (32.8%) INRs were within the target range of 2.5-3.5 in Group A; whereas 533 (35.4%) INRs were within the target range of 2-3 in Group B. Although the target INR in Group A was set in 2.5 to 3.5, 187 (39.8%) INRs were found in the range of 2-3, which was more than those in the range of 2.5 to 3.5 (39.8% vs 32.8%) in the same group. Moreover, the percentage of INR range from 2-3 in Group A, which was originally set with INR range of 2.5-3.5, was more than the percentage found in Group B (39.8% vs 35.4%) whose INR range was set in 2-3.
Conclusions: Setting an INR target range followed by monitoring it in a specialist clinic is not enough to achieve the ideal target range.
Keywords: Anticoagulant; International normalized ratio; Prothrombin time; Warfarin
FU: Follow Up; INR: International Normalized Ratio; MHV: Mechanical Heart Valve; PT: Prothrombin Time; TTR: Time in Therapeutic Range; VKORC: Vitamin K Epoxide Reductase Complex
Warfarin has been the mainstay of oral anticoagulant therapy for about 60 years [1]. It is a worldwide oral anticoagulant commonly used to prevent thrombosis, i.e. in patients with chronic atrial fibrillation; Mechanical Heart Valves (MHVs) or thrombophilia with previous venous thrombosis. International Normalized Ratio (INR) is used to monitor the dose of warfarin, and its range was suggested to be set at 2.5 to 3.5 when a patient is with MHV, or at 2 to 3 when a patient is with other indications [2]. Such settings were proved to be effective in preventing thrombosis and minimizing the possible complications; and were thus widely accepted by many hospitals. Although warfarin is widely used and is convenient and cheap, it has many shortcomings [3]. First, the therapeutic range is narrow; second, the dose response is variable among subjects; third, it can interact with different drugs and diet [4]; and finally, the laboratory control can be difficult to standardize. Due to the above reasons, proper control of INR is not easy and it usually needs to adjust the dose even in a previously stable patient. Furthermore, most of the textbooks only suggested the ideal range of the INR, but rarely talked about how to achieve such target. Thus, many of the clinicians knew the INR target range, but didn’t know how to get good achievement for that target except by adjusting the warfarin dose by the results of INR. However, effective management was complex and the INR was often outside the target range [5-8].
In clinical practice, monitoring the warfarin dose by INR alone seemed unable to get good achievement of INR range. Deitelzweig et al. reported that only 38.1% of INR values were inside the therapeutic range [7]; Willey reported only 37.7% of INR were within the appreciate range in the usual community practice setting [8]; Mitra et al. reported that Computer-aided dosing of warfarin resulted in 61.7% of days within the therapeutic range (INR range 2-3), whereas clinician dosing resulted in only 44.1% [5]. Matchar et al. reported that with home testing the time of INR within target therapeutic range increased from 62.4% to 66.2% [9]. Franke et al. reported 30.8% of the patients were within the INR goal range [6]. Ansell et al. collected the literature data and found that the Time in Therapeutic Range (TTR) was variable from 32-86.2% [2]. All these reports demonstrated that clinical monitoring of INR didn’t guarantee high achievement of target INR, and more effort should be done to get higher achievement. In the present study, we performed a retrospective research to know TTR of different INR targets in the specialist clinics of our hospital, and a review of literature in order to find out the way to obtain higher TTR.
After obtaining consent by the institutional Ethics Committee, we performed the study in accordance with the ethical standards laid down in the 1964 Declaration of Helsinki. From September 2010 to January 2011, we consecutively enrolled 113 patients who were taking warfarin because of thrombosis, atrial fibrillation or MHVs and were regularly followed up in our specialist clinics. We reviewed their history, recorded the INR data and warfarin dosages; bleeding and thrombotic complications during the treatment of period; and calculated the TTR. Only the INRs two weeks after starting warfarin were counted, as the INR might not be stable in the first two weeks of treatment.
Prothrombin Time (PT) tests were performed in the hematology laboratory of our hospital with the commercial kit Dade Innovin (Siemens Healthcare Diagnostics Products GmbH, Marburg, Germany) by an automated machine Sysmex CA-1500. INR was calculated from the PT results according to the manufacturer’s instructions. TTR was calculated as the percentage of INRs which were inside the set therapeutic INR ranges.
Two groups of patients were divided, Group A included patients with MHV, the target INR range was set into 2.5-3.5; Group B included patients other than MHV, and the target INR range was set into 2-3. We compared the TTR in these two groups; the warfarin dosages; and the INR values in these two groups.
Paired t-test was used to compare the differences between two groups. P values less than 0.05 were considered to indicate statistical significance.
In a period of four months, totally 113 patients taking warfarin and monitored in our specialist clinics were enrolled, their mean age was 50.5 years with SD 17.0. One thousand nine hundred and seventy six INR results were got. The total Follow-Up (FU) period was 188.4 patient-years. We divided the patients into two groups as mentioned before: Group A included 25 patients with MHV, their mean age was 43.4 ± 16.0 years; 470 INRs were recorded from them with mean INRs 2.96 ± 1.61 and mean warfarin dose 4.69 ± 2.03 mg. Only 154 INRs (32.8%) were within the target range; 73 INRs (15.5%) were >4; 6 INRs (1.3%) were >8, and 4 INRs were >10 (0.9%) during the FU period. Group B included 88 patients with other diseases, their mean age was 52.7 ± 16.7 years which was significantly older than that in Group A (p=0.007). One thousand five hundred and six INRs were got from them, with mean INR±SD 2.67±2.16, which was significantly lower than that of Group A (p=0.001); and mean warfarin dose 4.78±2.45 mg, which was not significantly different from Group A (p=0.2155). Only 533 INRs (35.4%) were within the target range, 170 INRs (15.5%) were >4; 28 INRs (1.9%) >8; 18 (1.2%) >10; 6 (0.4%) >20 and 3 were >25 (0.2%). Table 1 and Figure 1 show the INR distributions in these two groups of patient.
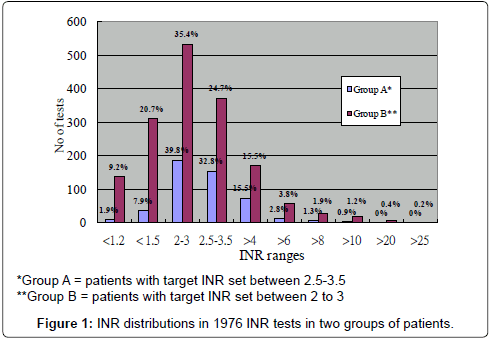
Figure 1: INR distributions in 1976 INR tests in two groups of patients.
| Number of tests (%) | ||||
|---|---|---|---|---|
| INR ranges | Group A* | Group B* | Total | |
| <1.2 | 9(1.9) | 138(9.2) | 147(7.5) | |
| < 1.5 | 37(7.9) | 311(20.7) | 348(17.6) | |
| 2-3 | 187(39.8) | 533(35.4) | 720(36.4) | |
| 2.5-3.5 | 154(32.8) | 372(24.7) | 526(26.6) | |
| >4 | 73(15.5) | 170(15.5) | 243(12.3) | |
| >6 | 13(2.8) | 57(3.8) | 70(3.5) | |
| >8 | 6(1.3) | 28(1.9) | 34(1.7) | |
| >10 | 4(0.9) | 18(1.2) | 22(1.1) | |
| >20 | 0 | 6(0.4) | 6(0.3) | |
| >25 | 0 | 3(0.2) | 3(0.15) | |
| Mean ± SD | 2.96 ± 1.61 | 2.67 ± 2.16*** | ||
Table1: INR distributions in 1976 INR tests.
In all the 113 patients, 687 INR tests (34.8%) were found within the therapeutic INR ranges. Twelve bleeding complications were noted in the FU treatment period (Table 2), they were all minor bleedings, and the bleeding rate was 6.4% per patient-year. Ten patients (11.3%) in Group B, and 2 patients (8%) in Group B had bleeding episodes, and there was no difference of bleeding rate between the two groups (p=0.73, two-tailed t-test). The INRs during the bleeding episodes were ranging from 3.55 to 26.79. One recurrent thrombosis noted during the FU period, and the INR at that time was 2.38, the thrombotic rate is 0.53% per patient-year.
| Type of bleeding | Number of bleeding | INR during bleeding |
|---|---|---|
| Hemoptysis | 1 | 26.79 |
| Oozing | 1 | 11.01 |
| Hematuria | 2 | 6.26 & 5.87 |
| Blood stained sputum | 1 | 4.26 |
| Epistaxis | 1 | 12.23 |
| Abdominal hematoma(no tissue proof) | 1 | 25 |
| Gum bleeding | 1 | 18.36 |
| Increased PV bleeding | 1 | 3.55 |
| PR bleeding, gum bleeding, epistaxis | 1 | 6.87 |
| Ecchymosis | 1 | 13.35 |
| Bruise of left knee | 1 | 12.14 |
| Total bleeding | 12 |
Table 2: Type of bleeding complications during Warfarin treatment.
One hundred and fifty-four (32.8%) INRs were within the target range of 2.5-3.5 in Group A, whereas 533 (35.4%) INRs were within the target range of 2-3 in Group B. Interestingly, although the target INR in Group A was set in the range of 2.5 to 3.5, 187 (39.8%) INRs were found in the range of 2-3, which was more than those in the range of 2.5 to 3.5 (39.8% vs 32.8%) in the same group. Moreover, the percentage of INR range between 2 to 3 in Group A, which was originally set with INR range of 2.5-3.5, was more than the percentage found in Group B (39.8% vs 35.4%) whose INR range was initially set in 2-3. Thus, although the mean of INR in Group A (INR range setting at 2.5 to 3.5) was significantly higher than that in Group B (INR range setting at 2 to 3), the percentage of INR ranging from 2-3 was higher in Group A than in Group B. i.e. the original setting of INR target with frequent monitoring could not result in a higher rate of that target.
Warfarin is the most frequently used oral anticoagulant to prevent thrombosis in the world [1]. As it was the only effective oral anticoagulant when it was first introduced into the market, it was widely accepted in patients for long term prophylaxis of thrombosis [10]. It is convenient and cheap, and as it has been used for a long time, people got a lot of experience to handle this drug. However, one of the most important drawbacks of warfarin is its unpredictable dose to maintain a stable range of INR. Many factors may affect the dose of warfarin: such as age [11]; body height; body weight; the contents of diets, especially the vitamin K contents; interaction of concurrent administration of different drugs; different drug kinetics in different individuals; the polymorphisms of the cytochrome P450 2C9 and of the Vitamin K Epoxide Reductase Complex (VKORC1), and the concomitant diseases [2]. Due to these factors, the dose of warfarin might vary not only in different patients, but also at different times in the same patient. Thus, how to control the dose of warfarin in order to let the INR fall in the therapeutic range is an important issue to be studied. However, although some studies were done, there was no any consensus or detailed guideline able to give us a better control of INR. The TTR was usually not satisfactory from most of the reports [5-8]. As a strong relationship between TTR and bleeding or thromboembolic rates has been observed across a large number of studies with different patient populations [12-17], low TTR is a great frustration which will discount the patient care very much. Thus, we have to find out some ways to solve the problem.
In our present study, we divided the patients into two subgroups which belonged to different settings of INR ranges. We found that our TTR was around one third only, not withstanding most of the patients were seen by the hematologists or cardiologists who had a lot of experience to treat such kinds of patients. In the subgroup of MVHs, the age was significantly younger than the subgroups with other disorders. This could be explained that in the non-MVH disorders, many patients had atrial fibrillation and diabetes which usually occurred in older patients; whereas the MVHs usually occurred in the younger patients.
Although mean INR was significantly higher in Group A than in Group B, which was reasonable as the INR range was originally set in the higher range (2.5 to 3.5) in Group A; the warfarin dose in these two groups were not significantly different (p=0.2155). This demonstrated that the dose of warfarin was not the only factor which determined the level of INR. Many other factors mentioned above might affect the INR rather than the dose of warfarin. If this was the fact, simply adjusting the dose of warfarin in order to get higher or lower INR was not necessarily correct. Usually when the doctors saw a low INR, the immediate thinking would be increase of warfarin dose, and vice versa. If the cause of the low INR was due to recent increase of vitamin K-abundant diet, and we increased the warfarin dose; and if the increase of vitamin K-abundant diet was only transient, the patient might get higher INR after the doctor increased the warfarin dose. It might be one of the reasons that we could not get good TTR, as most of the time we monitored INR only by adjusting the dose of warfarin.
The present study showed that none of the subgroups could achieve a good TTR whether they were in the ranges of 2 to 3 or 2.5 to 3.5. The highest TTR was not more than 40% in both groups. Moreover, we found that TTR of the INR range between 2 to 3 was higher in Group A, whose INR range was originally set into 2.5 to 3.5, than that in Group B, whose INR range was originally set into 2 to 3. It seemed that setting a target range was not much better than we achieved it by chance. This further demonstrated that the INR values were affected by many factors, and most of them might not be easily controlled or abolished by only adjusting the dose of warfarin. Thus, from the result, we know that simply setting a target range could not make us well achieve such target by only adjusting the warfarin dose according to the INR values.
As mentioned above, the warfarin effect can be affected by many factors. Some of these factors can be controlled easily, for example, the dose of warfarin can be easily adjusted to get a higher or lower INR. However, some of the factors cannot be controlled easily, for example, the pharmacodynamic change of warfarin due to interaction with other drugs or other factors, or the diet content of the patients. In the clinic, usually the doctor could do the easy ones, i.e. adjusting the dose of warfarin in order to get a better INR fitted into the therapeutic range. If it was the only way, once the affecting factors changed back to its original status, the dose of warfarin should be readjusted again. This made the INR hardly fall into the therapeutic range again. Thus, although adjusting the dose of warfarin is an easy and important way to retarget the therapeutic INR, it is not necessarily the perfect way.
Many studies tried to improve this situation. First of all, when we initiated warfarin to a patient, we had to consider the patient’s age, body mass, race, diet habits, concomitant medications and concomitant diseases. Hamberg et al. [18] mentioned that due to different age and different CYP2C9 and VKORC1 genotypes, a patient aged 50 years with CYP2C9*1/*1 and VKORC1 GG, his predicted daily warfarin dose would be 9.08 mg; and a patient aged 90 years with CYP2C9*3/*3 and VKORC1 AA, his predicted daily warfarin dose would be 0.47mg: they showed nearly 20-fold difference. Sconce et al. established an equation to calculate not only the age, the CYP2C9 and VKORC1 polymorphisms, but also adding the body height of the patient, and they found that the predicted warfarin dose by this equation was more close to the actual warfarin dose [19]. Thus, when starting the warfarin to a new patient, at least we should consider the age, the body height, and the polymorphism status of CYP2C9 and VKORC1 in order to get a more accurate warfarin dose and good TTR.
Second, for the maintenance of warfarin dose, if a patient, who was with previous stable NIRs, became to have a higher or lower INR, we had to consider at least two possibilities: one was the diet content of vitamin K and the other was the concomitant medication which the patient recently took. For example, if a patient was recently prescribed the drug of amiodarone and he had a higher INR, it might be due to the potentiating effect of this drug, and we had to reduce the dose of warfarin. And if the patient’s recent diet contained more vitamin K, we had to increase the amount of warfarin. In a patient with frequent unstable high INRs, we might try to give the patient concomitant low dose vitamin K administration if no other causes could be detected [20].
In the present study, we didn’t investigate whether the low TTR was due to diet or drug reaction, because usually we could hardly limit our patients’ diet habit. The present study just showed the fact that in the real-world practice, the low TTR is often a problem which we should do our effort to overcome it, no matter what cause(s) the low TTR is/are.
Third, other methods to give a better TTR included point of care testing, home testing, patient self-management and computer-aided dosing of warfarin. Mitra et al. found that computer-aided dosing of warfarin resulted in 61.7% of TTR (INR 2-3), whereas clinician dosing resulted in only 44.1% [5]. Matchar et al. found home testing of the INR by patients themselves had a small but significant improvement in TTR (66.2% vs 62.4%, p<0.001) [9]. Franke et al. reported that after initiating the point-of-care testing as well as a standardized warfarindosing protocol, the TTR increased from 30.8% to 45.9% (P<0.04) [6]. All these could be considered to improve our TTR.
Finally, monitoring INR in a target range is not an easy job, many other factors should be considered in addition to adjusting the dose. Although we have found some ways to improve our TTR, there are many pitfalls to be solved, i.e. the complicated drug interactions with warfarin, the comorbidity, the consumption of alcohol, other unknown mutations, and the isomers of warfarin (R-warfarin and L-warfarin). All these deserve our further investigations in order to obtain good TTR. At present, no solid guideline was established to give us a more stable INR; further studies are needed to improve the present situation. In conclusion, simply setting the INR range and frequently monitoring INR by laboratory tests in a specialist clinic is not enough to achieve good INR targeting. Many other causes would influence the TTR.
We thank Mr. David Gravell who provided all technical help to perform the INR tests.