Journal of Fertilization: In Vitro - IVF-Worldwide, Reproductive Medicine, Genetics & Stem Cell Biol
Open Access
ISSN: 2375-4508
ISSN: 2375-4508
Research Article - (2015) Volume 3, Issue 2
Purpose: To evaluate the efficacy of three colorimetric methods for detecting the presence of SuperOxide (SOx) in the neat human ejaculate based on the transformation of Nitro Blue Tetrazolium (NBT) to formazan.
Methods: The resultant color after reacting 230 neat semen samples for 30 min after ejaculation was assessed semi-quantitatively and the results compared using (1) a simple visual assessment, (2) spectrophotometry and (3) an image analysis methodology based on direct scanned digital images.
Results: After comparing visual classification with the spectrophotometric values and image analysis, 8 % and 6 %, of cases were misclassified, respectively. However, Pearson correlation calculated between values obtained by visual versus spectrophotometric or image analysis assessments were extremely high (P=0.000). The strongest correlation was observed when spectrophotometric and image analysis data were compared.
Conclusion: Color assessment produced after reacting NBT with neat sperm samples can be used as semiquantitative methodology for non-subjective assignment of SOx presence in the human neat ejaculate. The methodologies tested here, allow discrimination amongst ejaculates, with a margin of error among the different methodologies of less than 10%, irrespective of whether the assessment is performed visually, spectrophotometrically or via image analysis.
<Keywords: Male factor; Spermatozoa; Oxidative stress; Nitroblue Tetrazolium; Superoxide
Reactive oxygen species (ROS) can produce damage to living cells directly affecting proteins, lipids and/or DNA [1]. In the field of reproductive biology, the negative impact of ROS in semen samples is a popular topic of debate, so that any objective measure of its presence in the ejaculate, when combined with traditional sperm parameters, should be informative in terms of assessing sperm quality and treating or predicting male reproductive function. Antioxidants present in the seminal plasma are the most immediate protection to oxidative ROS, but typically these substances may not be provided ex vivo insufficient quantities to patients to negate all REDOX capacity generated by excessive ROS [2-4]. The ability to make a rapid assessment for therapeutic treatment of ROS soon after semen collection would be highly beneficial to the clinical andrologist.
It is estimated that between 25% and 50% of infertile patients have abnormal concentrations of ROS [5-7]. In the case of patients diagnosed with varicocele, the ROS level may be even greater when compared to other infertile patients [8,9]. Currently, in most andrology laboratories, the routine assessment of seminal oxidative stress is not included as part of the standardized practice, primarily because the existing methods are too expensive, complex or lack standardization. Presently, there are approximately thirty different methodologies to assess oxidative stress [10]. These methods can broadly be classified in three fundamental approaches according to their technical complexity and mode of action and include (i) techniques based on the detection of a colour change in the visible wavelength, including the use of malondialdehyde (MDAtests) in ELISAs [11,12]; the assessment of lipid peroxidation [13,14] or the use of the nitro blue tetrazolium(NBT) molecule to determine the presence of SOx [15]; (ii) techniques based on the detection of fluorescence or light emission after a reaction with a compound such asluminol [16-18] and (iii) paramagnetic resonance-based techniques which are highly efficient but currently too complex to implement for routine andrological analysis [10,19].
Superoxide (O- 2: SOx) is one of the key ROS molecules in the cell whereas superoxide dismutase (SOD) are enzymes involved in SOx removal through the catalythicdis mutation into oxygen and hydrogen peroxide. SOD, is therefore, an important antioxidant defence in nearly all cells exposed to oxygen, playing an essential role in anti-oxidation by scavenging the SOx. SOD deficiency causes a series of problems related to human infertility, because it produces an increase in the potential oxidative capacity of the media, such that the cells immersed in these environments can be permanently stressed. The presence of SOx in different tissues may be assessed using a colorimetric reaction in the presence of NBT [20-22]. SOx has the ability to reduce NBT to produce the non-soluble molecule, formazan; this molecule has a maximum absorption spectrum at 510 nm. SOD enhances the dismutation of SOx, so that the final colour reaction is essentially a measure of the equilibrium between the oxidant and antioxidant capacity of the media being tested [23].
The current investigation was designed to test the efficiency of three semi-quantitative methods to assess SOx presence within the neat human ejaculate. Results of NBT reaction are presented here in form of a colorimetric reaction, where the chromogenic products are derived from the reduction of tetrazolium salts by dehydrogenases and reductases to produce formazan. In this study, the semi-quantification of the resultant color was compared using simple visual assessment, spectrophotometry and an image analysis methodology based on the direct scanned digital images.
Semen samples
A total of 230 normozoospermic men aged between 25 to 53 years and who were attending their first visit to the fertility clinic were included in this prospective study. The study was conducted under the informed consent of all patients and according to the guidelines and protocols of the clinic’s ethical committee under the research project (BFU-2013-44990R). Only normozoospermic individuals presenting with a sperm concentration of higher than 20x106 mL-1 were examined.
Assessment of Super Oxide imbalance
All ejaculates were tested for SOx level using a prototype kit (Halotech DNA, Madrid, Spain) according to the manufacturer’s recommendations. Compared to other methodologies where NBT is used to assess the presence of SOx, this prototype incorporates the basic reactive molecule (NBT) dissolved in a buffered gel to form a reactive gel (RG). To normalize data collection, all samples were processed using a standarized protocol and using similar times for sperm processing and SOx assessment. Briefly, freshly ejaculated neat semen samples were processed following 30 min incubation at 20ºC for liquefaction. While the semen samples were liquefying, the reactive gel included in the kit was initially melted in a water bath at 90ºC for approximately 5 min. Later, the temperature of the gel was resumed to 37°C. The assay reaction was performed using the ejaculate without dilutionin any semen extender. An equivalent number of spermatozoa per reaction (1x10⁶) were used to ensure that the results were comparable between the different samples. A 50% mixture of RG and neat semen was incubated for 45 min at 37°C in a water-bath until the reaction was complete and the color could then be assessed.
Semi-quantitative analysis
After incubating the mixture of RG and neat semen for 45 min at 37°C, the resultant color was categorized using three different protocols: (1) visual assessment; (2) spectrophotometric assessment and (3) image analysis. For visual assessment, four different levels of color were identified according to a pre-established pantone provided in the kit. These were L1: a non-detectable level of SOx; L2: low-level of SOx; L3: medium level of SOx and L4: high-level of SOx (See Figure 1a). For spectrophotometric assessment, an Eppendorf photometer (Bio-Photometer, Hamburg, Germany) was used whereby each micro cuvette was charged with 50 μL of the color reaction and assessed after calibration using a pre-established Bradford protocols included in the photometer. This pre-established routine is designed for measuring total protein concentration and is based on the binding of Coomassie blue to protein. Color values obtained in our study ranged froma minimum of 0.003 to maximum of 2.98. Four numerical ranges of color value were assigned to each specific level of SOx: SOx-L1=0.003-0.750; SOx-L2= 0.751-1.500; SOx-L3=1.510-2.260 and SOx-L4=2.261-2.98.
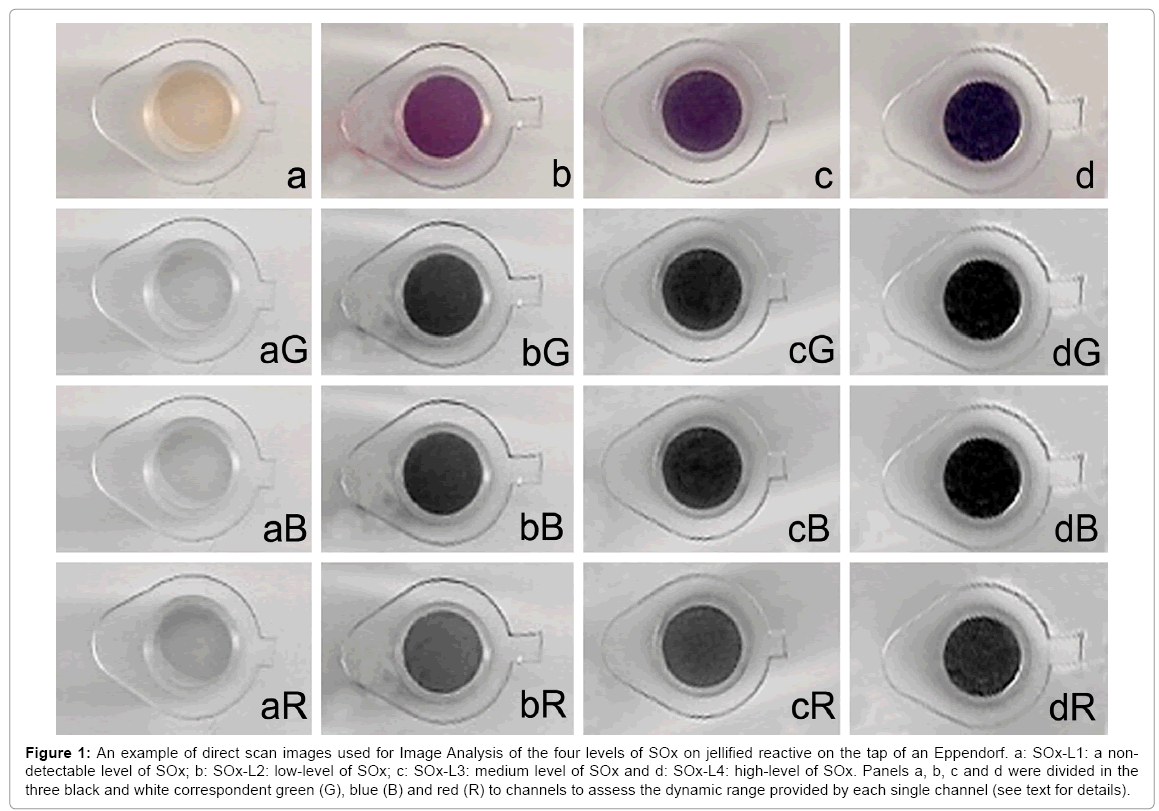
Figure 1: An example of direct scan images used for Image Analysis of the four levels of SOx on jellified reactive on the tap of an Eppendorf. a: SOx-L1: a nondetectable level of SOx; b: SOx-L2: low-level of SOx; c: SOx-L3: medium level of SOx and d: SOx-L4: high-level of SOx. Panels a, b, c and d were divided in the three black and white correspondent green (G), blue (B) and red (R) to channels to assess the dynamic range provided by each single channel (see text for details).
Image analysis was conducted by means of the images obtained from a standard HP Photosmart C5280 digital scanner (Hewlett Packard, Madrid, Spain; Figure 1). Image capture was linked to Adobe Photoshop CS4 (Adobe, CA, USA). Samples of the reacted RG were filled into the cap of a 500 μl Eppendorf tube that wasdetached from the tube (see Figure 1a and 1d). Each Eppendorf cap was then scanned using a neutral grey background as a control; the images were captured as 300 ppi resolution .tiff files. After selecting the region of interest (ROI), color intensity was assessed using free image analysis software (Image-J, http://rsbweb.nih.gov/ij/download.html, USA). Original RGB color images were separated in each single channel (Red, Green and Blue; Figure 1) and the dynamic range of the information contained in each channel analyzed. Differences between the maximum and minimum values for grey level within each channel were also analyzed. Samples with low (almost white; Figure 1a) and high levels of SOx (intense dark blue; Figure 1d) were targeted for analysis. The dynamic range, referred to a grey scale that ranged from 255 (white) to 0 (black). Information from the green channel (Figure 1aG-dG) produced the greatest dynamic range. Thus, within the 255-0 grey level information based on the green channel, we obtained values of 171 ± 7 for a low level of SOx and 53 ± 7 for a high level of SOx; this represented a grey range of 118 units (171-53). For the blue channel (Figure 1aBdB), we obtained 162 ± 4 for low and 95 ± 5for the high values;a grey range of 67 units (162-95). The red channel (Figure 1aR-dR) produced values of 180 ± 4 for low and 82 ± 5; a grey range of 98 units (180-82). To establish the different threshold values, the dynamic range from the green channel was divided into four levels of approximately 30 units difference according to the four threshold levels established by visual observation. The threshold ranges for the green channel were SOx-L1: ≥ 180-150; SOx-L2: 149-120; SOx-L3: 119-89; SOx-4: 88 ≤. The fixed neutral grey background in our capture conditions was 174 ± 6; this value was used to normalize the information after scanning. These values determined in this study were a function of the specific scanner that we used in this study, so that some calibration will be required when different model scanners are used.
Integrated density function, as defined at the image analysis software, was used for color intensity comparison among different samples. The ROI to be scanned was a fixed circular mask to select equivalent areas among different scanned images within the original image.
Statistics
All data were included in .xls files (Windows 8: Microsoft, Madrid, Spain). For statistical analysis, Pearson’s correlation coefficient between two variables was performed using SPSS 19 software package for Windows (SPSS Inc., Chicago, IL, USA).
Visual assessment
After the semen samples had been incubated at 37ºC for 45 min within the RG, four different levels of colors were visually discriminated (Figure 1a-d); L1: no-detectable level of SOx (SOx-L1; Figure 1a); L2: low-level of SOx (SOx-L2; Figure 1b); L3: medium level of SOx (SOx-L3; Figure 1c) and L4: high-level of SOx (SOx-L4; Figure 1d).The distribution of the colour intensity of the reaction, as assessed visually, is summarized in Figure 2a.
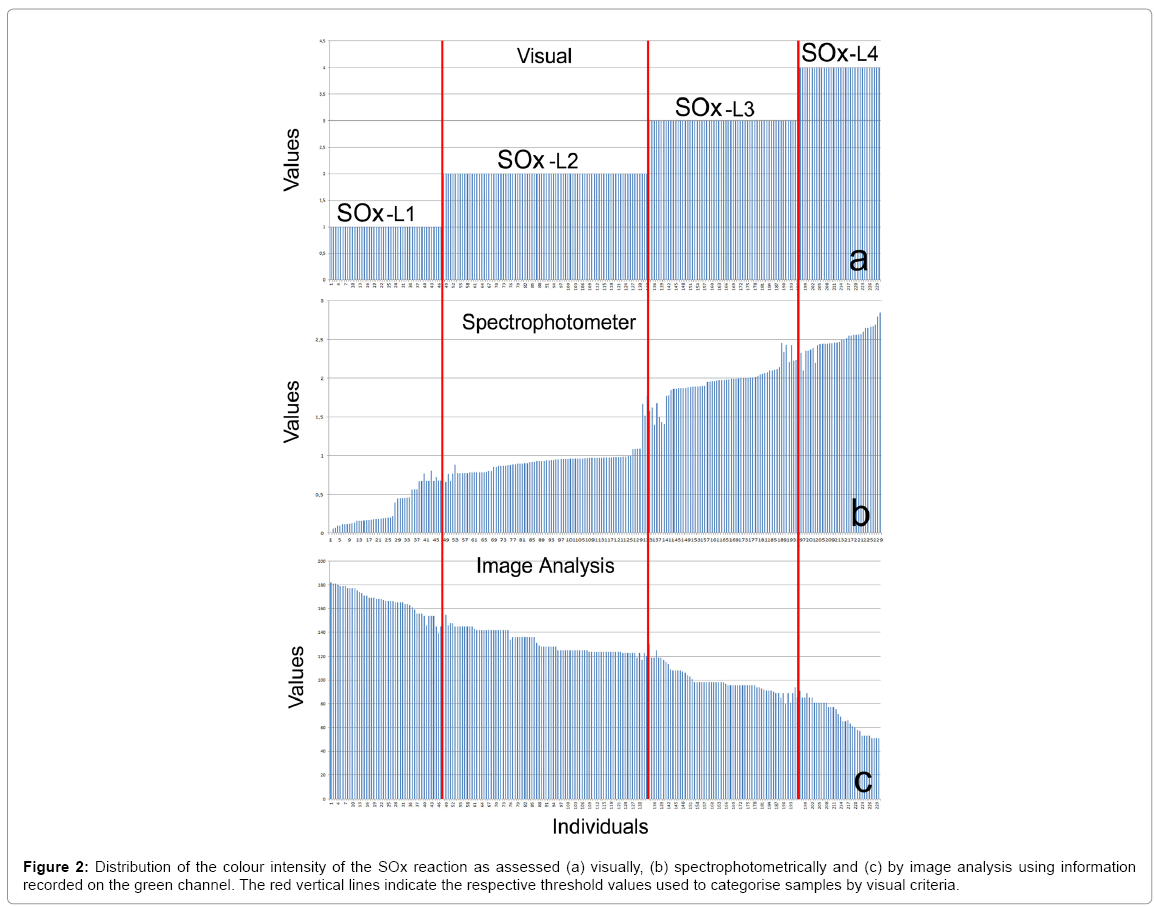
Figure 2: Distribution of the colour intensity of the SOx reaction as assessed (a) visually, (b) spectrophotometrically and (c) by image analysis using information recorded on the green channel. The red vertical lines indicate the respective threshold values used to categorise samples by visual criteria.
Spectrophotometric assessment
Results of the spectrophotometric assessment are shown in Figure 2b. When the results of the visual classification (Figure 2a) were compared with the values obtained by the spectrophotometer, 8.2% of the observations were found to be discordant. Most misclassified cases were associated with transition areas to the prefixed visual threshold levels (refer to the distribution of values around the red lines in Figure 2). Nevertheless, the Pearson correlation between values obtained by visual and spectrophotometric assessment was R =0.957 (P=0.000).
Image analysis assessment
The results of colour evaluation of the patient population obtained following image analyses are presented in Figure 2c. The data presented were those derived from the green channel since it produced the highest level of discrimination. A comparison of the visual classification system with the image analysis protocol resulted in a 6.5% misclassification of the data. The Pearson correlation between the visual and image analysis assessments was R=0.948 (P=0.000). The highest correlation was found when the spectrophotometric and image analysis data were compared (R=-0.975; P=0.000).
The results described in this experimental design have shown that the NBT colour change,when associated to a buffered reactive gel, can be used to readily discriminate the relative amount formazan precipitatesin different individuals. Only about 8% and 6% of the observations were misclassified when the visual data were compared with either the spectrophotometric or the image analysis approach, respectively. From the perspective of developing and implementing a simple, rapid routine day-to-day procedure, the visual assessment provides a reliable estimation. In fact, the margin of error was lower than 10%, irrespective of whether the assessment was performed visually, spectrophotometrically or via image analysis. The highest level of correlation was obtained when spectrophotometric observations and image analysis observations were compared. This indicates that visual assessment has the lowest level of accuracy when determining colour variations in the ejaculate.
While spectrophotometric assessment appears to be the most accurate methodology, we have detected a problem related with the use of the gel based media in that the NBT / SOx reaction which needs to be performed at 37ºC; but unfortunately this temperature is also the critical point of gel solidification. Consequently, when we pipetted 50 microliters of the RG/Semen mixture to be included in the microcuvette, the mixture tends to solidify in both the micropipette tip or in the microcuvette. We partially solved this problem by pre-warming the pippete tips at 60ºC. Imagine analysis also provides a numerical value for each assessment, is easy to implement and inexpensive in terms of consumables and specialised equipment.
It is extremely important when attempting to compare one analytical technique with other that test be adequately standardized across different laboratories. For example, while the results presented here refers to level of formazan coloration obtained in neat semen samples, all previous studies have used washed or extended sperm samples. It should be understood that sperm washing modifies the level of reactive molecules that is originally present at the neat ejaculate [24]. Hence, we need additional experimental data to assess the impact of seminal plasma in modulating these type of reactions, since the presence of SOD, the enzyme related with the scavenging capacity of seminal ROS [25,26], is retained while the seminal plasma is present, but is removed when the sperm sample is washed. When NBT is used to assess SOx in other body fluids, such as blood, it usually reacts with native samples (whole blood samples) instead of removing physiological agents with the capacity to modulate the final reaction [27-29]. Taking into account that the SOx scavenging capacity may vary among samples, performing the NBT assay using the neat semen seems a more realistic evaluation of the actual SOx levels in vivo. Although the NBT reaction is mainly associated with the presence of SOx in fluids, the possibility exist that other molecules such as no enzymatic protein glicoxilation or even the presence of acidic compounds such as ascorbic acid are also involved in colour production [30,31]. This aspect would deserve further investigation. Additionally, the other technical issue related with formazan assessment is the number or concentration of spermatozoa to be included the reaction. Tunc et al. [32] standardized their results to assess the formazan presence as lg of formazan produced per 107 sperm counts; they found that measurement of formazan production by individual sperm diluted over awide range of concentrations ranging from 2 to 500x106 sperm, showed a good linear response to varying concentration. Under our experimental conditions, the sperm concentration ranged from 20 to 200x106 and more than two thirds (197/230) of the semen samples showed sperm concentrations lower that 100x106. Under these conditions, the differences in the expected levels of formazan, dependent on the sperm concentration, are difficult to discriminate and probably can be included within the error obtained in the Tunc et al. [32] experiment for an equivalent sperm concentration range. When evaluating SOx imbalance in neat semen samples with a range of 10x to 120x 106 sperm mL-1, the levels of formazan production are not expected to be significantly modified by the sperm concentration in the reaction. More detailed experiments expanding the concentration experiment arexperiment are necessary to investigate which are the sperm concentration where the color.
In conclusion, the color assessment after the reaction of neat sperm samples with NBT-reactive gel can be used as a reliable semiquantitative and non-subjective index to show a differential response of different human ejaculates to the presence of formazan. The impact of these differences on sperm quality or even in fertility is to be determined. The methodologies methodologies tested here, allowed discrimination amongst different ejaculates, with a margin of error of less than 10%, irrespective of whether the assessment was performed visually versus spectrophotometric (8.2 of mismatching) or visually versus image analysis (6.6% of mismatching). We recommend the image analysis approach as an easy, cheap and reliable strategy to assess for such color differences.
We are grateful to Ms. Paqui Arroyo for her excellent technical assistance.This study was partially supported by a Spanish Government research grant BFU2013- 44290-R (Spain).