Journal of Sleep Disorders & Therapy
Open Access
ISSN: 2167-0277
ISSN: 2167-0277
Research Article - (2014) Volume 3, Issue 2
Background: The morphometric model (MM) provides a rapid, accurate and reproducible method for predicting whether patients in an ambulatory setting are at risk for obstructive sleep apnea (OSA).
Introduction: The aim of this study was to estimate mean MM scores in a mixed Indian population and to test a revision of the method for making intraoral measurements.
Methods: A total of 60 subjects were included in the study and were divided into two groups of 30 subjects each; Group 1: Patient group; Group 2: Control group. A comparative cross-sectional study design was employed and MM value as suggested by Kushida was estimated by applying their clinical rule. The measurements in our study were made on study models to ensure precise and accurate measurement of these anatomic distances, thus ensuring a greater accuracy for the morphometric model.
Results: The comparison of morphometric model values between OSA and non OSA groups showed an extremely statistically significant difference. The average predictive morphometric model value for OSA in this sample of Indian patients is only slightly lesser than that observed by Kushida
Conclusions: The results of this study could facilitate the early recognition of OSA and support the available diagnostic setup. This revised methodology may be used to widen the reach of the morphometric model from the sleep physician’s clinic to the Dental operatory.
Keywords: Obstructive sleep apnea; Morphometric model; Polysomnography; Predictors; Clinical rule
Obstructive sleep apnea (OSA) is characterized by repetitive obstruction of the upper airway during sleep, resulting in oxygen desaturation and sleep fragmentation. Even though OSA is fairly common, it often remains undiagnosed in primary care practice. While overnight polysomnography (PSG) is considered the ‘gold standard’ for the diagnosis of OSA, the need for accurate, quantitative diagnostic criteria is further compounded by the significant cost incurred with routine PSG. However, the lack of a simple, non-invasive, repeatable method has been an obstacle for the early recognition of OSA patients. The limited number of sleep laboratories available restricts the proper identification of OSA and may lead to underestimation of the magnitude of the problem and under-treatment, with undesirable public and personal health consequences.
Common symptoms of the condition have limited predictive value in identifying patients with OSA [1]. The morphometric model is a useful screening test to investigate the possibility of OSA in patients during initial office visits. The most commonly used predictive model is the morphometric model given of the Stanford Sleep Disorders Clinic and Research Centre, California (hereafter referred to as the Stanford Morphometric Model-SMM), which provides a rapid, accurate and reproducible method for predicting whether patients in an ambulatory setting are at risk for OSA [2]. This clinical morphometric model combines measurements of the oral cavity with body mass index and neck circumference and was tested on Caucasian patients, where it was found that patients with values equal to or more than 70, typically had OSA. There is no data available on the applicability of the predictive model to Indian subjects.
The key step in the management of OSA is to firmly establish the diagnosis. The Dental Practitioner in general and the Orthodontist in particular, now has an ever increasing role in the recognition of a patient who may be at risk for a sleep disorder. We carried out a pilot study with the aim of estimating mean SMM scores in a mixed Indian population. The method used in the original study by Kushida for intra-oral measurements, was found to be subjective and difficult to standardize for a group. A revision of the method for making intraoral measurements was also tested with an objective to provide increased usefulness to clinicians tackling this significant disorder, in many countries. The results of this study could facilitate the early recognition of OSA and support the available diagnostic setup. Based on the intra oral findings, orthodontists may request a polysomnographic evaluation when OSA is suspected and the final diagnosis of sleep disorder, its severity and the evaluation of comorbidities are made by a physician according to polysomnographic findings.
This multi-disciplinary study was undertaken at the Division of Orthodontics and Dentofacial Orthopedics, Armed Forces Medical College, Pune, India. The research protocols were reviewed and approved by the Institutional Ethical Committee of the hospital. Informed consent under witness was obtained from each participant at enrollment after each subject was explained the nature and purpose of the study. To detect a clinically significant difference with 80% power, α=0.05 and a ratio between two groups of 1:1, 60 adult Indians aged 18 years and above were recruited for this study [3]. A comparative crosssectional study design was employed. The total of 60 subjects included in the study was divided into two groups of 30 subjects each; Group 1: Patient (test) group; Group 2: Control group.
The patient sample (test group) consisted of 30 randomly selected PSG diagnosed OSA patients referred by the Department of Respiratory Medicine, Military Hospital, Cardio-Thoracic Centre, Pune, India, for the analysis of craniofacial morphology. PSG performed was level I, using a 16-channel polygraph (Sleep Scan Analysis VISION, Bio-logic Systems Corp, USA). For the purpose of this study, only one variablethe number of apneas and hypopneas was utilized. There was no prior knowledge of the patient to be seen and there was no regular pattern of days to examine the patients. For the test group, the patients who satisfied the following criterion were included in the study: age - 18 years and above; polysomnographic evidence of OSA (defined as an apnea/hypopnea index (AHI) of > 5/hour of sleep) and the presence of at least ten teeth in each arch. AHIs were calculated using using the “recommended” (AHI Rec) AASM hypopnea scoring criteria. Apnoea was defined as cessation of airflow for atleast 10 seconds with oxygen desaturation of more than 3%. Hypopnoea was defined as a reduction of 30% or greater in airflow from baseline for more than 10 seconds with associated drop in oxygen saturation of 4% or more and arousal as per the recommendations of American Academy of Sleep Medicine Task Force, 2001.
The control group consisted of 30 randomly selected adults attending the dental outpatient department, with an Angle’s Class I molar relation and no history of sleep obstructed breathing. The control group was matched with the patient sample to the best extent possible for age, gender, height and weight. For the control group, the subjects who satisfied the following criterion were included in the study: age - 18 years and above; subjects with Angle’s Class I occlusion, Epworth Sleepiness Scale (ESS) score
The exclusion criteria for both groups were: edentulous subjects; subjects with hypothyroidism; subjects with history of orthodontic treatment; subjects with history of reconstructive/orthognathic surgery; subjects with craniofacial deformity, such as cleft lip and ⁄ or palate; subjects with history of pharyngeal surgery and subjects with patient-specific disorders (such as neuromuscular disorders).
Each of the groups consisted of 19 men and 11 women. Data collection was divided into three sections as follows:
a. Medical and sleep history including an ESS.
b. Clinical examination with anthropomorphic recordings of the subject’s height, weight and neck circumference. Neck circumference (NC) in centimetres, was measured with a tape measure, at the level of the cricothyroid cartilage in upright awake subjects. For each subject, obesity was expressed as body mass index (BMI) [4].
c. Study model analysis: Measurements were taken from the maxillary and mandibular study models using a pair of digital callipers (Workzone, Global tronics GmbH & Co, Germany), with a resolution of 0.01 mm.
Upper and lower dental arch study models were obtained with alginate dental impression material and dental stone. The following measurements were recorded on the study models [2,5]. All the measurements were carried out by the principal investigator.
1. Maxillary intermolar width [Mx]: Distance between the mesiobuccal cusp tips of the crowns of the maxillary right and left permanent first molars (Figure 1).
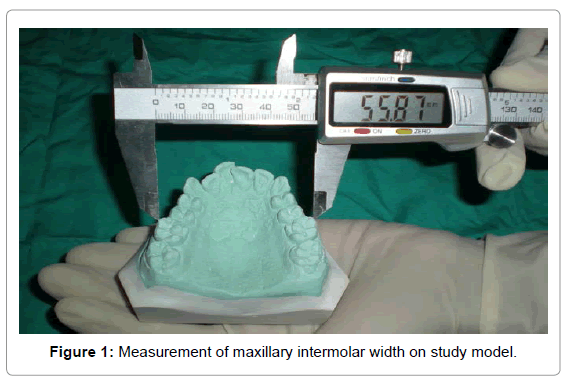
Figure 1: Measurement of maxillary intermolar width on study model.
2. Mandibular intermolar width I [Mn]: Distance between the mesiobuccal cusp tips of the crowns of the mandibular right and left permanent first molars (Figure 2).
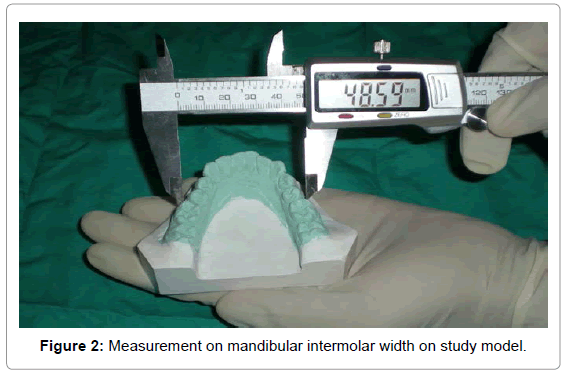
Figure 2: Measurement on mandibular intermolar width on study model.
3. Overjet [OJ]: Horizontal overlap of the crowns of the maxillary and mandibular central incisors, in millimetres.
4. Palatal height [P]: To standardize measurement of palatal depth/ height, models were trimmed until the distal contact point of the upper first molars showed up on the edge. Distance from the mid-deepest part of the palate to the line connecting the left and right distolingual cusp tips of the upper first molars was taken as palatal depth (Figure 3).
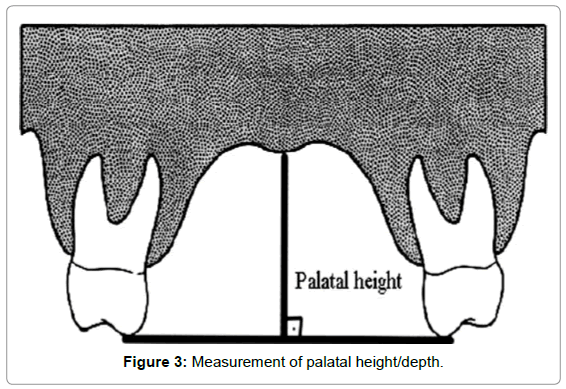
Figure 3: Measurement of palatal height/depth.
SMM score was calculated by applying the clinical rule as follows:
P+ (Mx-Mn) + 3 x OJ + 3 x (BMI – 25,0) x ( NC / BMI )
where P=palatal height in millimeters, NC=neck circumference in centimetres, measured at the level of cricothyroid membrane, Mx=distance between the mesial surfaces of the crowns of the maxillary molars in millimetres, MN=distance between the mesial surfaces of the crowns of the mandibular molars in millimeters, OJ=overjet, horizontal overlap of the crowns of the maxillary and mandibular central incisors in millimeters, BMI=body mass index (kg/m2).
Data compilation and statistical analysis
The readings were tabulated separately for the OSA (test) group and control group. The measurement of 20 randomly selected casts was repeated on separate occasions with a 2-week interval, for evaluation of intra-operator error. The difference between the first and second measurements was not significant. All measurements obtained in the study were expressed as mean ± standard deviation (SD). The data was analysed using MATLAB version 1.0 and Excel 2007. To determine the correlation between OSA severity as indicated by apnea/hypopnea index [AHI] and Stanford morphometric model, linear and multiple regression models were applied.
Stanford morphometric model values were calculated for all the subjects. The comparison of morphometric model values between OSA and non OSA groups showed an extremely statistically significant difference (P<0.0001) with the OSA group having an average morphometric model value of 67.30 ± 11.95 while in the control group, it was 55.43 ± 7.80, as shown in Table 1. The results of the regression analysis showed that there was no significant correlation between the severity of OSA as indicated by AHI and Stanford morphometric model value in this sample of Indian OSA patients (Table 1). The results of the regression analysis indicate that there is no significant correlation between AHI and Stanford morphometric model in this sample of Indian OSA patients. The line diagram for the distribution of patient’s AHI versus the calculated Stanford morphometric model value is depicted graphically in Chart 1.
| S No | Parameter | Patients with OSA (Test Group) (n=30) | Patients without OSA (Control Group)( n=30) | P value (<0.05) |
|---|---|---|---|---|
| 1 | Age,yrs | 53.6 ± 9.42 | 53.6 ± 9.422 | __ |
| 2 | ESS score | 13( ± 2.85) | 3.26( ± 0.94) | <0.0001* |
| 3 | Weight,kg | 80.10( ± 12.5) | 67.13( ± 6.78) | <0.0001* |
| 4 | Height,mtrs | 1.64( ± 0.01) | 1.64( ± 0.09) | 1 |
| 5 | Body Mass Index, kg/m2 | 29.47( ± 4.57) | 24.84( ± 1.87) | <0.0001* |
| 6 | Neck Circumference, cm | 39.80( ± 3.16) | 36.10( ± 2.59) | <0.0001* |
| 7 | Maxillary intermolar distance, mm | 53.05( ± 3.57) | 51.58( ± 3.26) | <0.01* |
| 8 | Mandibular intermolar distance, mm | 46.51( ± 3.93) | 44.48( ± 2.87) | 0.208 |
| 9 | Palatal Height, mm | 24.1( ± 1.74) | 20.75( ± 2.01) | <0.05* |
| 10 | Overjet,mm | 1.97( ± 1.92) | 2.80( ± 1.76) | 0.086 |
| 11 | AHI, events/hr | 42.04( ± 26.14) | ||
| 12 | Morphometric Model Value | 67.30( ± 11.95) | 55.43( ± 7.80) | <0.0001* |
| 13 | Corelation between AHI & SMM | 0.209 |
Table 1: Comparison of Study Group Characteristics & Correlation Between Smm Values & Ahi.
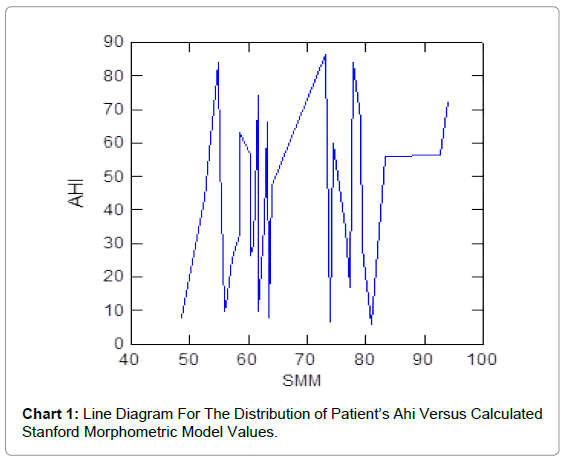
Chart 1: Line Diagram For The Distribution of Patient’s Ahi Versus Calculated Stanford Morphometric Model Values.
The average age was 53.6 ± 9.42 years. While the two groups had no significant difference in terms of height, the OSA patients were found to be significantly heavier than control subjects with a resulting statistically significant increase in BMI (P<0.05), as shown in Table 2. The patients in the test group also had a statistically significant increase in neck circumference (P<0.05), when compared to the controls. The neck circumference in the test group ranged from 34 to 45 cms with an average of 41.11 ± 2.05 cms for men and 37.55 ± 3.53 cms for women. Table 2 presents the mean of general physical examination measurements of the two groups. All patients in the test group had varying degree of OSA, as confirmed by overnight polysomnography and symptoms of snoring and excessive daytime sleepiness. OSA severity was defined by the AHI. The AHI ranged from 5.6 per hour to 86.4 per hour with an average of 42.04 ± 26.14 events per hour. In the test group, the ESS recorded a statistically significant increase (P<0.05) and ranged from 9 to 20 with an average of 13 ± 2.85 events per hour.
| S no | Parameter | Test Group (n=30) | Control Group (n=30) | df (n-1) | P value (<0.05) | ||
|---|---|---|---|---|---|---|---|
| Mean | SD | Mean | SD | ||||
| 1 | Ht in mtrs | 1.64 | 0.01 | 1.642 | 0.09 | 29 | 1 |
| 2 | Wt in kgs | 80.1 | 12.5 | 67.13 | 6.78 | 29 | <0.0001* |
| 3 | BMI(kg/m2) | 29.47 | 4.57 | 24.84 | 1.87 | 29 | <0.0001* |
| 4 | NC in cms | 39.8 | 3.16 | 36.1 | 2.59 | 29 | <0.0001* |
| 5 | ESS | 13 | 2.85 | 3.26 | 0.94 | 29 | <0.0001* |
| 6 | AHI | 42.04 | 26.14 | 29 | |||
Ht - height; Wt - weight; BMI - body mass index; NC - neck circumference; ESS - Epworth sleepiness scale; AHI - apnoea hypopnoea index. *P ≤ 0.05 = statistically significant.
Table 2: Comparison of Mean of General Physical Characteristics between Test and Control Groups.
The comparison of mean intraoral values between OSA and controls is summarised in Table 3. Overjet was found to be larger in the controls when compared with the OSA sample, but analyses failed to detect statistically significant differences (P>0.05). Statistically significant differences were found between the groups for the measurements of palatal height/ depth (P<0.05).
| S no | Parameter | Test Group (n=30) | Control Group (n=30) | df (n-1) | Regression coefficient | P value (<0.05) | R value (<0.01) | ||
|---|---|---|---|---|---|---|---|---|---|
| MEAN | SD | MEAN | SD | ||||||
| Column 1 | Column 2 | Column3 | Column4 | Column5 | Column6 | Column 7 | Column 8 | Column9 | |
| 1 | Mx | 53.05 | 3.57 | 51.58 | 3.26 | 29 | 0.061 | <0.05* | <0.01** |
| 2 | Mn | 46.51 | 3.93 | 44.48 | 2.87 | 29 | -1.875 | 0.208 | ≥0.01 |
| 3 | OJ | 1.97 | 1.92 | 2.8 | 1.76 | 29 | 0.06 | 0.086 | ≥0.01 |
| 4 | P | 24.1 | 1.74 | 20.75 | 2.01 | 29 | 0.043 | <0.05* | <0.01** |
Mx - maxillary intermolar width; Mn - mandibular intermolar width; OJ - overjet;
P - depth of palate;
*P ≤ 0.05 = statistically significant.
**R < 0.01 = statistically significant
Table 3: Comparison of Mean of Intraoral Measurements between Test and Control Groups.
Different clinical prediction rules have been described in the literature. Scientists have used various factors to predict a person’s risk of having OSA, based on their demographics, symptoms and bodymass index. Using these factors, scientists have been able to correctly identify 76% to 96% of patients who have OSA and 13% to 54% of patients who do not have OSA [6]. A comprehensive comparative effectiveness review carried out by the U.S. Department of Health and Human Services has concluded that of the available models, the morphometric model by Kushida gave near perfect discrimination between OSA and non-OSA subjects [7].
Sleep problems are common among primary care patients. A study conducted in an Indian population estimated the prevalence of sleepdisordered breathing (SDB) among middle-aged urban Indian men to be at 19.5% and that of obstructive sleep apnea-hypopnea syndrome (SDB with excessive daytime sleepiness), to be 7.5% [8]. Many studies have been done assessing craniofacial characteristics in OSA patients using cephalometrics, computed tomography, magnetic resonance imaging and acoustic reflection. Although there is controversy in the results, craniofacial alterations most closely related to the occurrence and severity of OSA are: retroposition of the maxilla, shortening of the mandibular body, inferiorly displaced hyoid bone, retrognatism, dental occlusion class II and narrow, arched hard palate [9,10].
No data are available on the applicability of the predictive SMM in patients with OSA from the Indian subcontinent and a Medline search confirms that this is the first study evaluating the correlation between SMM values and the severity of OSA, from this country. There has been only one previous Indian study in which a diagnostic model was derived and validated for the prediction of OSA in subjects presenting with non-sleep-related complaints [11]. The results of our study indicate that the relatively easier morphometric measurements afforded by the SMM enable faster screening for OSA in a primary health care setting. Other studies worldwide have also validated the applicability of SMM in identifying OSA in clinical practice, with the separation value between subjects with or without OSA being 70 [12,13].
An important aspect in medical research is to understand and improve existing measurement frameworks and methodology. In the original study, measurements were made in the mouth. The measurements in our study were made on study models to ensure precise and accurate measurement of these anatomic distances, thus ensuring a greater accuracy for the morphometric model. Plaster study models were used for the intraoral measurements in this study, since they are a standard component of orthodontic records and they are fundamental to diagnosis and treatment planning, case presentations, evaluation of treatment progress and results, besides record keeping [14]. The dental arch dimensions were measured on study models made of dental stone, by means of digital vernier callipers. Compared to dividers, studies have shown that by using sliding manual/digital vernier callipers, accurate measurements could be made from the study models in all three dimensions [15]. Although some new methods like geometric morphometrics provide excellent possibilities for morphological analysis, distance measurements on dental casts were calculated because most dental practitioners are familiar with the method used in this study.
On comparing the SMM values in this pilot study, we have been able to demonstrate statistically significant differences between the two groups. The comparison of morphometric model values between OSA and non-OSA groups showed a highly statistically significant difference, with the OSA group having an average SMM value of 67.30 while in the control group, it was 55.43. The average morphometric model value in this sample of Indian OSA patients is only slightly lesser than that observed by Kushida who found that patients with values equal to or more than 70, typically had OSA [2]. The fact that the populations under study in our group and in the study by Kushida, belong to different origins (Indian and North-Americans) and that there was no standardization to account for ethnicity may explain the differences between both studies.
The method used by Kushida and in subsequent studies for measurement of palatal depth was found to be subjective and difficult to standardize for a large group. The palatal height as suggested in the study by Kushida was measured with the tongue in a relaxed position and the maxillary and mandibular incisor tips subtending an angle of 20 degrees from the mandibular condyle. A new method for measurement of palatal depth was resorted to, because it is difficult to measure palatal depth with 20 degrees mouth opening and from the dome of the tongue in all cases. In order to standardize the measurement of palatal depth in this study, the study models were trimmed until the distal contact point of the upper first molars showed up on the edge. Distance from the mid-deepest part of the palate to the line connecting the left and right distolingual cusp tips of the upper first molars was taken as palatal depth. In the present study, statistically significant differences were found between the two groups for the measurements of palatal height/ depth (P<0.05) with the mean palatal depth in patients being greater than the mean palatal depth of the controls.
The minimum age of the subjects in this study was chosen on the basis of previous studies which have reported that molar and canine arch widths do not change after 13 years of age in females and 16 years of age in males [16]. Therefore, it was assumed that the arch widths of the subjects studied were fully developed. The strength of the present study is the inclusion of a relatively large group of Indian patients with OSA, who underwent a limited hospital-based sleep study, matched with control subjects for age and gender. This study highlights the importance of matching subjects for age to prevent any age-related morphological changes from confounding the results.
This is a cross-sectional study based on enrolment of patients attending one hospital clinic. As expected, the patients in this study only represent at best the patients attending this clinic. Further research is necessary to generalise the results to the general population and other ethnicities. Another limitation of this study was that PSG was not carried out for the controls, due to ethical considerations and the prohibitive expense of the procedure. This is usually the case with studies incorporating normal controls who do not exhibit any symptoms of OSA.
1. The SMM proposed by Kushida is applicable to this selected sample in clinical practice.
2. The average predictive morphometric model value for OSA in this sample of Indian patients is slightly lesser than that observed by Kushida.
3. The revised approach for making intraoral measurements was tested and validated in this case study, performed in a real and mature measurement framework.
Our immediate objectives were to better formalize the use of the morphometric model by restructuring existing measurement frameworks and to augment the existing approach. This revised methodology may be used to widen the reach of the morphometric model from the sleep physician’s clinic to the dental operatory.