Journal of Aeronautics & Aerospace Engineering
Open Access
ISSN: 2168-9792
ISSN: 2168-9792
Theory - (2021)Volume 10, Issue 9
This Article aims at studying and investigating different methods of aircraft’s structure failure under dynamic loading. Aircraft Structural failure can cause catastrophic results with lots of loss of lift and the aircraft as well. So, it is important to investigate the major causes that lead to failure of aircraft. This paper discusses the major causes of failure due to material used in construction of aircraft wing and also fatigue failure. Along with investigation future remedies are also concluded with different case studies and their results. Aircraft wing is constructed using high strength materials so that they can withstand major loads during flight for longer duration. Fatigue failure monitoring has now been included in all aircraft. Failure monitoring system collects all data required to calculate safe life, damage life or time required to inspect whole aircraft. This paper presents fatigue monitoring systems and tools of military agile aircraft. It comprehensively reviews all techniques used in military aircrafts and their current systems. Some major problems and their corrective measures are suggested through case studies in different analysis of failure method. Different tests, analysis and their steps are included in this survey paper.
Crack; Metallurgical testing; Root cause; Fatigue monitoring; Safe life; Fatigue life estimation; Fatigue management; Fatigue models; Aircraft structural integrity; Flight parameters; Failure analysis methods
Causes of aircraft failure
Generally, Failure in aircraft occurs when the structure, parts or components of aircraft are unable to withstand the different stresses acting on it (Table 1). While failures are commonly associated with stress concentration which occurs due to various reasons like [1]:
• Errors in design e.g. holes, notches and tight fillet radius presence
• Microstructures containing voids, inclusions etc.
• Corrosion on the material e.g. local stress concentration is generated due to pitting
| M | Mach Number |
|---|---|
| b | Altitude |
| IAT | Individual Aircraft Tracking |
| OLM | Operational Loads Monitoring |
| Ny | Lateral Acceleration |
| Nz | Normal Acceleration |
| r | Yaw Rate |
| W | Weight of Aircraft |
| β | Sideslip Angle |
| δrud | Rudder Deflection |
| ✿flap | Flap Deflection |
| Ʌ | Sweep Angle |
| ✿ail | Deflection in aileron |
| ✿elev | Deflection in Elevator |
| CR | Canard Root |
| FF | Forward Fuselage |
| HTR | Horizontal Tail Root |
| IW | Inner Wing |
| CF | Centre Fuselage |
| VTR | Vertical Tail Root |
| OW | Outer Wing |
| RF | Rear Fuselage |
Table 1: Nomenclature.
Different case histories data and records are assembled in (Table 2) for frequency of different failure modes. Table 2 reveals that failure due to fatigue dominates in aircraft. This suggests that fatigue is a dominant and dangerous mode of failure. Rectification and detection of failure due to corrosion is more difficult and requires more effort than repairing the crack due to fatigue.
| Percentage of Failures | ||
|---|---|---|
| Engineering Components | Aircraft Components | |
| Fatigue | 25 | 55 |
| Corrosion | 29 | 16 |
| Overload | 11 | 14 |
| Brittle fracture | 16 | - |
| High temperature corrosion | 7 | 2 |
| SCC/Corrosion Fatigue/HE | 6 | 7 |
| Wear/abrasion/erosion | 3 | 6 |
| Creep | 3 | - |
Table 2: Frequency of Failure modes/mechanisms.
Modes of aircraft failure
Material failure analysis: Material Failure Analysis is a process in which a mechanism is derived by material engineers so that they can know exactly how a component or a material has failed. There can be many modes of failure but cracking and corrosion are the most typical failure modes.
A material experiences many stress conditions under various environmental effects that can result in failure of material. Metals are design to withhold all these environmental and stress conditions that they experience. Material Engineers takes as much of information as possible into account during their analysis. The ultimate goal of failure analysis is to determine the root cause of failure and provide a solution to the problem to prevent any possibility of failure in future [2]. Damage and failure analysis include:
• Assessment of material
• Investigation of metals
• Study of fracture
• Evaluation of electronics
• Investigation of damage due to fire
• Review of design
A. Destructive metallurgical testing: Destructive metallurgical testing can be used in analysing the failed part. This testing includes removal of metal and sections it for deferent analysis [3]. It gives the ability to analyst to perform the analysis in laboratory and to perform different tests on the material to eventually destroy it.
B. Non-destructive metallurgical testing: Non-Destructive Testing is a method of testing which allow examining different physical properties of metals without removing it completely from servicing. Generally, it is used to detect component failure before it fails catastrophically.
Failure is encountered when a structure or machine has not been designed as per specifications. Failure Analysis is a way to determine the actual cause of failure of material and prevent any future risk of failure [4]. After all analysis has been done, a report is made that includes all testing data and results along with preventive measures. Material failure occurs when its structure breakdown and it is due to lots of different factors that effects the stability, chemical composition and strength. Possibilities of failure may involve:
• Fatigue cracking
• Erosion surfaces
• Corrosion
• Stress cracking corrosion
• Cavitation effect
• Galling
• Foreign object damage while operating
• Fretting of material
Causes of material failure [5]
The main causes of failure of material include:
• Defects in manufacturing process
• Assembly and designing errors
• Environmental protection is inadequate
• Quality assurance is inadequate
• Material selection is improper
Tests during failure analysis
Different test perform in failure analysis includes;
• Assessment of material
• Investigation of damage due to fire
• Analysis and contamination of surface
• Determination of surface roughness
• Evaluation of welding
• Determination of contamination of coating
• Identification of paint
• Evaluation of microstructures
• Etching
• Testing of adhesives
• Physical testing
• Analysis of corrosion
• Fractography
• Analysis of chemicals
• Electron microscope scanning
• Review of design
Advantages of failure analysis
Some advantages of failure analysis include:
• Identification of flaws and defects in material sample [6].
• Prevention of failure before it can cause any accident.
• Improve reliability and durability of design
Scratch test
Highly precised indentation using diamond point can give lots of information of different mechanical properties that includes elasticity, creep, hardness and yield strength of metals, polymers, coatings and plastics [7]. Scratch testing can also be used in examining adhesive and cohesive failure, strength due to adhesives and initiation of crack (Figure 1).
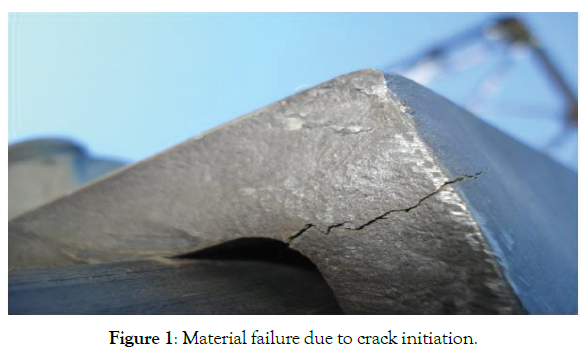
Figure 1: Material failure due to crack initiation.
Determination of root cause for failure analysis
Failure analysis is a process which is used to find out the root cause of failing of material when it does not meet the expectations. The root cause of failure analysis provides the tools needed for preventive and remedial actions to be taken.
Steps involve in investigating root failure analysis are:
• Reviewing the background knowledge [8]
• Examine visually and non-destructively
• Measuring physically
• Examine Corrosion
• Analyse chemically
• Metallographically testing
• Examine fractographical
• Test mechanically
• Scan with Electron Microscope
• Analyse with Elemental Dispersive X-ray [9]
• Analyse with Fourier dispersive infrared
• Diffraction with X-ray
• Analyse the surface
• Finite element analysis
• Mode of failure determination and it’s primarily cause
• Engineering calculations using finite elemental analysis or computational fluid analysis [10]
These steps can be used to determine the root cause of failure for any material or component. Following is a case which is solved using root cause failure analysis.
Aircraft component failure analysis
Examination of two halves of broken steel pins was carried out. The submitted samples are identified as components of Left- Hand Main Landing Gear. Determination of mode of failure is done using root cause failure analysis.
Examining visually: The failure location has been shown by arrows in two pin above Figure 2. The cylindrical part of pin was corroded from outer surface at which the failure has occurred [11-14]. The below figure shows one side of failing surface due to fracture. The chevron patterns that are converging identify the fracture initiation area from outer surface. Initiation site of fracture is marked red as shown in figure below. Lots of course low cycled fatigue crack marks were also identified at ends of both discoloured crack propagating sides. Corrosion can also be seen at initiating site of fracture. In cylindrical surface, a depression and circumferential ridge were found. While it was also seen in unbroken pins as well [15]. By comparing cylindrical parts of both pins it was discovered that fracture initiates at circumference depression of broken pin. Corrosion was removed by macro etching the fracture initiate area in hot aqueous 50% HCL acid. Clean surface shows fracture initiating area as shown in Figure 3 below.
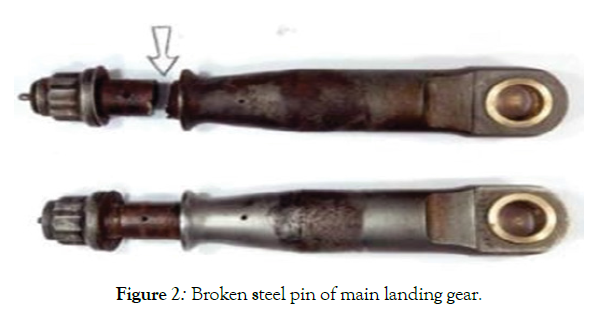
Figure 2: Broken steel pin of main landing gear.
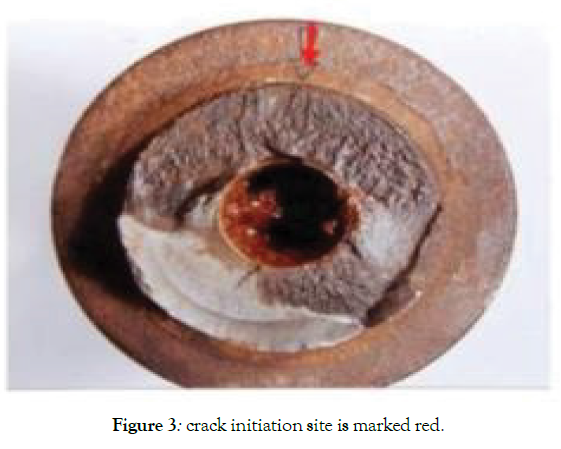
Figure 3: crack initiation site is marked red.
Metallographic examine: For metallographic examine, a cross section traversing through fracture initiating area is prepared (Figure 4). The surface profile of fracture is relatively flat` . No crack propagating was seen. There was some dark-etched martensitic tempered in microstructure [16]. There was no plastic deformation at fracture area.
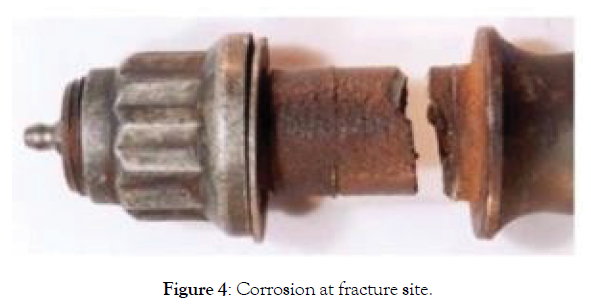
Figure 4: Corrosion at fracture site.
Fatigue which initiate at outer cylindrical surface cause failure of pin. Corrosion and wear are present at this outer surface.
Circumferential groove which is shallow is initiating point of fracture [17-18]. The corrosion is also present along with fracture surface. There is no presence of cracking due to stress corrosion was observed (Figure 5).
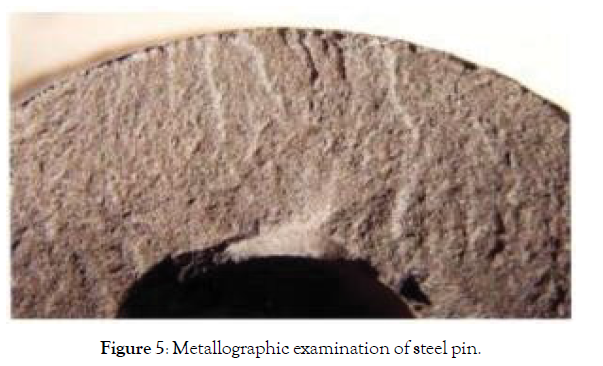
Figure 5: Metallographic examination of steel pin.
Corrosion: It is chemically degradation of materials when it reacts with environment. Usually, it occurs when metal is damaged at such extent that its component cannot support applied loads. In aircraft structures, preventive measures are taken to limit the effect of corrosion like using coating such as paint which acts as barrier to environmental effects [19]. Corrosion has lots of different forms and they all cause different effects and cause different problems to aircraft structures. Commonly, these are different types of corrosion observe,
• Uniform corrosion: It occurs without localizing attack which results in uniformly decrease in size.
• Pit corrosion: Corrosion develops pits in materials which cause localization of material. Pits formed are generally small and it is difficult to detect them while inspection. It can cause perforation in material with little loss in weight.
• Crevice corrosion: It is caused due to change in environment that leads to increase in localizing attack. Stagnant environment causes these changes and form crevices which are narrow. Crevices can occur at joints of two materials.
• Galvanic corrosion: When direct contact of dissimilar metals in corrosive environment occurs electrically. It is generally due to bad design and material.
• Stress corrosion: It is caused by exposing metal to mild chemical environment or to stress in tension that is less than the yield strength of material. The stress required can be generated from stresses (residual) or in-service conditions.
The top surface of wing which contains a door is subjected to metallurgical testing due to corrosive surface found in an inspection. Aluminium alloy is used in manufacturing panel and door and along with them aluminium catches are also attached to secure the door in close position. In between the aluminium plate and catches stainless steel shims are fitted. Figure 6 shows the door and panel’s outer surface as the paint is stripped and catches are removed. After viewing from outside surface, it appears that door or panel experience no damage at all [20]. However, after examining the inside surface, lots of corrosive surfaces are seen on door and plate in catch position (Figure 7). Lots of cracks are seen on ribs while inspecting. A part of plate which contains worse corrosive area is taken and is shown in Figure 8. The material is also checked and it is found that it is conform to specifications. Shims made of stainless steel are fitted beneath the catches. Although the paint is present in between of both metals, but for more than 25 years these panels are being used and barrier between both of these two dissimilar metals is broken and contact of both of these materials is allowed. Once contact is allowed to established, galvanic cell is formed in which stainless steel causes fast and increase corrosion of aluminium.
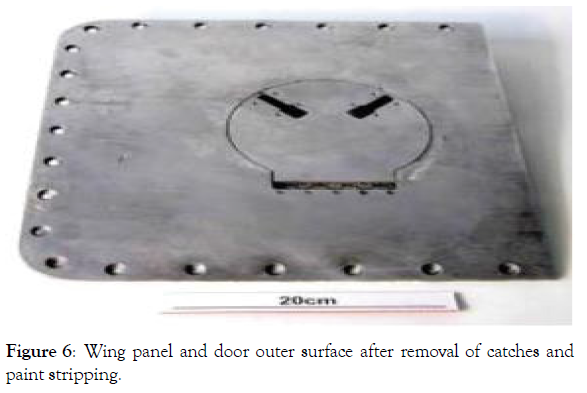
Figure 6: Wing panel and door outer surface after removal of catches and paint stripping.
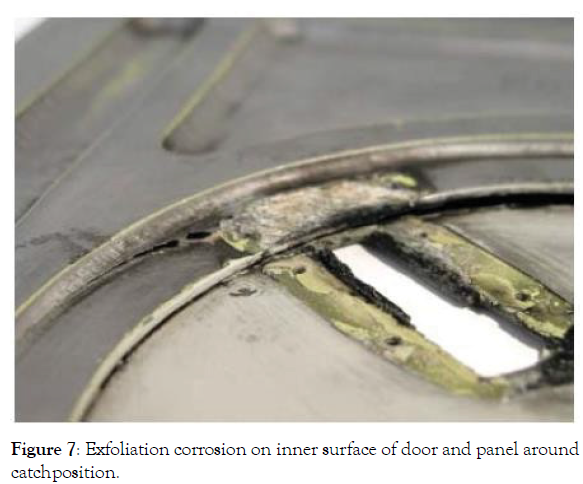
Figure 7: Exfoliation corrosion on inner surface of door and panel around catch position.
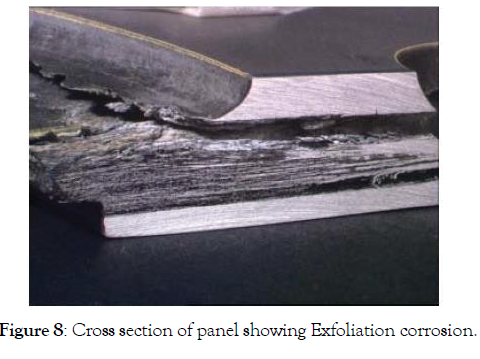
Figure 8: Cross section of panel showing Exfoliation corrosion.
Hydrogen embrittlement
It is failure that occurs due to absorption of hydrogen in metals usually in combination of residual stresses and applied tensile stress [21-23]. Commonly, it occurs in high strength steels with strength greater than 1100 Pa. In aircraft components, it is due to hydrogen absorption in manufacturing process like electroplating and pickling.
A bolt present in FPU (flaps control unit) got damaged or fractured from thread portion of shank near shoulder with head during installation. The investigation is carried out in order to know the exact cause of failure. The material used in manufacturing the bolt is cadmium plated high strength steel. The material used has approx. ultimate tensile strength of 1380 MPa. SEM technique examines fracture surface in order to know the mode of fracture and to determine if there are some defects that already exist. Fractured surface shows two different modes of failure[24]. Bolt centre exhibits ductile features as shown in Figure 9 and outer surface exhibits intergranular features as shown in Figure 10. Static overload failure caused both modes of crack growth but ductile failure should have been present throughout. While intergranular failure is due to embrittlement which cause premature failure. The embrittlement attribute to cadmium plating which provide protection against corrosion to steel. Hydrogen evolves during process of plating, and it is absorbed by steel [24-25]. Cadmium plating act like barrier to diffusion of hydrogen at ambient temp. So that hydrogen can get trap in steel. In high strength steel having strength greater than 1100 MPa lead to embrittlement. In order to solve this problem, fasteners are heated at temperature of 175 to 205°C for about 24 hours which causes diffusion of hydrogen. In this case, bolts failure is caused by insufficiently heating, which led to embrittlement due to hydrogen diffusion.
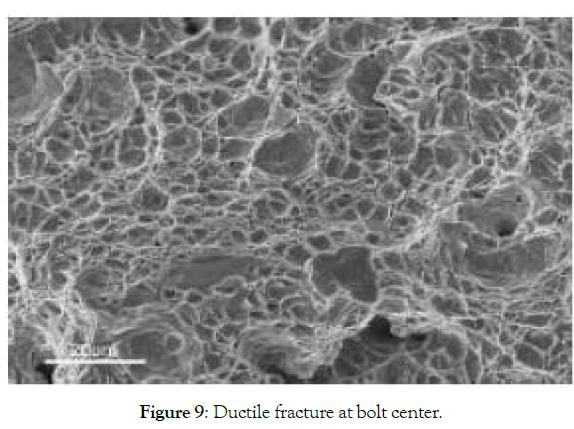
Figure 9: Ductile fracture at bolt center.
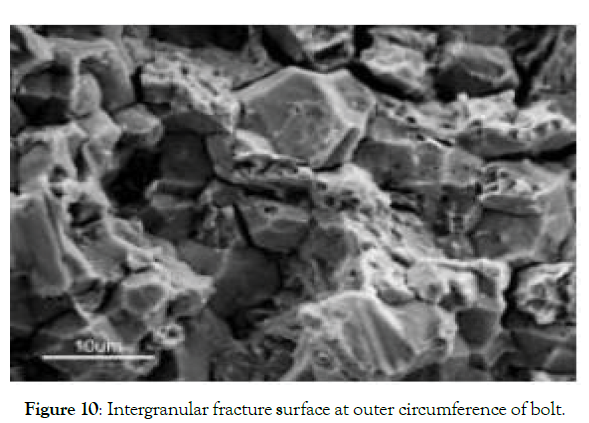
Figure 10: Intergranular fracture surface at outer circumference of bolt.
Fatigue
Fatigue failures are very common in the metallic structures and well-known technical problem. During 19th century the fatigue was thought to be a mystery in materials [26]. Fatigue failure occurs without giving any warning. Fatigue is basically the failure of materials under repetitions of loads. Failure due to fatigue contains three major steps that are described below:
Crack initiation: This phenomenon is normally invisible to the naked eye due to the stress concentration at the notches, irregularities etc. crystal slipping occurs which leads to the generation of extrusion and inclusions (micro cracks) at those localized areas as shown in Figure 11.
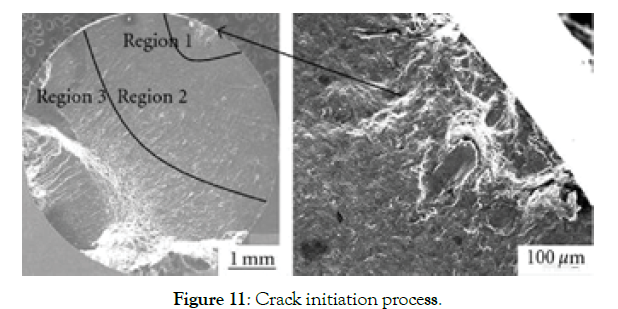
Figure 11: Crack initiation process.
Crack propagation: This is a gradual and progressive process; the micro cracks are gradually converted into macro cracks with continued cyclic loading [27]. During the crack propagation, a pattern is generated on the cracked surface, which when studied tells the type of loading and cycles the structured has faced, these on the last stage before failure. Failed surface can be judged by looking at the surface either it is ductile or brittle [28]. Fatigue failure happens before giving any kind of warning. Its behaviour can be seen below Figure 13.
Failure Analysis is a way to determine the actual cause of material failure and it also suggests preventive measures to deal with any future issues. After completing all analysis, a report is made that includes all data acquired from testing and results along with preventive measures.
patterns are used for fatigue investigation. Since then it was clear that the fatigue life under cyclic loading consisted of 2 phases, the crack initiation life is including crack growth until failure (Figure 12).
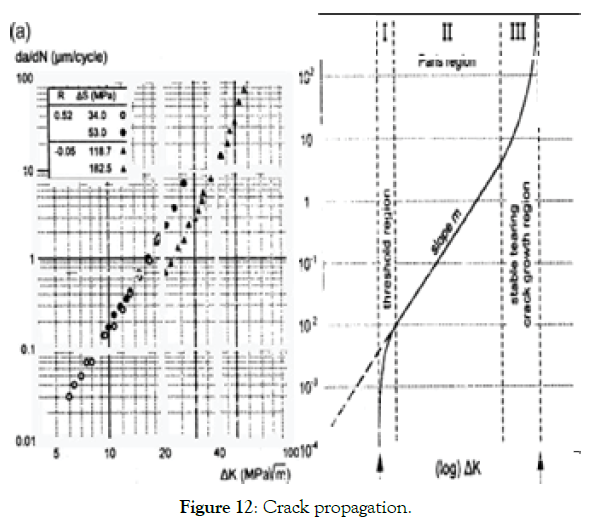
Figure 12: Crack propagation.
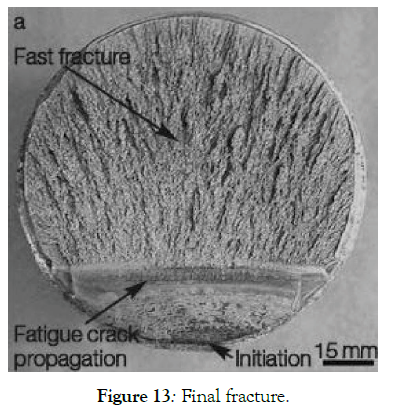
Figure 13: Final fracture.
Final fracture: The final fracture happens when the material is Table 3 shows observed fatigue sites in aircraft which have led to accidents.
| Number of Accidents | ||
|---|---|---|
| Initiation Site | Fixed Wing | Rotary Wing |
| Bolt, stud or screw | 108 | 32 |
| Fastener hole or another hole | 72 | 12 |
| Fillet, radius or sharp notch | 57 | 22 |
| Weld | 53 | 3 |
| Corrosion | 43 | 19 |
| Thread (other than bolt or stud) | 32 | 4 |
| Manufacturing defect or tool mark | 27 | 9 |
| Scratch, nick or dent | 26 | 2 |
| Fretting | 13 | 10 |
| Surface or subsurface flaw | 6 | 3 |
| Improper heat treatment | 4 | 2 |
| Maintenance-induced crack | 4 | - |
| Work-hardened area | 2 | - |
| Wear | 2 | 7 |
Table 3: Fatigue Initiation sites in aircraft.
A. Fatigue monitoring: The aircraft’s fatigue management begins as process of design along with application of stress spectrum, design philosophy, material and theory to calculate cumulative damage to find fatigue life [29,30]. This estimation is then checked through fatigue testing of structure, through which the operators collect load data and made a managing policy. The process to collect load data is fatigue monitoring and all regulations of airworthiness require all military aircrafts to fit an on-board usage fatigue monitoring system (Figure 14).

Figure 14: Fatigue monitoring tools evolution.
A number of purposes can be served using fatigue monitoring:
• It fulfils all requirements of airworthiness to make sure that aircraft is not operated beyond acceptable level of risk [31].
• It determines fatigue life of aircraft based on operational spectrum of aircraft life.
• It determines actual load history throughout the service.
• It detects any occurrence of overload in structure to ensure safety of aircraft.
In early days, fatigue management of aircraft was carried using documentation of flying hours or cycles of landing. When aircraft reach designated number of flying hours, they were retired from service. While later on advancement was made in fatigue management process and cycle counting techniques were developed that relates stress and loads to damage due to fatigue [32].
Later fatigue meters were developed which help in counting exceeding +ive and -ive g-levels during aircrafts service. In late 1960’s fatigue gauges were developed in which strain gauges were used.
B. Fatigue monitoring tools: There must be fatigue monitoring tools used and the basic purpose which includes:
• Determine the load history for aircraft
• Define the airworthiness that after certain period of time aircraft should not fly
• To determine fatigue life currently status
• Define the safe limit life or interval for the inspection of an aircraft against its design mission profile loads
• Elaborate the changes that are to be done in the designed mission for the reduction of fatigue damage.
• Set a period of time for aircraft for routine inspections.
• Consider the weight increase or decrease during its life airframe
• Timely feedback of the aircraft for corrective actions.
• To assist in defining the load spectrum for another same aircraft
Many important parameters are considered while considering the tools to be used for the fatigue monitoring main parameter being the cost but apart from that the parameters that are considered important in selecting a specific tool includes volume and accuracy of collected data [33].
Different type of tools is employed for monitoring fatigue each of them has their own advantages and disadvantages, and will be discussed in the subsequent sections:
1) Flight hours: This method is applied for counting of total flying hours flown by the aircraft to define the load history.
Advantage:
• Simple and cheap
• No equipment needed for it Disadvantage:
• Assume no variability in mission profile
• Only apply in landing and pressurized structure
2) Fatigue meter: The fatigue meter is software for data acquisition. This uses Nz based connected with flight time and weight of aircraft assume to be constant
Advantage:
• Light weight
• Robust
• Minimal post processing needed simple
Disadvantage:
• Low accuracy
• Calculate g’s nominal to centre of gravity of aircraft
• Difficult to account for missing data
3) Range pair counters:
Advantages:
• Cheap cost
• On-board data processing can be conducted
Disadvantages:
• Time history can be lost
• Validation of data is difficult
• Missing data is difficult to account
• Data format made difficulties in sensor calibrations
4) Multi-channel recorders:
Advantages:
• Many flight parameters can be monitored
• Time history can be retained
• Other investigations can be carried out like over- stressing
• Data from other sensors can be recorded like strain gauges
• Automation of health checks can be done
• Used to minimize damage to tailor flying operations
Disadvantages:
• Requires larger load developing program
• Questionable accuracy in loads outside of original data
• Do not account for gust loads, abrupt manoeuvres and buffet loads
• Expensive
• Intensive post processing and software
• Need data validation
5) Strain gauges: Strain gauges are very important in case of direct measurement like the bending moment at root of wing. They are also very sensitive toward the abrupt and gust loads during flights. It basically response to the change in weight during its flight that is why it is better than the electrical resistance strain gauges [34].
Advantages:
• Sensitive to gust and buffet loads
• Directly comparable to fatigue test
• High strain resolution
• Accounts for change in weight during flight
Higher reliability disadvantage:
• Difficult to find the gauge location
• Software and post processing intensive
• Gauge installation and maintenance is difficult
• Gauge requires calibration
6) Counting accelerometer: This device is used to measure and count the reading from specific acceleration level that has been crossed.
The most commonly used monitoring tool is the strain gauges are applied on the critical location of the aircraft where stresses are to be measured.
The fatigue meter alone is unable to monitor stress activities near wing root so devices that can measure strain at different locations were developed and they were capable of measuring Wing Root Bending Moment (WRBM). Strain gauges are installed near wing root to know the effects of changes in weight due to fuel burn and weapon release during flight. However, care should be taken while installing strain gauges to ensure that they:
• Could be calibrated to load that induce damage
• Are area of gradient due to low stress?
• Are insensitive to loading actions and are dominated by principle loads e.g. WRBM
• Are not prone to drifting of gauge
• Are easily accessible to replace
• Are positioned accurately and protect from environmental conditions and wear [35]
• Are directly related to stress conditions at critical stress locations
The numbers of gauges installed are restricted by number of channels available on data acquisition system. Table 4 shows that currently seven gauges are used as standard while they can be increase in future.
| Aircraft | Operator | Total | CR | IW | OW | FF | CF | RF | HTR | VTR | Other |
|---|---|---|---|---|---|---|---|---|---|---|---|
| A-3 | USN | 1 | - | 1 | - | - | - | - | - | - | - |
| AMX | Italian AF | 12 | - | 3 | 1 | 1 | 2 | 1 | 2 | 2 | - |
| AV-8B | Royal AF [5] | 16 | - | 1 | 2 | - | 6 | 2 | 3 | 1 | 1 |
| tableHawk | Royal AF | 14 [6] | - | 3 | 4 | - | 2 | - | 2 | 3 | - |
| B-1B | USAF | 5 | - | 2 | - | - | - | - | 3 | - | - |
| EF2000 | RAF | 16 | 3 | 1 | 1 | 1 | 4 | 1 | - | 1 | 4 |
| F-16 | RNLAF | 5 | - | 1 | - | - | 1 | - | 1 | 1 | 1 |
| F-16 | USAF | 1 | - | 1 | - | - | - | - | - | - | - |
| F/A-18 | USN | 7 | - | 1 | 1 | 1 | - | - | 2 | 2 | - |
| F/A-18 | RAAF | 11 | - | 1 | 1 | 1 | 3 | - | 2 | 2 | 1 |
| F/A-18 | Swiss AF | 7 | - | 1 | 1 | 1 | 1 | 1 | 1 | 1 | - |
| F-111 | RAAF | 11 | - | 6 | - | 1 | 2 | - | 1 | 1 | - |
| JAS-39 | Swiss AF | 5 | 2 | 2 | - | - | - | - | - | 1 | - |
| Tornado | German AF | 2 | - | 2 | - | - | - | - | - | - | - |
Table 4: Locations to monitor load using strain gauges.
C. Flight parameters: Today, many military aircrafts have computerized control systems that are used to relate flight parameters with control surface deflection. Together control systems and fatigue monitoring systems are integrated into mission computers. Using Flight parameter systems, loads in major load carrying members is determined using flight parameters from regression method [36]. These calculated loads are related with stresses at critical locations using transfer function (Table 5). By integrating flight parameters with IAT system, flight parameters may be used:
• In calibration of strain gauges
• In validation of strains and estimation of strain when data is corrupted
• To produce utilization statistics in aircraft
• In significant loads determination [37-39]
• To provide check in calculation of damage using strain gauges [40]
| Aircraft (Operator) | Dedicated Fatigue Meter | No. of Strain Gauge | Flight Parameter | % of Service Aircraft Fitted |
|---|---|---|---|---|
| A-3 (US Navy) | Yes | 1 | No | 100% [14] |
| Alpha jet (French AF) | Yes | 0 | No | 100% [15] |
| AMX (Italian AF) | No | 12 | Yes | 100% [16] |
| B-1B (USAF [6]) | Yes | 6 | Yes | 100% [17] |
| EF200 (Partner nations) [7] | No | Yes | Yes | TBD [18] |
| F-14 (US Navy) | No | 0 | Yes | [19] |
| F-15 (USAF) | Yes [8] | 0 | Yes | 20% [20] |
| F-16 (Royal Nedl. AF) | No | 5 | Yes | 100% [21] |
| F-16 (US AF) [9] | No | 1 | Yes | 100% [22] |
| F/A-18 (RAAF) | No | 17 [10] | Yes | 100% [23] |
| F/A-18 (US Navy) | No | 6 | Yes | 100% [24] |
| F-104 (Royal Nedl. AF) | Yes | 0 | No | 15% [25] |
| F-111 (RAAF) [11] | Yes | 11 | No | 4% [26] |
| Hawk (RAAF) | Yes | 0 | No | 100% [27] |
| JAS-39 (Swedish AF) | Yes | 5 [13] | No | 100% [28] |
| JAS-37 (Swedish AF) | Yes | 0 | No | [29] |
| MB339CB (Royal NZAF) | Yes | 8 | No | 100% [30] |
| Mirage 2000 (French AF) | Yes | 0 | Yes | 100% [31] |
| Tornado (Italian AF) | No | 0 | Yes | 100% [32] |
| Tornado (Royal AF) | Yes | No | 100% [33] | |
| Tornado (German AF) [12] | No | 2 | Yes | 10% [34-35] |
Table 5: Modern aircraft load monitoring systems during service.
For desired level of accuracy in recorded strains, sufficient synchronized parameters are required. Like, for empennage strain gauges [41], following parameters are required:
• Angle of attack, α
• Elevator deflectio, δelev
• Rudder deflection, δrud
• Trailing edge flap deflection, δTEF
• Yaw rate, r
• Pitch rate, q
• Aileron deflection, δail
D. Flight data errors: Many external factors affect recording system leading to loss of data or recording of spurious data. Various sources effecting data errors are:
• Malfunctioning of instruments, fault in sensors or some unserved errors
• Failure in recording system leading to no data recording or partial recording
• Error in downloading of data that leads to loss of complete data
• Errors in recording of data leading to data spikes
• Input errors in systems leading to excessive data
• Reasons leading to data corruption
So, to minimize the errors following precautionary measures should be taken and different parts should be checked for each parameter or their combination:
• Limit in range operational envelope
• Max. Change rate
• Excess recording of data
• Cutting of data during flight
• Data spikes
• Repetition of data
• Error in initialization
• Synchronization error between parameters
Failure analysis methods
Failure activities are investigated using many different techniques and methods which mainly includes electron microscope method, impact dynamic analysis, FEA based structural analysis methods, CFD and fracture mechanics. While some additional analysis methods include:
A. Wreckage mapping: This method provides information about possibly sequences of beak-up and also framework in which lots of individual histories of components can be inserted. Lots of time is required in tadeonal surveying methods. So, to solve this problem, a GPS- based wreckage mapping system [42] is developed that uses differential GPS to locate and plot the position of components and parts within few seconds. It is readily portable and it also has a PC and a camera that identifies the part, takes its photo, log it and record its position within few seconds. Figure 15 shows the output using this system and crash site of a helicopter is mapped in few hours. Figure 16 shows wreckage map which contains photograph of area, profile of aircraft and ground scars. By superimposing the aircraft’s outline on ground wreckage map the attitude and angle of impact is determined.
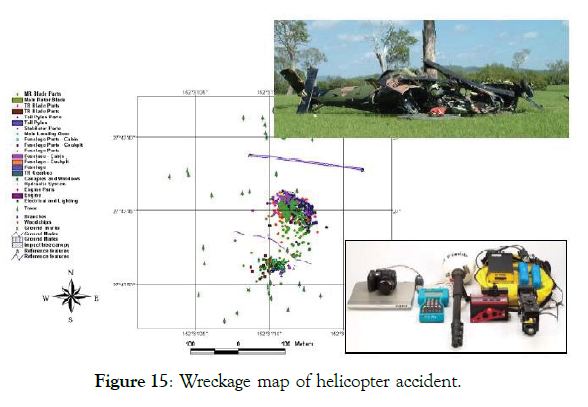
Figure 15: Wreckage map of helicopter accident.
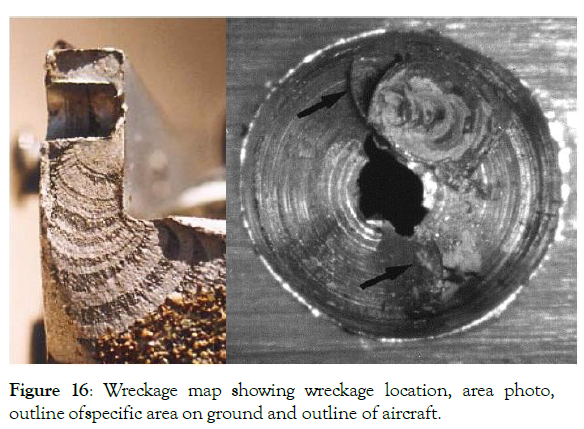
Figure 16: Wreckage map showing wreckage location, area photo, outline of specific area on ground and outline of aircraft.
B. Crack growth analysis using quantitative fractography: A significant source of component failures is fatigue cracking. By correlating load history of component [43,44] with surface markings, essential information can be obtained through postevent analysis of fractured surfaces. If enough loading history is known growth rate of crack can be determined.
Figure 17 shows failed wing spar having fracture surfaces which causes loss of aircraft [45]. Fatigue crack grows from sharp grooves of hole which is poorly drilled. By correlating surface marking from aircraft’s loading events history log plot of crack size against life is obtained which shows straight line behaviour [46]. This straight line is used to determine crack growth (Figure 18).
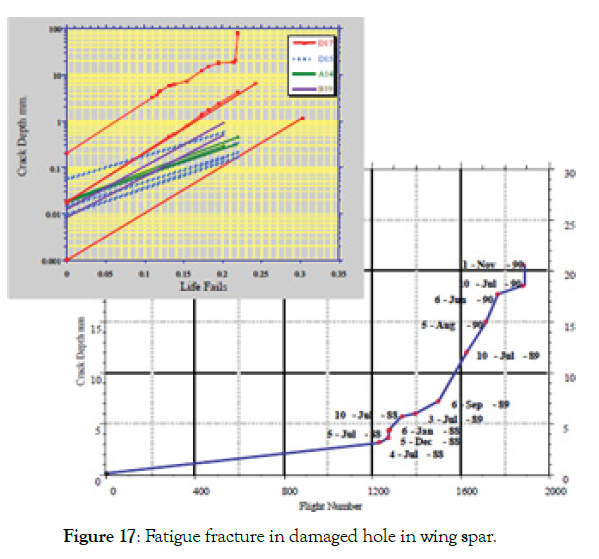
Figure 17: Fatigue fracture in damaged hole in wing spar.
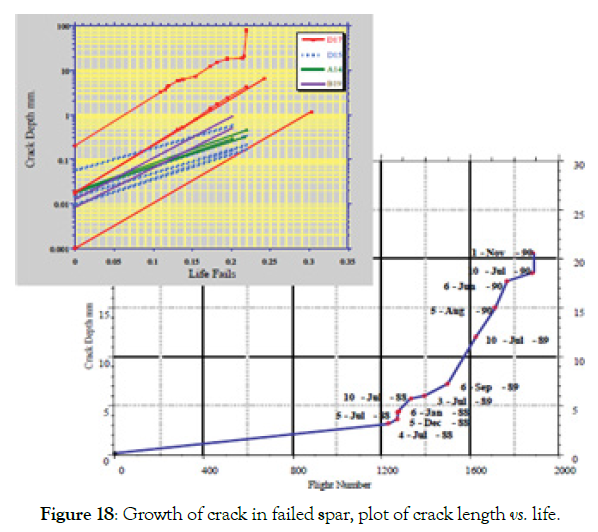
Figure 18: Growth of crack in failed spar, plot of crack length vs. life.
C. Failure analysis of composites: Failure analysis in composites is very complex and less well understood. As composites are used widely in aerospace industry so investigation of source of failure and damage needs to be done.
Figure 19 shows failure of tail rotor blades of four helicopters which has spar made of carbon-fibre composite.
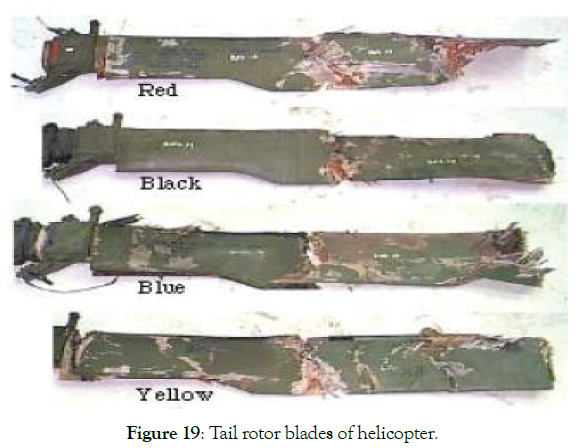
Figure 19: Tail rotor blades of helicopter.
Two helicopters collided with each other. One helicopter is reconstructed for investigation purpose and during examination, it is observed that failure surface of spar is very flat as shown in Figure 20 and it suggests that spar is cut by rotor blades of another helicopter during collision. The failure mode of composites leaves fibre sticking out of surface while in tension and in compression it leads to formation of micro-buckled band which cause fibres to suffer two types of bending failure, first one in tension in which neutral axis of spar is displaced to show small failure area and large compressive failure in flat surfaces. Hence, spar failure is due to impact of tips of rotor blade with ground as shown in Figure 21.
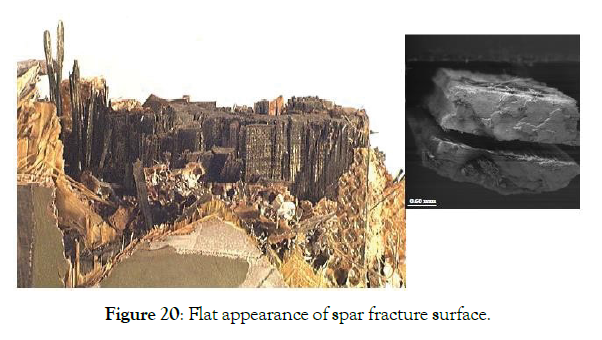
Figure 20: Flat appearance of spar fracture surface.
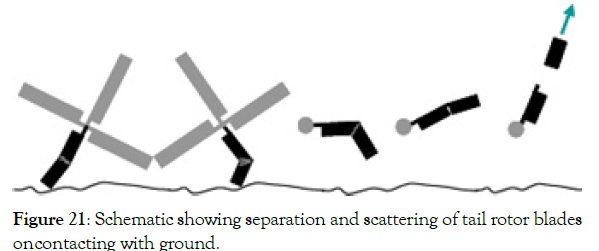
Figure 21: Schematic showing separation and scattering of tail rotor blades on contacting with ground.
D. Failure in wiring system: Failure of wiring system is quite common in aircraft. While most of failure due to wiring system is associated with chafing or connectors or short circuit. However, there are varieties of ways for short circuiting leading to fire in some conditions which causes burning of wiring system and can cause crash.
The investigation of failure and defects in aircraft structural components and parts has major role to improve the safety of aircraft. The analysis and determination of main cause of failure will enable recommendations for corrective actions to be made that will prevent any similar failure to occur in future.
Citation: Tariq U (2021) Review of Different Methods to Study and Investigate Aircraft Structure Failure under Dynamic Loading. J Aeronaut Aerospace Eng. 12:274.
Received: 01-Apr-2021 Accepted: 13-Sep-2021 Published: 20-Sep-2021 , DOI: 10.35248/2168-9792.21.10.274
Copyright: © 2021 Tariq U. This is an open access article distributed under the term of the Creative Commons Attribution License, which permits unrestricted use, distribution, and reproduction in any medium, provided the original work is properly cited.