Journal of Hematology & Thromboembolic Diseases
Open Access
ISSN: 2329-8790
ISSN: 2329-8790
Research Article - (2015) Volume 3, Issue 1
Background: Tumor-suppressor genes Tumour suppressor genes (TSG) are inactivated by methylation in several cancers including acute myeloid leukemia (AML). Transcriptional silencing of PRG2 gene could be involved in development and progression of cancers. 5-Azacytidine (5-Aza) is a DNA methyltransferase inhibitor that causes DNA de-methylation resulting in re-expression of silenced TSG. Midostaurin (PKC412) is a multitargeted tyrosine kinase inhibitor that potently inhibits FLT3 tyrosine kinase and induces hematological remission in patients with AML. However, majority of AML patients in clinical trials developed resistance to PKC412.
Methods: Resistant cells were developed by overexposure of MV4-11 cells to PKC-412 and treated with 5-Aza. Apoptosis and cytotoxicity of PKC-412 were determined using Annexin V and MTS assays, respectively. Gene expression profiling was performed using microarray followed by quantitative real-time PCR. STATs activity was examined using Western bloting and methylation of PRG2 was studied using pyrosequencing analysis.
Results: The cytotoxic dose of PKC-412 on resistant cells was significantly higher than parental and MV4-11Rpkc+5-Aza cells (p=0.003). The resistant cells showed significant higher viability and lower apoptotic cells compared to other cells (p<0.001). Expression of PRG2 was more than 300 folds higher in MV4-11R-pkc+5-Aza cells compared to parental and resistant cells (p=0.001). STAT3 was activated in resistant cells. Methylation of PRG2 gene was significantly decreased in MV4-11R-pkc+5-Aza cells.
Conclusion: The restoration of PRG2 expression induces sensitivity towards PKC-412 and an increased in cell death. Our findings suggest that PRG2 gene could play a role in the sensitivity to PKC-412 and serve as a target for treatment of AML patients resistant to PKC-412 tyrosine kinase inhibitor.
Keywords: AML; PRG2; PKC-412; FLT3-ITD; 5-Azacytidine; STAT3
Mutations in FLT3 receptor tyrosine kinase are the most frequently identified genetic event in acute myeloid leukemia (AML) that results in constitutive activation of survival and proliferation pathways including JAK/STAT, PI3K and RAS/MAPK pathways [1]. The two major activating mutations in FLT3 gene are the internal tandem duplications (ITDs) of the juxtamembrane domain [2] and the activation loop mutations of the tyrosine kinase domain [3]. Thus, tyrosine kinases such as FLT3 represent an attractive therapeutic target for cancer therapies in AML. Several FLT3 tyrosine kinase inhibitors (TKIs) are currently under investigation including PKC-412 [4]. PKC412 showed inhibitory activity against RTKIII such as KIT, FMS, PDGFR, VEGFR and FLT3 [5-7]. FLT3-ITD positive cells are more susceptible to the cytotoxic effects of TKIs than wild type cells [8]. However, majority of AML patients undergoing TKI treatment only have moderate and short-term responses [1]. In addition, leukaemic cells could develop resistance to TKI under prolonged therapy. Resistance mechanisms againsts TKIs were observed in leukaemia cells including in vitro experiments and in clinical research [6,9]. This was also demonstrated by resistance to imatinib mesylate, a TKI for the treatment of chronic myeloid leukaemia (CML). However, majority of AML patients have only moderate and transient responses to tyrosine kinase inhibitors (TKIs) [1,10,11].
PKC-412 is a tyrosine kinase inhibitor (TKI) that potentially inhibits FLT3 tyrosine kinase and induces haematological remission in patients with AML [12-15]. Several studies have shown that genomewide gene expression profiling reveal up-regulation of tumour suppressor gene p53 and MCL-1 [16] and down-regulation of SOCS1 and SOCS3 due to hypermethylation [10] in FLT3-ITD cells resistant to TKIs compared to parental cell lines. Zhou et al. used long-term coculture of human leukemia cell lines MV4-11 to FLT3 inhibitor ABT-869 to generate a resistant human cell lines.
Bone marrow, proteoglycan 2 (PRG2) is a protein-coding gene (Other names: MBP, BMPG and MBP1). It encodes MBP and MBP-1 proteins [17,18]. PRG2 was one of the three novel proteins that demonstrate up-regulation as candidate biomarkers for the diagnosis of Crohn’s disease (a type of inflammatory bowel disease) and could be a new therapeutic target [19]. In addition, PRG2 was absent in methylated cancer cells and its expression was restored by treatment with 5-aza-2’-deoxycytidine (5-Aza2dc) [20]. Overexpression of PRG2 in myeloid cells caused blocked G-CSF-dependent proliferation and increased apoptosis [17]. However, transcriptional silencing of PRG2 gene due to methylation of CpG islands was associated with induced proliferation and apoptotic inhibition in pancreatic cancer cell lines [21] These findings suggest that, PRG2 has a suppressor function.
Epigenetic silencing due to hypermethylation of CpG islands is a frequent mechanism of inactivation of tumour suppressor genes (TSG) in a variety of human cancers including AML [12]. The 5-Azacytidine (5-Aza) is a chemotherapeutic agent that induces DNA demethylation by inhibition of DNA methyltransferase (DNMT) enzymes [13,14]. The suppression of DNMTs in cell lines leads to hypomethylation resulting in inhibition of tumours formation or at least stop proliferation of tumour cells [15].
It was hypothesized that PRG2 gene functions as a TSG that loses its suppression function due to epigenetic silencing. We generated a resistant cell lines by a long term overexposure of MV4-11 to FLT3- ITD inhibitor, PKC-412 and we are the first to report that PRG2 gene restoration in the resistant cells after the treatment with 5-Aza, could induce sensitivity to PKC-412 in resistant AML cells. The methylation status of PRG2 and its expression in resistant cells were investigated before and after treatment with 5-Aza to look for the correlation between transcriptional silencing of this gene and sensitivity response to PKC-412.
Midostaurin (PKC-412)
PKC-412 was purchased from LC Laboratories (Woburn, MA, USA) and dissolved in DMSO before use. The stock preparation was 1 mM and stored at -20°C according to the manufacturer’s protocol.
Development of resistant clones: MV4-11, an AML cell line with FLT3-ITD was obtained from the Department of Haematology, Universiti Sains Malaysia (USM) originally purchased from American Type Culture Collection (ATCC). The cells were cultured with RPMI 1640 (Life Technologies, Grand Island, NY, USA) supplemented with 10% fetal bovine serum (FBS; Life Technologies, Grand Island, NY, USA) at a density of 5 X 10⁴ cells/mL in a humid incubator with 5% CO2 at 37°C. Resistant cell line to PKC-412, namely MV4-11R-pkc was developed according to the protocol as described previously [22]. Log phase growing MV4-11 cells were co-cultured at a starting dose of 20 nM PKC-412 followed by a step-wise increasing concentration of 10-20 nM for 12 months or until the cells still survive at the IC50 of PKC-412 on parental MV4-11. The resistant cell lines were grown in normal medium without PKC-412 for at least 48 hours before the start of each experiment.
5-Azacytidine treatment: 5-Azacytidine (5-Aza) (Sigma-Aldrich Corp. MO, USA) was dissolved in RPMI-1640 and the stocks at 500 μM were prepared for immediate use or stored at -20°C, to be used within 2-3 days. Resistant cells were sub-cultured in working solution (5 μM) and incubated in a humid incubator with 5% CO2 at 37°C for 4-5 days until confluent. MV4-11R-pkc+5-Aza cells were then subcultured in normal medium without treatment for at least one passage before re-treatment with PKC-412.
Growth inhibition assay: MV4-11 cells were seeded in 96-well culture plates at a density of 1 X 10⁴ viable cells/100 μL/well in triplicates, and were treated with PKC-412. Colorimetric CellTiter 96 AQueous One Solution Cell Proliferation assay (MTS assay; Promega, Madison, WI, USA) was used to determine the cytotoxicity. The IC50 values were calculated using GraphPad Prism 3.02 (San Diego, California, USA). Each experiment was in triplicate.
Apoptosis assay: Annexin V–FITC binding assay (BD Pharmingen, San Diego, CA, USA) was used as recommended by the manufacturer and analysed by flow cytometry (BD FACSCanto™, San Jose, California, USA). Analysis was performed with Diva software (FACS Diva, 6.1.2, San Jose, California, USA). Each experiment was in triplicate.
RNA extraction: Total RNA was extracted from MV4-11, MV4-11R-pkc and MV4-11R-pkc+5-Aza cells using Rneasy® Mini Kit (Qiagen, Valencia, CA, USA), the purity and concentration was measured by NanoDrop ND-1000 spectrophotometer V3.3.0 (NanoDrop Technologies, Berlin, Germany).
Gene expression profiling: The Prime ViewTM Human GeneChip Arrays were used for gene expression profiling according to the manufacturer’s protocol (Affymetrix, Santa Clara, California, USA). Briefly, first-strand cDNA was synthesized from total RNA and the cDNA was converted into a double-stranded DNA template for transcription.
Scanning and data analysis: The GeneChip arrays were scanned using GeneChip® Scanner 3000 (Affymetrix) and the analysis were performed using Agilent's GeneSpring GX software 12.1. One-way ANOVA was conducted and two-fold change used as criteria to determine the expression. The data were further analysed by Functional Annotation Tool DAVID Bioinformatics Resources 6.7, NIAID/NIH (http://david.abcc.ncifcrf.gov). Gene ontology (GO) annotations related to methylation and to carbohydrate binding including PRG2 gene were our interest in this study.
Quantitative RT-PCR: In order to validate the microarray results for PRG2 expression, Quantitative RT-PCR (RQ-PCR) was performed. High Capacity RNA-to-cDNA kit (Applied Biosystem, Foster City, California, USA) was used to synthesis cDNA according to the manufacturer’s protocol. TaqMan Gene Expression assays (Applied Biosystems) were performed on Applied Biosystem 7500 Fast Real- Time PCR System according to the manufacturer’s protocol. Glyceraldehyde-3-phosphate dehydrogenase (GAPDH) was used as internal control. ABI 7500 software v2.0.6 (Applied Biosystem) was used to perform relative quantification of 5 target genes, SHP-1, SOCS-1, SOCS-2, SOCS-3 and PRG2 using the comparative threshold cycle (Ct) method.
DNA extraction and methylation analysis: The DNA was extracted from MV4-11, MV4-11R-pkc and MV4-11R-pkc+5-Aza cells using the DNA extraction kit NucleoSpin® Tissue kit (Macherey-Nagel, Düren, Germany) following the manufacturer’s instructions. The concentration and purity of DNA were measured by NanoDrop and analysed by pyrosequencing (EpigenDx, Hopkinton, MA, USA). The assay was designed for the analysis of DNA methylation to target 4 CpG islands in the promoter region of PRG2 gene.
Statistical and bioinformatics analysis: Repeated Measure ANOVA and Kruskal Wallis tests were employed for statistical analyses. All statistical analyses were performed using the SPSS software package (Version 20, SPSS, Armonk, NY, USA) and p value <0.05 was considered as significant. The level of significance was considered at p value <0.017 in Multiple Mann-Whitney Test with Bonferruni correction. Agilent's GeneSpring GX software 12.1 was used for microarray results analysis. One way ANOVA test was applied and a minimum 2 fold change was used as criteria to determine the expression. Further analysis was performed using DAVID Functional Annotation Bioinformatics Microarray Analysis 6.7, NIAID/NIH. The modified Fisher Exact P-value was generated from DAVID Functional Annotation Bioinformatics Microarray Analysis and the adjusted pvalue ≤ 0.1 was considered as significant.
Long-term co-cultured of MV4-11 cells with low doses of PKC-412 resulted in resistant clones
In order to verify the resistance of MV4-11R-pkc cells to PKC-412, we investigated the cytotoxicity of PKC-412 and apoptosis on MV4-11R-pkc and parental MV4-11 cells. MV4-11 cells were inhibited by 350 nM PKC-412 whereas the resistant MV4-11R-pkc cells were only inhibited by higher dose. The IC50 of PKC-412 on MV4-11R-pkc was approximately 10-fold higher than that on MV4-11 (P=0.006) (Figure 1). There was a significant decrease in the percentage of apoptotic cells in MV4-11R-pkc compared to parental MV4-11 based on incubation of parental and resistant cells in serial concentrations of PKC-412 (p=<0.001) (Figure 2).
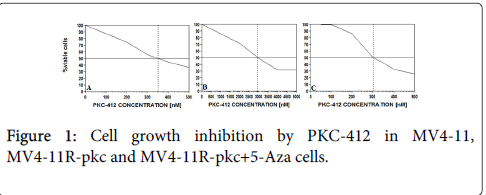
Figure 1: Cell growth inhibition by PKC-412 in MV4-11, MV4-11R-pkc and MV4-11R-pkc+5-Aza cells.
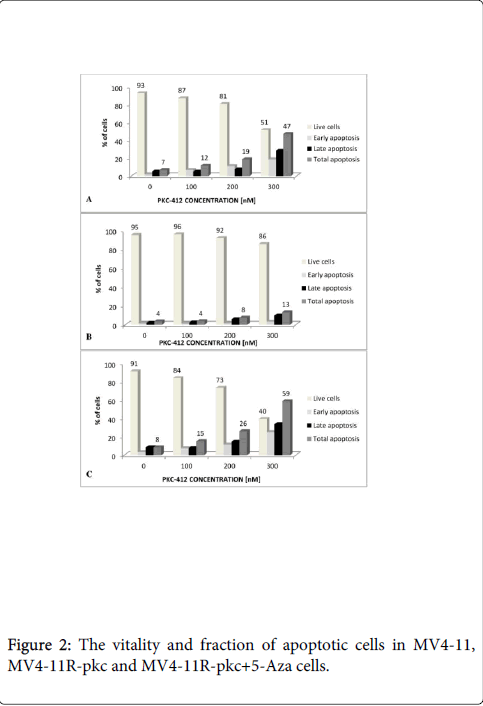
Figure 2: The vitality and fraction of apoptotic cells in MV4-11, MV4-11R-pkc and MV4-11R-pkc+5-Aza cells.
(A) MV4-11 (IC50=350 nM), (B) MV4-11R-pkc (IC50=2950 nM) and (C) MV4-11R-pkc+5-Aza cells (IC50=300 nM) exposed to serial concentrations of PKC-412 for 72 hours, were quantified by cell proliferation assay. Each result is presented as the median percentage of proliferation to unexposed control cultures.
Apoptotic cells increased significantly in (A) MV4-11 and (C) MV4-11R-pkc+5-Aza cells compared to (B) MV4-11R-pkc cells after addition of PKC-412 with increasing concentrations. There was a reduction of cell viability from 90% down to 50 and 40% in MV4-11 and MV4-11R-pkc+5-Aza cells respectively, in contrast only 20% reduction in the resistant cell line MV4-11R-pkc (p < 0.007).
Higher sensitivity to PKC-412 in MV4-11R-pkc treated with 5-Aza
The MTS results showed that the IC50 of PKC-412 on MV4-11Rpkc+ 5-Aza was decreased compared to that on non-treated cells (p=0.014) (Figure 1). The IC50 on MV4-11R-pkc+5-Aza was lower than parental MV4-11 cells, however there was no significant difference (p=0.099).
Induction of apoptosis in MV4-11 and MV4-11R-pkc+5-Aza in response to PKC-412
The vitality and fraction of apoptotic and necrotic cells of MV4-11, MV4-11R-pkc and MV4-11R-pkc+5-Aza cells after various incubations with PKC-412 is shown in Figure 2. Upon incubation of cells in the presence of 300 nM PKC-412, a significant reduction of cell viability of 90% down to 50 and 40% was detected in MV4-11 and MV4-11R-pkc+5-Aza cells, respectively in association with 50 and 60% apoptotic cells. In contrast, the resistant cell line MV4-11R-pkc shown only 13% apoptotic cells, with still showing 86% viable cells (p=0.024) (Figure 2). Figure 3 depicts the course of apoptotic (Q2 and Q4) and necrotic (Q1) cells over 72h measured by Annexin V/FITCFACS analysis in MV4-11 and MV4-11R-pkc and MV4-11R-pkc+5- Aza cells after addition of 100, 200 and 300 nM of PKC-412. The resistant cells showed a significant increase in the viability with obvious decreased in apoptotic cells after the incubations compared to the parental and MV4-11R-pkc+5-Aza cell lines. Figure 4 showed that despite the mean percentage of apoptotic cells before incubations with PKC-412 were almost equal for MV4-11, MV4-11R-pkc and MV4-11R-pkc+5-Aza cells, there was a sharp increase in MV4-11 and MV4-11R-pkc+5-Aza cells with an increase in concentrations (100, 200 and 300 nM) to reach 50 and 60% apoptosis, respectively at 300 nM. In contrast, there was no significant increase in the apoptotic cells in MV4-11R-pkc with an increase in concentrations to reach only 13% apoptosis at 300 nM (p<0.001).
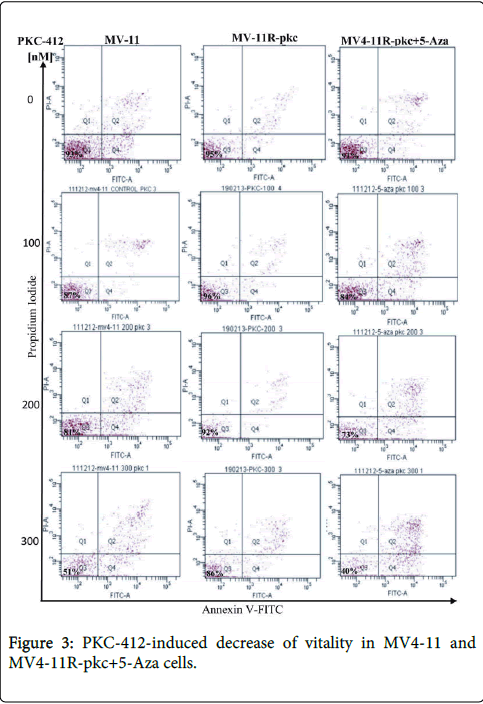
Figure 3: PKC-412-induced decrease of vitality in MV4-11 and MV4-11R-pkc+5-Aza cells.
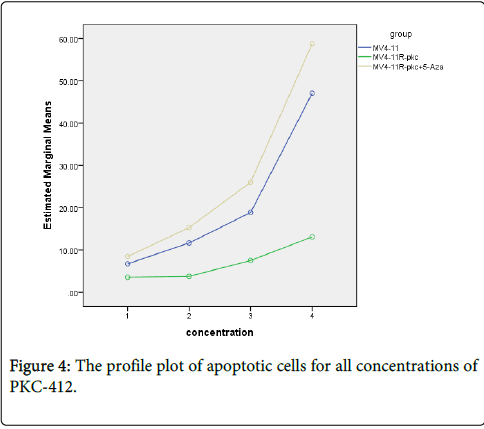
Figure 4: The profile plot of apoptotic cells for all concentrations of PKC-412.
Flow cytometric scatterplots of MV4-11RpkcMV4-11R-pkc+5-Aza cells after addition of various concentrations of PKC-412 at 72 hours. The data depict the course of apoptotic (Q2 and Q4), life (Q3) and necrotic (Q1) cells. decrease of vitality is concentration-dependent and decreased in MV4-11Rpkc compared to MV4-11R-pkc+5-Aza cells.
Repeated measure ANOVA between groups based on concentrations was applied. The profile plot shows the adjusted mean (estimated marginal means) of apoptotic cells for all concentrations of PKC-412 (0, 100, 200 and 300 nM). Despite the mean percentages of apoptotic cells before treatment with PKC-412 were almost equal for parental, resistant and MV4-11R-pkc+5-Aza cells, there was clearly increased in the percentages of apoptotic cells in parental and MV4-11R-pkc+5-Aza cells by increasing concentration of PKC-412 (50 and 60%, respectively at 300 nM). In contrast, the increased in resistant cells was only 10% at 300 nM PKC-412 (p<0.001).
Activated STAT3 in resistant acute myeloid leukaemia cells
The activation status of STAT1, STAT3 and STAT5 proteins were studied using Western blot. Although these proteins were expressed in all cell lines, only STAT3 was activated in the resistant cells compared to their parental and MV4-11R-pkc+5-Aza cells. However, there was no differences in the activity of STAT1 and STAT5 between resistant and parental or MV4-11R-pkc+5-Aza cells (Figure 5).
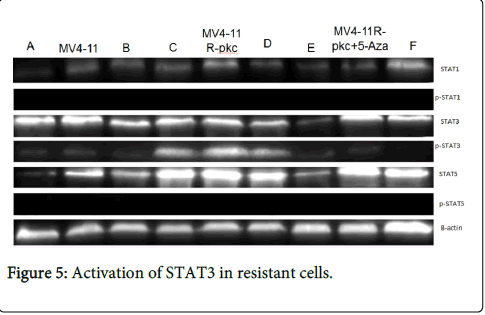
Figure 5: Activation of STAT3 in resistant cells.
The phosphorylation (activation) status of STAT1, STAT3 and STAT5 in parental, resistant and MV4-11R-pkc+5-Aza cells was assessed by Western blotting. STAT3 was phosphorylated in resistant cells but not in parental and MV4-11R-pkc+5-Aza cells.
Inhibition of DNA methyltransferase by 5-Aza results in restoration of PRG2 gene expression in MV4-11R-pkc+5-Aza cells
To speculate the possible correlation of re-expression of PRG2 and induction of sensitivity response to PKC-412 in MV4-11R-pkc+5-Aza cells, gene expression profile using microarray followed by RQ-PCR were performed. Microarray results revealed down-regulation of DNMT3α and DNMT3β in MV4-11R-pkc+5-Aza cells with a significant up-regulation of PRG2 gene (Table 1). The expression of PRG2 was confirmed by RQ-PCR which showed up-regulated PRG2 in MV4-11R-pkc+5-Aza cells with the highest fold change (p=0.001) (Figure 6).
| Sample ID | CpG -6 | CpG -5 | CpG -4 | CpG-3 | Mean | Min | Max |
| MV4-11 | 50.8 | 46 | 45.1 | 43.5 | 46.3 | 43.5 | 50.8 |
| MV4-11R-pkc | 58.5 | 34.5 | 48 | 46.5 | 46.9 | 34.5 | 58.5 |
| MV4-11R-pkc+5-Aza | 4.7 | 2.7 | 11.7 | 14.4 | 8.4 | 2.7 | 14.4 |
| Low Meth Control | 2.3 | 2.6 | 1.2 | 1.3 | 1.9 | 1.2 | 2.6 |
| Med Meth Control | 46.8 | 39.5 | 25.8 | 26.7 | 34.7 | 25.8 | 46.8 |
| High Meth Control | 96.7 | 85.3 | 49.3 | 50.4 | 70.4 | 49.3 | 96.7 |
Table 1: Percentage of methylation of CpG islands in the promoter region of PRG2 gene.
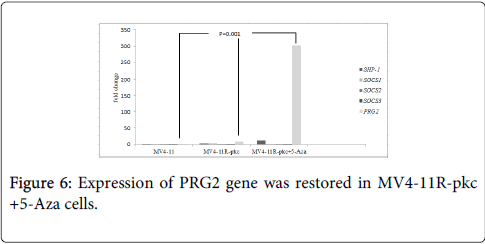
Figure 6: Expression of PRG2 gene was restored in MV4-11R-pkc +5-Aza cells.
Real-time quantitative PCR (RQ-PCR). The relative normalized ratio reveals the PRG2 re-expression with the highest fold changes (>300) in MV4-11R-pkc+5-Aza cells in comparison to that in MV4-11 and MV4-11R-pkc cells (p<0.001).
Pyroseqencing analysis showing methylation levels of each CpG islands in the two designed assays for PRG2 gene. Higher methylation of CpG islands in the promoter region of PRG2 gene of DNA of MV4-11 and MV4-11R-pkc compared to low methylation in MV4-11R-pkc+5-Aza cells, by EpigenDx, Hopkinton, MA, USA.
Low methylation of PRG2 gene in MV4-11R-pkc+5-Aza cells
To relate the expression of PRG2 with methylation status, pyrosequencing analysis was performed on DNA from all three cell lines. The results revealed a significant lower percentage of methylation in all four CpG islands in the promoter region of PRG2 gene when treated with 5-Aza compared to untreated MV4-11 and MV4-11R-pkc cells (p=0.023). However, there was no significant difference in methylation of CpG islands in the promoter region of PRG2 in MV4-11 cells compared to MV4-11R-pkc cells (p>0.95) (Table 2 and Figure 7).
| Gene Symbol | Regulation | Fold change | |
| 1788 | DNMT3a | down-regulation | 2.35 |
| 1789 | DNMT3b | down-regulation | 23.29 |
| 5553 | PRG2 | up-regulation | 114.55 |
Table 2: Down-regulation of DNMTs and up-regulation of PRG2 in MV4-11R-pkc+5-Aza cells.
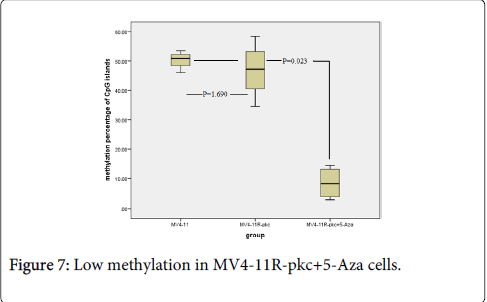
Figure 7: Low methylation in MV4-11R-pkc+5-Aza cells.
Kruskal Wllis Test was applied followed by Multiple Mann- Whitney Test with Bonferruni correction. MV4-11R-pkc+5-Aza cells shown a significant lower methylation of CpG islands in the promoter region of PRG2 genes compared to that in parental and resistant cells (p=0.023). However, there was no significant difference in the methylation levels of CpG islands in promoter region of PRG2 genes between parental and resistant cells (p>0.95).
Microarray results revealed a significant down-regulation of DNMT3α and DNMT3β (p<0.001) and a significant up-regulation of PRG2 gene (p=0.003).
The mechanism of the acquired resistance to TKIs has been studied in vitro and in vivo [10,16,23-26]. However, these resistant mechanisms still not fully understood and the acquired resistance to TKIs remains the challenge in the treatment of AML patients. Transcriptional silencing of TSG due to DNA methylation has been documented in various cancers including haematological malignancies in both lymphoid and myeloid [12].
We have developed cells that are resistant to PKC-412 by overexposure of the drug to parental cells. The acquired resistance was confirmed by cytotoxicity and apoptosis assays that shown significant difference on parental and resistant cells. The IC50 of PKC-412 on MV-11R-pkc was 10 folds higher compared to that of parental MV4-11 cells (p=0.006) and the acquired resistance associated with low apoptosis (p<0.001). This is in agreement to that reported previously on development of resistant cell lines to ABT-869 and PKC-412 [10,16].
The results of this study revealed transcriptional silencing of PRG2 gene due to hyermethylation of CpG islands in the promoter region of this gene in MV4-11 and MV4-11R-pkc cells. Our findings were similar to previous report that confirmed the absence of PRG2 in cancer cell lines due to epigenetic silencing in pancreatic cancer [20]. Aberrant methylation of TSG such as SOCS-1, SOCS-3 and SHP-1 has been documented in variety of cancers including haematological malignancies [12,27-32]. However, PRG2 gene is poorly described, but was shown to be silenced due to hypermethylation of CpG islands in the promoter region of the gene in pancreatic cancer cells [21].
Low expressions of PRG2 gene in parental and resistant leukaemic cells were due to hypermethylation of CpG islands in the promoter region. Furthermore, the transcriptional silencing of PRG2 gene was associated with STAT3 activation that results in induction of cells proliferation and reduction of apoptosis. These findings are supported by previous report on pancreatic cancer cells in which transcriptional silencing of PRG2 gene induces cell proliferation and inhibits apoptosis [21]. These findings suggest PRG2 gene functions as a TSG and could play an important role in acquisition of resistance.
The activation of STAT3 was associated with poor prognosis in several cancer cells such as AML [33], osteosarcoma [34], gastric cancer [35] and NSCLC [36]. In addition, constitutive activation of STAT3 and STAT5 are common events in myeloid leukaemia and involved in resistance to TKIs [10,33,37]. Bewry, Nair [38] suggested that, the activation of STAT3 is an important mechanism of imatinib resistance. In the present study, we assessed the activation of STAT1, STAT3 and STAT5 in resistant MV4-11R-pkc cells before and after treatment with 5-Aza as well as in parental MV4-11 cells. The results revealed activation of STAT3 in MV4-11R-pkc cells but not in MV4-11 cells. The findings suggest that, the activated STAT3 could be involved in the acquisition of resistance to PKC-412 in MV4-11R-pkc cells which is consistant with previous reports on the activation of STAT3 that associated with acquired resistance to ABT-869 in AML [10] and imatinib in CML cells [38,39]. However, after MV4-11R-pkc was treated with 5-Aza, STAT3 was inactivated with higher sensitivity to PKC-412. This was in accordance with other reports [10,39,40]. Our data suggest crucial roles of STAT3 in the resistance development and the inhibition of STAT3 phosphorylation confer sensitivity to TKIs.
The inhibition of DNMT1 and DNMT3b by 5-Aza2dc results in reexpression of TSG and is associated with higher apoptosis and lower proliferation in several cancers [41-46]. Our results showed a significant down-regulation of DNMT3α and DNMT3β (p<0.001) in MV4-11R-pkc+5-Aza cells compared to MV4-11R-pkc. The suppression of DNMTs by 5-Aza was associated with significantly lower methylation levels of PRG2 (p=0.021). Our finding was in accordance to results reported in pancreatic cancer [21]. Interestingly, the hypomethylation was associated with marked re-expression of PRG2 genes in MV4-11R-pkc+5-Aza cells with the highest fold change. RQ-PCR confirmed higher expression of PRG2 in MV4-11Rpkc+ 5-Aza cells compared to parental and resistant cells (p<0.001). These findings were similar to that reported previously by Hagihara, Miyamoto [21]. in which 13 genes including PRG2 were silenced due to methylation in pancreatic cancer cells and re-expressed by hypomethylation after treatment with 5-Aza2dc.
Re-expression of TSG such as SHP-1, SOCS-1, SOCS-2 and SOCS-3 by 5-Aza or 5-Aza2dc results in down–regulation of activated STAT3 [10,39,40,47,48] and consequently confer sensitivity to TKIs. Overexpression of PRG2 was associated with inhibition of cells proliferation and higher apoptosis in response to G-CSF [17]. Likewise, the results of our study revealed re-expressions of PRG2 gene that associated with inactivation of STAT3 in MV4-11R-pkc+5- Aza cells with higher sensitivity to PKC-412. The sensitivity to PKC-412 was verified by detection of cytotoxicity on MV4-11R-pkc +5-Aza cells compared to resistant cells. The IC50 of PKC-412 was significantly decreased from 2950 nM on MV4-11R-pkc cells to 300 nM on MV4-11R-pkc+5-Aza cells (p=0.014). Moreover, The results of the present study also demonstrated a significant increase of apoptotic cells in MV4-11R-pkc+5-Aza cells by increasing PKC-412 concentration compared to slightly increased in resistant cells (p<0.001). These finding suggest that, the re-expression of PRG2 gene is associated with suppression of STAT3 activity and induction of apoptosis.
Thus, the results of this study demonstrated silencing of PRG2 gene in leukaemic cells (resistant and non-resistant) is due to DNA hypermethylation. The role of PRG2 in cancers is poorly described and to our knowledge, this is the first paper that reports PRG2 gene functions as a TSG and reactivation of this gene by 5-Aza could play a crucial role in the induction of sensitivity to PKC-412 and it could be a novel therapeutic target for patients with leukaemia
This work was supported by a research university’s grant (1001/ PPSP/813050) from Universiti Sains Malaysia to MFJ. We thank all staffs at Central Research Laboratory and Molecular Haematology Laboratory, School of Medical Sciences and Craniofacial Laboratory, School of Dental Sciences, Universiti Sains Malaysia who provided laboratory supports.