Anesthesia & Clinical Research
Open Access
ISSN: 2155-6148
ISSN: 2155-6148
Research Article - (2016) Volume 7, Issue 3
Objective: Changes in stroke volume after fluid bolus infusion (i.e., fluid responsiveness) during major abdominal surgery is affected by painful stimuli, anesthetics and inconsistent increases in cardiac preload following each round of fluid infusion. This study aimed to assess the relationship between stroke volume variation (SVV) and stroke volume during major abdominal surgery using arterial pulse contour analysis by removing data of stroke volume affected by these factors. Methods: Eighty-three patients who underwent major abdominal surgery received 8 ml/kg boluses of either Ringer’s acetate or 6% hydroxyethyl starch 70/0.5 solution over the course of 30 minutes. Stroke volume index (SVI) and SVV were obtained using the FloTracTM/VigileoTM system (Version 3.02). Patients were classified according to values of absolute changes of SVV (ΔSVV, %) and relative changes of SVI (ΔSVI, %) following fluid bolus infusion. For each patient, ΔSVI was linearly regressed against SVV at different time points during the 60 minute period after initiation of bolus infusion. The relationship between SVV and ΔSVI was examined using the angle (radian) of the slope of ΔSVI against SVV. Results: Following fluid bolus infusion, SVI increased in 43% of patients due to an increase in cardiac preload (i.e., SVV decrease), and 33% of patients showed false SVI responses (ΔSVV<0 and ΔSVI ≤ 0, ΔSVV ≥ 0 and ΔSVI>0). Angle values for SVV-ΔSVI in 50 patients were consistent in the SVV range of 9%-20% (i.e., 1.2); a 4% decrease in SVV resulted in a 10% increase in SVI. Conclusions: One-third of patients undergoing major abdominal surgery showed false responses for SVI following fluid bolus infusion. After excluding false responses for SVI, the relationship between SVV and ΔSVI during major abdominal surgery was almost linear in the SVV range of 9%-20%, suggesting that SVV changes following fluid bolus infusion significantly contribute to fluid responsiveness.
Keywords: Stroke volume; Surgical procedure; Abdominal; Fluid therapy; Hypovolemia; Pain; Anesthetics
During major abdominal surgery, adequate fluid administration is essential for preventing a significant drop in blood pressure due to hypovolemia. Goal-directed fluid therapy according to fluid responsiveness (i.e., increase in stroke volume or cardiac output following fluid bolus infusion above a certain level) enables the stabilization of intraoperative hemodynamics and improvement of postoperative outcomes following major abdominal surgery [1-3].
In fluid therapy, fluid volume loading is typically repeated until fluid responsiveness is no longer observed, assuming the heart is on the steep portion of the Frank-Starling curve while fluid responsiveness is observed [4,5]. However, this strategy faces application problems in daily clinical practice [6]. Adrenergic responses to painful stimuli may change the Frank-Starling curve by increasing cardiac contractility and may increase cardiac preload by increasing venous return as a result of venoconstriction, and administration of anesthetics may act vice versa [7,8]. Moreover, increases in cardiac preload following fluid infusion may not be consistent for each round of fluid infusion. Fluid bolus infusion increases mean systemic filling pressure through intravascular volume expansion, thus increasing venous return [7,8]. However, the degree of intravascular volume expansion is context-sensitive [9] as demonstrated by a larger plasma volume expansion following fluid infusion in the hypovolemic state compared to the normovolemic state [10-12].
Arterial pulse contour analysis allows for the continuous evaluation of stroke volume and stroke volume variation (SVV), which reflects cardiac preload [13]. Given that this analysis allows tracking trends of stroke volume index (SVI) against SVV (Figure 1), these shortcomings can be overcome by serially analyzing changes in cardiac preload and stroke volume following fluid infusion in a quantitative manner.

Figure 1: Representative recording of tracking trends of stroke volume index (SVI) against stroke volume variation (SVV) during the 60 minute period after initiation of bolus infusion. Hydroxyethyl starch solution (8 ml/kg) was intravenously infused over 30 minutes in the patient undergoing major abdominal surgery. Data of SVI and SVV were obtained every 20 seconds using the FloTracTM/VigileoTM system. Blue, red, and green symbols denote data points at 0 min, 30 min (i.e., end of bolus infusion), and 60 min after the initiation of bolus infusion, respectively.
The present study aimed to test the hypothesis that removal of SVI data that may be affected by painful stimuli and anesthetics from tracking trends of SVI in arterial pulse contour analysis provides “true” relationship between SVV and SVI following fluid infusion during major abdominal surgery. This relationship could help predict changes in stroke volume following different degrees of SVV change during major abdominal surgery.
This pilot observational study was approved by the Ethics Review Board of Hyogo College of Medicine. Written informed consent was obtained from each patient after the nature of the study was explained. In total, 85 consecutive patients (age range, 20-80 years) were enrolled, all of whom were scheduled for elective liver resection or pancreaticoduodenectomy for cancer. Exclusion criteria included cardiac arrhythmia, severe pulmonary disease, and severe renal dysfunction.
Patients received fluid bolus infusions of either Ringer’s acetate (RA) solution or 6% hydroxyethyl starch (HES) solution (HES 70/0.5; Salinhes®, Fresenius-Kabi Japan, Tokyo, Japan) during surgery.
Procedure
On arrival to the operating room, RA solution was intravenously infused at a rate of 2 ml/kg/h. After tracheal intubation, anesthesia was maintained using sevoflurane (end-tidal concentration, 1-2%) and oxygen in air (inspired O2 fraction, 0.4), along with continuous infusion of remifentanil (0.1-0.3 μg/kg/min) with a bispectral index of 40-60. Mechanical ventilation was performed with the following settings: positive end-expiratory pressure (PEEP) of 5 cm H2O and tidal volume of 8 ml/kg. Hypotension (i.e., systolic arterial blood pressure <75 mm Hg) was treated by intravenous administration of ephedrine (in increments of 4 mg) if the patient’s heart rate (HR) was <90 beats/min, and phenylephrine (in increments of 0.1 mg) if patient’s HR was >90 beats/min.
Fluid therapy
The rate of RA infusion was increased to 6 ml/kg/h (i.e., basal fluid infusion) at the time of skin incision. When patient hemodynamics (i.e., blood pressure and HR) had stabilized after peritoneal opening (e.g., 20-60 min after skin incision), basal fluid infusion of RA solution was discontinued and then patients received 8 ml/kg fluid boluses of intravenous RA solution or 6% HES solution over 30 minutes (i.e., 16 ml/kg/h). After bolus infusion, RA infusion was restarted at basal infusion rates (i.e., 6 ml/kg/h). Patients who received vasopressors during the 60 minute period after initiation of bolus infusion (i.e., the study period) were excluded from analysis.
Hemodynamic monitoring
Catheters were inserted into radial arteries and connected to the FloTracTM/VigileoTM system (Version 3.02, Edwards Lifesciences, Irvine, CA, USA) to obtain dynamic indices including SVV, SVI, and cardiac index. Mean arterial blood pressure (MAP) and HR were recorded during the study period, and the values of dynamic indices were recorded every 20 seconds during the study period.
Data analysis
Values for hemodynamic variables were obtained immediately before, and at the end of, fluid bolus infusion. Blood samples were obtained from arterial catheters to measure blood hemoglobin concentrations before and after fluid bolus infusion.
To remove outlier values of dynamic indices, original values of dynamic indices were smoothed as a function of time by a robust locally weighted regression procedure [14] (LOWESS, 20 points in smoothing window [increments of 5 seconds]) using GraphPad Prism 5 (GraphPad Software, San Diego, CA, USA). Consequently, smoothed values of dynamic indices were used for analyses throughout the study.
Absolute changes in SVV (ΔSVV, i.e., SVV after fluid bolus infusion minus SVV before fluid bolus infusion) and relative changes in SVI (ΔSVI, in percentage) after fluid bolus infusion were calculated, with values obtained before fluid bolus infusion serving as the baseline for comparison.
Patient classification by ΔSVV and ΔSVI following fluid bolus infusion
Patients were classified into four groups according to values of ΔSVV and ΔSVI following fluid bolus infusion: Group 1 (ΔSVV<0 and ΔSVI>0); Group 2 (ΔSVV<0 and ΔSVI ≤ 0); Group 3 (ΔSVV ≥ 0 and ΔSVI ≤ 0); and Group 4 (ΔSVV ≥ 0 and ΔSVI>0).
Evaluation of SVI slope against SVV change
After original values of dynamic indices were subjected to the LOWESS procedure, data sets of (SVV, SVI) at ith time points (i.e., [SVVi, SVIi], i = 1, 2, …., 723) were defined, where i=1 denotes the time of start of fluid infusion and i=723 denotes 60 min after the start of fluid infusion. From all data sets of (SVV, SVI), false-response data sets of SVV and SVI (i.e., SVV increase and SVI increase, or SVV decrease and SVI decrease) were removed according to the procedures described in the Appendix.
For the rest of data sets of (SVV, SVI) (i.e., true-response data sets of [SVVi, SVIi]), ΔSVIi was defined as (SVIi/SVI1-1) (i.e., SVI1 denotes the SVI value obtained before fluid bolus infusion). The scatterplot of (SVVi, ΔSVIi) provided clusters of serial data sets of (SVV, ΔSVI).
Because SVV in the range of < 9% was not linearly correlated with left ventricular end-diastolic volume (LVEDV) obtained during acute normovolemic hemodilution in a previous clinical study [15] (and as described in the Appendix), data sets for which SVV were between 9% and 20% were used in the analysis. For serial data sets of (SVV, ΔSVI), ΔSVI data were analyzed using a linear regression model, with SVV as an independent variable. Obtained slope values of ΔSVI against SVV were converted to angles (θ: arctan [slope], radian).
For comparison, θ values were obtained during acute normovolemic hemodilution [15], after fluid bolus infusion [16-21], and after wholebody tilting [22] obtained from previous studies in the literature. In those studies, θ values were arctan [ΔSVI/ΔSVV], where ΔSVV is the absolute change in SVV (i.e., SVV after intervention minus SVV before intervention) and ΔSVI is the relative change in SVI (percentage) after intervention, with values obtained before intervention serving as the baseline for comparison. In cases values of SVI were not available from the literature, ΔSVI was replaced by the relative change in stroke volume [15,22], and SVI was calculated as cardiac index divided by HR [17,19,21].
Median θ values with interquartile ranges were obtained at each SVV (increments of 0.1) for all patients in the present study and those in the literature.
Evaluation of the relationship between SVV and ΔSVI
The curve representing the relationship between SVV and ΔSVI for all patients was obtained assuming that SVI is 100% at an SVV of 9%, as follows:
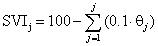
Where SVIj and θj is the jth value of SVI and θ (median values with interquartile ranges) at each SVVj (j=1, 2,…., 111, i.e., SVV1=9%, SVV2 =9.1%,…….., SVV111 = 20%), respectively.
Changes in SVI relative to baseline SVI (percentage) as a function of SVV were obtained from curves derived from median θ values.
Statistical analysis
Data are expressed as either mean ± standard deviation (SD) or median (interquartile range) depending on distribution. Hemodynamic variables and blood hemoglobin concentrations were compared between before and after fluid bolus infusion with the paired t-test or the rank-sum test.
SVV values before fluid bolus infusion were compared between patients with decreased SVV after fluid bolus infusion (i.e., Group 1 and Group 2) and those for whom SVV did not decrease after fluid bolus infusion (i.e., Group 3 and Group 4) with the unpaired t-test or the rank-sum test. We also compared SVV values before fluid bolus infusion between patients with increased SVI after fluid bolus infusion (i.e., Group 1 and Group 4) and those for whom SVI did not increase after fluid bolus infusion (i.e., Group 2 and Group 3) with the unpaired t-test or the rank-sum test.
Sigma Plot 13 (Systat Software, Chicago, IL, USA) was used for statistical analysis. P<0.05 was considered statistically significant.
Patient characteristics
Two patients were excluded from analysis due to the occurrence of mesenteric traction syndrome and incorrect following of the protocol; the remaining 83 patients (RA: n=41; HES: n=42) were enrolled (Table 1). No patients received vasopressors during the study period.
| Variable | n=83 |
|---|---|
| Gender (M/F) | 61/22 |
| Age (yrs) | 68 ± 8 |
| Weight (kg) | 59 ±11 |
| Body mass index (kg/m2) | 22.4 ±3.3 |
| Liver resection/pancreaticoduodenectomy | 71/12 |
| Urine volume (ml/kg)a | 0.6(0.3-1.0) |
| Blood loss (ml/kg)a | 0.9 ±0.6 |
| Data are presented as mean ± standard deviation, median (interquartile range), and number. aDuring the study period (i.e., 60-minute period after initiation of bolus infusion) |
|
Table 1: Patient characteristics.
Hemodynamic parameters before and after fluid bolus infusion
SVV values before fluid bolus infusion ranged from 3.8% to 21.4%. After fluid bolus infusion, MAP, SVI, and cardiac index significantly increased, while HR, SVV, and blood hemoglobin concentration significantly decreased compared to values before fluid bolus infusion (Table 2).
| Variable (n=83) | Before | After | P-Value |
|---|---|---|---|
| MAP (mm Hg) | 67 ± 12 | 76 ± 12 | <0.001 |
| Heart rate (beats/min) | 75 ± 13 | 72 ± 10 | 0.015 |
| SVI (ml/m2) | 40 (37-48) | 42 (37-50) | 0.015 |
| Cardiac index (l/min/m2) | 2.6 (2.5-3.0) | 2.9 (2.6-3.8) | <0.001 |
| SVV (%) | 8.0 (6.5-10.9) | 7.1 (5.7-9.4) | 0.015 |
| Hemoglobin (g/dl) | 11.1 ± 1.6 | 10.5 ± 1.5 | <0.001 |
| MAP: mean arterial blood pressure, SVI: stroke volume index, SVV: stroke volume variation. Data are presented as mean ± standard deviation and median (interquartile range). |
|||
Table 2: Comparison of hemodynamic variables before and after bolus infusion of Ringer’s acetate or hydroxyethyl starch solution.
Patient classification by ΔSVV and ΔSVI after fluid bolus infusion
According to values of ΔSVV and ΔSVI after fluid bolus infusion, 36, 17, 19, and 11 patients were classified into Group 1, Group 2, Group 3, and Group 4, respectively (Figure 2). Thus, 43% of patients (i.e., Group 1) showed an increase in SVI in response to a decrease in SVV after fluid bolus infusion.

Figure 2: Patient classification by absolute changes in stroke volume variation after fluid bolus infusion compared to values obtained before fluid bolus infusion (ΔSVV) and relative changes in stroke volume index after fluid bolus infusion compared to values obtained before fluid bolus infusion (ΔSVI) (n=83).The number in parentheses denotes the patient population in each group.
SVV values before fluid bolus infusion for patients classified into Group 1 and Group 2 were large compared to those in patients classified into Group 3 and Group 4 (8.8% [7.1%-11.2%] vs. 7.1% [5.3%-8.9%], P=0.007). There were no differences in SVV values before fluid bolus infusion between patients classified into Group 1 and Group 4 and those classified into Group 2 and Group 3 (7.4% [6.3%-10.9%] vs. 8.4% [6.9%-11.6%], P=0.36).
Evaluation of SVI slope against SVV change
Figure 3a is a demographic graph showing the procedure for evaluating SVI slope against SVV change. After removing falseresponse data sets for SVV and SVI (Figure 3b), the linear regression model provided a θ value of 1.19 for the scatterplot of ΔSVI against SVV in the SVV range of 9%-13% (r2=0.84, Figure 3c).

Figure 3: Evaluation of stroke volume index (SVI) slope against stroke volume variation (SVV) change. (a) Original scatterplots of SVV and stroke volume index against time. Blue and red lines denote smoothed data after the LOWESS procedure. Time = 0 denotes the initiation of bolus infusion of hydroxyethyl starch (HES) solution. (b) Scatterplots of SVV and SVI against time after removal of false-response data sets of SVV and SVI. Time = 0 denotes the time bolus infusion was initiated. (c) Scatterplots of change in SVI relative to pre-bolus SVI (ΔSVI) against SVV. Red open circles denote adopted data points with the linear regression line (blue line) and angle (θ). Gray open circles were removed from the linear regression analysis because of outlier points and an SVV <9% (shaded area). The patient is same as that in Figure 1.
Thirty-three patients were excluded from the analysis due to a lack of suitable linear portions of data points for (SVV, ΔSVI). The scatterplot of θ against SVV showed that median values of θ were almost consistent in the SVV range of 9%-20% (i.e., 1.2, Figure 4a). The θ values of angles were consistent with those from the literature, with the exception of smaller values in the SVV range of 13%–17% (Figure 4b).

Figure 4: Scatterplots of angles for the relationship between stroke volume variation (SVV) and change in stroke volume index relative to pre-bolus stroke volume index against SVV obtained from 50 patients in the present study (a) and those obtained from the literature (b) Red (a, b) and blue (b) lines denote the median and interquartile range of angle values.
Evaluation of the relationship between SVV and SVI
SVI almost linearly decreased against increases in SVV in the SVV range of 9%-20% (Figure 5a). An SVV increase of 11% (i.e., SVV from 9% to 20%) resulted in a 15%-35% decrease in SVI. The relationship between SVV and ΔSVI was almost a straight line regardless of the SVV value, with a 4% decrease in SVV resulting in a roughly 10% increase in SVI (Figure 5b).

Figure 5: (a) Predicted relationship between stroke volume variation (SVV) and relative stroke volume index (SVI, in percentage) assuming that SVI is 100% at an SVV of 9% obtained from 50 patients. Bold blue line demonstrates predicted curve obtained from median angle value, with the gray area indicating those obtained from the interquartile range of angle values. Open and closed red circles denote relative SVI values at an SVV of 14% and 10%, respectively, which were used for the demonstration in Figure 5b. (b) Predicted relationship between stroke volume variation (SVV) and relative change of stroke volume index (ΔSVI, in percentage) compared to stroke volume index before intervention (i.e., points in the x axis). For example, an SVV change from 14% (open red circle) to 10% (closed red circle) results in an increase of stroke volume index by 11%.
The main finding of this study was that changes in cardiac preload after fluid bolus infusion assessed by SVV were largely inconsistent among patients. The present study infused 8 ml/kg of fluid solution almost double that frequently used for the determination of fluid responsiveness (e.g., 250 ml). This was because smaller volume of fluid bolus infusion may result in SVV changes too small to detect significant SVI changes following fluid bolus infusion during major abdominal surgery. Indeed, SVV significantly decreased following fluid bolus infusion compared to before fluid bolus infusion (7.1% vs. 8.0%), and 36% of patients (Groups 3 and 4, Figure 2) did not exhibit an increase in cardiac preload (i.e., decrease of SVV) following fluid bolus infusion. Given that patients who did not exhibit decreased SVV following fluid bolus infusion showed significantly smaller SVV values before infusion compared to those with decreased SVV following infusion (7.1% vs. 8.8%), this result might be attributed to contextsensitive volume expansion of the fluid bolus [9-12]. However, heterogeneity of intraabdominal surgical maneuvers or vasodilation due to anesthetics during fluid infusion may have contributed to the inability of the fluid bolus to increase cardiac preload by decreasing venous return.
One-third of patients showed false-responses, i.e., a decrease in SVI after fluid bolus infusion despite a decrease in SVV (i.e., Group 2, 20% of patients) or an increase in SVI after fluid bolus infusion despite an increase in SVV (i.e., Group 4, 13% of patients), probably due to anesthetics or painful stimuli during fluid bolus infusions. Consequently, only 43% of patients (i.e., Group 1) could be evaluated for fluid responsiveness, suggesting that the evaluation of fluid responsiveness at a single time point (i.e., at the end of fluid bolus infusion) is highly unreliable. Scatterplots of SVI change against SVV after removing false-response data sets provided clusters of serial data sets at different time points during the 60 minute period after the initiation of bolus infusion. These serial data sets of SVV and SVI change provided a linear regression line against SVV, and thus an angle for the SVV-ΔSVI relationship (Figure 3c). Angle analysis for 50 patients showed that angle values were almost consistent in the SVV range of 9%-20% (Figure 4a), suggesting that steepness of the SVV- ΔSVI curve does not significantly change with SVV in this SVV range. The validity of our angle-based analysis of SVI was confirmed by angle values fairly consistent with those in the literature (Figure 4b). Consequently, an increase of SVV from 9% to 20% resulted in a decrease of SVI by 15%-35% (Figure 5a). The resultant simulation of SVV and SVI change from the angle values at each SVV demonstrated that an SVV decrease of 4% resulted in an increase in SVI of approximately 10% (Figure 5b). This finding helps us discriminate true-response SVI from false-response SVI caused by painful stimuli and anesthetics during major abdominal surgery.
In contrast to surgical patients before skin incision and intensive care unit patients, intraoperative surgical patients may suffer from unexpected surgical stress and hemorrhage. The absence of fluid responsiveness may simply be attributed to inadequate increases in cardiac preload following fluid bolus infusion. Conversely, stroke volume may continue to increase even at small levels of SVV if there is a largely negative ΔSVV in patients with good cardiac function. The resulting false diagnosis of hypovolemia can lead to fluid overload [23], as evidenced by prolonged hospital stays in aerobically-fit patients undergoing major colorectal surgery who were subjected to stroke volume optimization [24]. A recent study of critically ill patients who were mechanically ventilated showed that changes in SVV after a minifluid challenge (100 ml colloid bolus during 1 min) accurately predicted fluid responsiveness [25]. In that study, SVV decreased by 3% after fluid challenge, and this was accompanied by an increase in SVI by 9.5% for responders, whereas for non-responders, SVV remained unchanged after fluid challenge. Thus, changes in cardiac preload following fluid bolus infusion should be considered in the interpretation of fluid responsiveness. The present study showed that changes in cardiac preload assessed by ΔSVV were not consistent for each round of fluid bolus infusion. On this basis, continuing fluid bolus infusion until SVV is decreased by a certain value (e.g., 4%), rather than infusing a fixed fluid volume (e.g., 250 ml), may provide a more reliable interpretation of fluid responsiveness during major abdominal surgery.
One limitation of this study involves the evaluation of cardiac preload. Indeed, although SVV is not a direct parameter of cardiac preload, it is unlikely to affect the analysis as long as its change is analyzed in the range of 9%-20%, as this range was linearly correlated with LVEDV (Figure 6). Moreover, SVV could correctly predict right ventricular preload in patients undergoing renal transplantation [26]. The second limitation pertains to the accuracy of auto-calibrated pulse contour analysis for SVI measurements. However, this is unlikely to affect the conclusions of this study, since SVI values were assessed in relation to those observed in the pre-bolus stage. The third-generation FloTracTM/VigileoTM device used in this study is known for its accuracy in tracking cardiac output changes in anesthetized patients in normo- and hypodynamic conditions [27].

Figure 6: Relationships between left ventricular end-diastolic volume (LVEDV) and stroke volume variation (SVV) obtained during acute normovolemic hemodilution in a previous study [15]. Data included mean values for 25 patients. The solid line denotes the linear regression line from data points with filled circles (y=-0.90∙x + 89, r2=0.98).The dotted line denotes the linear regression line from all data points (i.e., includes open circle data point) (y=-0.68∙x + 71, r2=0.91).
In conclusion, one-third of our patients showed false responses for SVI following fluid bolus infusion during major abdominal surgery. After excluding false responses for SVI, SVI increased almost linearly with decreases in SVV in the SVV range of 9%-20%. This suggests that changes in SVV following fluid bolus infusion rather than SVV before fluid bolus infusion significantly determine fluid responsiveness during major abdominal surgery.
This work was supported by JSPS KAKENHI Grant Numbers 24592365, 15K10549.
Tsuneo Tatara has received speaking fees from Edwards Lifesciences, Fresenius Kabi Japan, and Otsuka Pharmaceutical Factory. Takashi Sugi, Takahiko Kaneko, Hiromi Kaneko, and Munetaka Hirose declare that they have no conflicts of interest.