Journal of Medical & Surgical Pathology
Open Access
ISSN: 2472-4971
ISSN: 2472-4971
Review Article - (2017) Volume 2, Issue 4
The objective of this work is to present the elements that a laboratory should have for the continuous improvement of the pre-analytical phase, starting with a leadership of the leadership to carry out the necessary changes to reach the improvement, to know the statistical data obtained and to analyse their objectivity. In addition, going in search of the best tool of information gathering, along with a redesign of the same one to achieve a better effectiveness. The work shows that it is possible to statistically demonstrate the impact of the use of a sampling system, on the sample rejection rate, but also identifies that it is not the only reason for rejection of samples. Finally, it is presented that the search for objectivity in the information allows having the possibility of measuring the contribution of the laboratory to the care of the patient.
Keywords: Errors; Laboratory; Samples; Pre-analytical; Improvement; Indicator; Variables; CMI; Scoreboard
The work carried out in Clinic Davila of Chile, in the frame of a continuous improvement of the pre-analytical phase, allowed to develop a work system that may be implemented to any reality from a large or medium size laboratory having tools of its own in a management system.
The experience acquired from the improvement stages, delivered the alignments to determine the cause of the pre-screening errors and establish the strategic changes which allow implementing the improvement.
These alignments are determined by:
1. Establishing a leadership for a fluid communication with the Clinical services and the laboratory staff.
2. Understand that the objectivity of the data is a vital tool for the process improvement.
3. Looking for the best system of data gathering
4. Redesigning the improvement plan, focusing on effectiveness.
These elements, altogether with the knowledge of the error frequency in the pre-analytical stage, constitute a continuous improvement system that is efficient and sustainable over time.
The objective of this document is to show the elements to decrease the pre-analytic errors, in the management of the sample condition, used for the laboratory exams processing.
Definitions
a) Blood punctures: Correspond to samples of patients to which some tests are required by blood puncture leaving other samples aside such as urine, microbiological, etc.
b) Rejection per puncture rate: Corresponds to the sample rejection obtained by blood puncture; for these only the rejections are agroupated by coagulated samples, scarce samples and haemolysed samples.
c) Rate of use of closed systems for venopuncture: This is a percentage relationship between the quantities of closed system devices used concerning the total of blood punctures taken.
d) Rate of use of open systems for venopuncture: This is percentual relationship between the quantities of devices of the open system used concerning the total of blood punctures.
e) Pre- analytical variables (pre-analytical error): Are those variables contributing to situations of an inadequate sample.
f) Indicator of samples rejection: For the specific situation of the laboratory of Clinical Davila, corresponds to the relationship between the quantities of samples rejected in a period, concerning the total of samples received during the same period, showed on the percentage.
g) Open system of venipuncture: It is the system in which a sample is extracted with syringe and subsequently is transferred to the vacuum collection tubes.
This system is used in most of the regional care centers, but its use implies risks for the operator (blood handling) as for the sample (haemolysis when transferring, inadequate volume). eg.
h) Closed system or venipuncture: Is the recommended system by the CLSI, which allows obtaining samples using a closed circuit (blood flows directly to the tube). Is a biosafe system delivering samples with adequate volumes and without deterioration risks.
i) System of Applications and Products (SAP): It is an informatics system integrated of business management designed to model and automatizes the different business areas and the administration of its resources.
j) SAP Business Objects Web Intelligence (BI): Is a system which allows to obtain the knowledge from the business in a fast way and also to understand the trends and its causes.
k) Medisyn System: Corresponds to a informatics system which interacting with all the processes from the institution (LIS).
Leadership
When an improvement work is decided to be initiated in the preanalytical phase, we cannot forget that they make this not being easy. We must consider that in this phase, the involved actors is multiple, like the physician requesting a test, the administrative secretary entering the aforementioned request (as for the ambulatory patients) or the nurse requesting the examination by hospital system, the phlebotomist staff, the transport staff, the laboratory staff, the responsible staff in charge of the devices purchase and finally, the patient.
This condition forces the management of the laboratory to take a leadership attitude to continue the improvement process.
To achieve this empowerment it is enough to review the different standards that indicate the final accountable of the improvement and monitoring of the pre-analytical processes is the laboratory. This can be observed in the requirement 4.12 of Continuous Improvement, of the NCh-ISO standard 15189, indicating “The laboratory must continuously improve the effectiveness of the quality management system including the pre-analytical processes, analytical phase and the post- analytical phase establishing indicators of the quality to make the follow up and evaluate the performance all the critical aspects of the pre-analytical processes, analytical phase and the post- analytical as it is based in the requirement 4.14.7 of the quality indicators, of the same standard. Together with this, there are other national standards, establishing that the laboratory must regulate and periodically evaluate the pre-analytical phase processes.
Initially a leadership inside the laboratory must be established, with the purpose to align all the professional and non-professional staff, involved with the sample management, so the culture of the record must be incorporated.
Therefore, the data can be gathered to determine the service having the high quantity of pre-analytical errors and which is the error type having the highest frequency.
This information determines the Clinical services with highest quantity of errors or re-processes and this permits to establish an intervention plan. In this intervention plan an effective leadership is needed because all the Clinical areas involved must be improved, using a theorican and practical training program to get tools for the management of the pre-analytical variables to decrease the error. It must also be considered for the staff, in charge to trapor the samples to the laboratory. [1]. This work must be also made extensive to the administrative staff, that is accountable to enter the patient correctly, but that is not free from errors.
The leader must be able to create different types of tools to motivate the staff of the different Clinical services to achieve the improvement. An example of this was the manufacture of an interactive CD, mentioning the importance to make a good sample taking. It was also designed a manual of pocket sample taking, brochures with the correct order of the tubes for the sample taking trolleys, publications in the institutional journal, etc. the trainings must be constant and in all the Clinical services with a frequency allowing to encompass all the professionals.
Finally there is a work needed to be done with the laboratory or hospital directors which determine the device types used sampling. Is the laboratory, using the managers which must lead the incorporation of new devices, if these were necessary to correct a bad sample taking. It can be summarized that the leader must make all the actors be committed to to make a change allowing the system to reach the improvement. (Figure 1) shows the quantity of Clinical staff trained.

Figure 1: Quantity of people trained per year.
The ten year experience, allowed to visualize the effectiveness of the information collected concerning the indicator of sample rejection. This forced the search of objectivity of the data obtained.
In a first stage, the manual records were obtained; they were user dependent always, being incomplete. This added to the lack of information concerning quantity of samples received in the laboratory for each service, made impossible to establish the rates indicating where the problem was. This situation motivated the search of a different system of data storage, more simple to fill, in and the data basis management allowed to know in detail the reality of the Clinical services.
For that, there was a matrix generated in Microsoft AccessTM where the data was exported to excel spread sheet, for its later analysis. When the information was obtained separated for each Clinical service, the first interventions were carried out and these consisted in visits the nursing staff to the laboratory to analyse the problem and know the sample processing system [2].
Also, it was also possible to determine that the main causes of the pre-analytical errors were the scarce and the haemolysed samples.
After working for two years with this system, the data base was analysed and was detected that still it was incomplete, given that most of the records were generated in the day shift and there were not having records in the night shift. This would mean that the information administered was not representative of the reality and had a high rate of underreporting, an IT department request was executed to create in the reception a module some samples from a system to permit rejecting the samples more expeditiously also feed the basis of data for the posterior analysis. The development took some months and was started in January 2009.
The system allowed that, once it was visually possible to check the condition of the sample and if this did not respect the entrance requirements, the technical staff selected the reason for the rejection and this generated a status change in the system and an automatic sending of an email to the nurse in charge of the service from where the sample came informing there was a rejection in the laboratory. All this took place in real time allowing the data base to obtain important information of the exact quantity of rejected samples and the causes of the rejection.
With the incorporation of an the automatized system sample rejection, it was possible to determine that the real information was raised concerning the pre-analytical error quantity (sample rejection) which was translated in knowing the local reality of the Clinical services and to plan objective improvements.
When checking the record quantity obtained in each period it can be observed the degree of underreporting existing in the first stages and the quantity reduction of pre-analytical errors represented by the rejected record quantity of samples decreased over time (Figure 2).

Figure 2: Quantity of records obtained per year.
With this rejection system of samples, there is a significant gap in the behaviour of the rejection rate between the ambulatory patients area and the hospitalized service rate according to the (Figure 3).

Figure 3: Comparison of the rejection rate between the outpatient area and the hospitalized services.
Having objective data and knowing the reality of each service, there was a process of intervention and training out from which we obtained the following deductions:
The highest frequency of samples with heamolysis is produced for puncturing the tubes with a syringe (open system of venipuncture).
The paediatric samples from neonatology showed clots due to the bad homogenization of the small containers.
The biosafety of the process must be improved with the incorporation of bio-secure devices.
We could therefore deduce that the existing gap between the ambulatory patients-ambulatory rates of patient area rejection concerning the hospitalized area was determined by the use of the close system. With this information, there is a stored device uprising in each first aid kit of all the Clínical Dávila Clinical services, to determine the level of use of these devices already acquired by the department of Pharmacy thanks to an action of the Laboratory [1].
This uprising showed that not all the services had the devices of the closed systems of sample taking and confirms the hypothesis that most of the Clinical services still take samples with syringes puncturing the vacuum tubes.
This made us execute a research concerning the impact of the closed system use of blood sample taking over the rejection rate and statistically establish if the system use of closed sample taking is a determining factor in the decrease of the rejection rate of blood samples [3].
A collection and analysis of information was carried out in nine Clinical areas, during the first semester of the 2015 year, considering the following statistical data:
a) Monthly quantity of blood punctures.
b) Monthly quantity of devices of the closed system.
c) Quantity of rejections per puncture
d) Rate of rejection per venipuncture
The Clinical selected areas represent the different types of patients assisted in Clínica Dávila, belonging to Clinical units (adults and paediatric) not critical, paediatric, ER and ambulatory patients.
The data obtained for this work, come from a data base extracted from the computer system Medisyn and collected in a spread sheet Excel, containing an important part of the Laboratory activities statistical information.
To obtain the data used in the spread sheet calculation is administered executing different filters.
blood punctures
blood samples
puncture rejection
To obtain the rate of sample taking system use (closed or open) it was considered the quantity of devices used per month of one or the other system, concerning the quantity of blood punctures executed.
Based on the quantity of effective blood punctures, the rate of use was calculated in the closed and open system, being this last data, currently, very difficult to obtain, given that is not possible to calculate it directly from the syringe consumption, given that this device can be used for the sample extraction as well as the administration of injectable solutions and there is no way to detail the purpose given to this input. The use rate for the open system was calculating through the devices consumption of the closed system.
A total of 115.239 blood punctures were analysed generating 264.712 blood samples which meant 3.144 rejections per venipunction. Also, there were accounted for 86.046 sampling taking devices from the closed system in the open system. The devices considered in the study, are detailed in the devices used in the studied areas. With this statistical information, the rejection rates were obtained per blood punctures of each studied service comparing the rate of use from the closed system and open in each area, according to our (Table 1).

Table 1: Behaviour of the rejection rate per blood samples versus the rate of blood sample taking system use (closed and open) for each Clinical service.
When comparing the behaviour of the rejection rate v/s the use of the closed system for the sampling in the hospitalized patients area and emergency room (ER) against the area of ambulatory patients, it was observed that the ambulatory patients area showed a rate three times lower to the hospitalized and ER patients area with a rate of use five times higher as it is observed in the Figure 6.

Figure 4: Devices used in the studied areas.

Figure 5: The gap between the rates of rejection of the ambulatory patients area v/s the rate of hospitalized area is determined by the use of the closed system of the sample taking.

Figure 6: Comparison of the rejection rate v/s the rate (%) of use of the closed system by service. There are lower rates of rejection in the services used in the closed system.
One of the arguments commonly used, to explain the low rate of use in the closed system in the critical patients area, is the Clinical condition or difficulty of venous access of those patients, but this study shows that the intensive critical unit that has the highest rate of use of the closed system (Adults ICU) has the lowest rate of sample rejection and the critical unit having the lowest rate of use of the closed system (Paediatric ICU) has the highest rate of rejection as it is shown in the Figure 7. Probably the correct input for the vein was not selected.
When comparing the performance of the Pediatric Units, it was observed those that have a higher use of the closed system demand a lower rate than those that do not use the system.
If both critical units are compared, where the use of the closed system can be complex product of the condition of the patients with this statistical analysis, it can be shown that the closed system use, for blood sample taking is a determining factor in the decrease of the rejection rate, in the hospitalized patient area, of ER and ambulatory patients (Figure 7).

Figure 7: Correlation between the use of the closed system of samples and the rejection rate of samples per puncture. It was observed a negative correlation between the use of the closed system and the rejection rate. Coefficient of correlation of Pearson (r)=-0.8396, value p=0.0046.
The analysis shows a correlation between a low rate of rejection and the use of a closed system of puncture, which was statistically significant.
The results show that the use of the sample taking by the closed system in the critical units allow to decrease the sample rejection rate even considering the difficult condition of the patients.
The impact of use in the closed sampling system over the rejection rate is mainly determined by the reduction in the hemolyzed, coagulated and with low volume blood samples. These causals of rejection are associated to the use of an open extraction system given that with this system the blood is not directly collected over the additive but there is a previous step implying to take the sample with a syringe and transfer the blood to the tubes. This step may favour the clot formation given the activation of the clotting during the time of permanence of the blood in the syringe and in difficult venipunctures where the sample takes a time in making contact with the anticoagulant. On the other side favour the hemolysis, given that during the transfer some foam can be created inside the syringe due to air intake and also because the sample is normally transferred puncturing the tube cap with the syringe, and making pressure over the plunger making the blood go through a small lumen which cause haemolyse [4].
Using these statistic calculations there was a follow up during these years, to intervene in those Clinical services with a low use of the closed system of sample taking as it is shown in the (Figures 8-12).

Figure 8: Correlation between the use of the closed system for sampling and the rejection rate of samples per venipuncture. It was observed a negative correlation between the use of the closed system and the rejection rate. Coefficient of correlation of Pearon (r) = -0,8396, value p= 0.0046.

Figure 9: Comparison of the use rate of the sample taking system in Paediatric UPC v/s the rejection rate of 2.9%.

Figure 10: Comparison of the use rate, the systems of the sample taking in medical unit v/s the rejection rate of 1.3%.

Figure 11: Comparison of the sample taking system use rate in Coronary Unit v/s the rejection rate of 1.93%.

Figure 12: Comparison of the use rate of the system of sample taking in Adult ER v/s the rejection rate of 1.4%.
When analysing this statistic data after some years of its implementation, we observe that the medical unit has the close system highest rates of use but does not show the highest rate of sample rejection, being these four times lower in the area of ambulatory patients sample taking. The aforementioned indicates that the problem is not only the use of the close system, but it also needs to be considered the specific characteristics of the patients and above all work in the adequate management of the pre-analytical variables, such as:
A) Identity of the patient
B) Preparation of the Patient
C) Selection of the venepuncture location
D) Time and application of the tourniquet
E) Adequate venepuncture technique
F) Collection order
G) Adequate mixture with the additive
H) Correct volume of the specimen
I) Adequate management of the tube and processing of the specimen
J) Serum samples
K) Plasma samples
L) Centrifugation
M) Stability of the total blood, the serum and the plasma
The experience at work of the improvement in the stage of preanalytical phase and the interest to raise information as timely as possible, led us to examine the Web Intelligence SAPTM tool.

The development of the data monitoring and the report collection in real time, took a year to be constructed but it currently permits to raise the following information with a gap of hours:
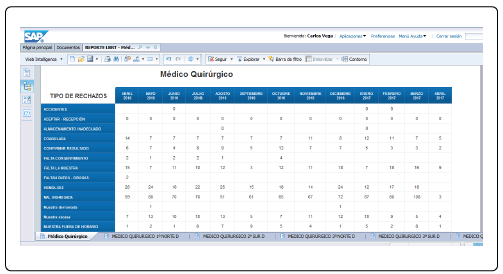
The daily rejection types, for each hospitalized service, ER and ambulatory. The information is shown per month but the last data rises what is accumulated until the date of the medical consultation.
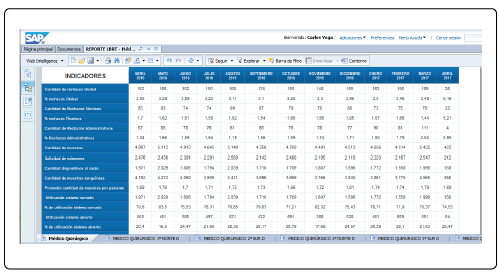
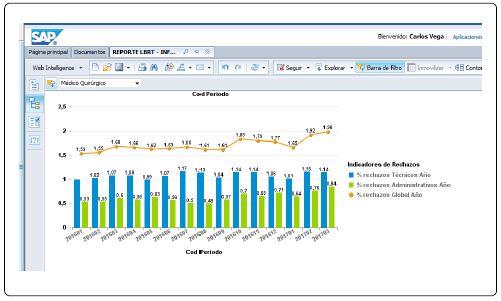
The different indicators such as quantity of global rejections, % of global rejections, quantity of technical rejections, % of technical rejections, quantity of administrative rejections, % of administrative rejections, quantity of sample, request of examinations, quantity of vacuum devices, quantity of blood samples, average quantity of samples per patient, % of closed system use, % of open system use, index of hemolysis, and others, for each hospitalized service, ER and ambulatory patients.
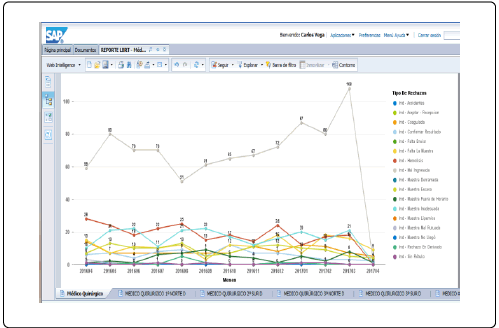
The historical behaviour of the rejection types for each hospitalized service, ER and ambulatory patients.
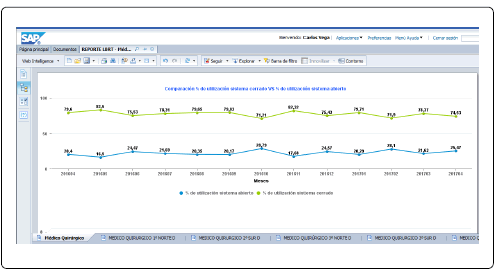
The historical behaviour of the closed and open system use % for each hospitalized service of ER and ambulatory patients.
A global graph with the historical behavior of the technical rejections, administrative rejections as well as global, for each hospitalized, ER and ambulatory patients service.
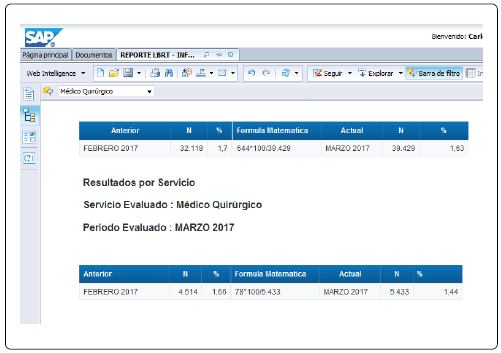
Once per week and every month end, an automatic report is raised for each Clinical service, with the information of the local rate and the institutional rate with the data of the previous month and the “n” used.
With a historical graph of the rejection % per each hospitalized service, of ER and ambulatory patients.
A historical graph can be raised with the % of institutional rejection.
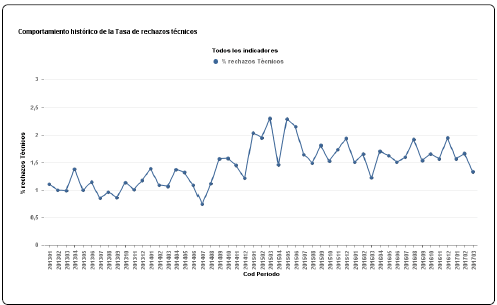
A historical graph can be raised with the types of institutional rejection.
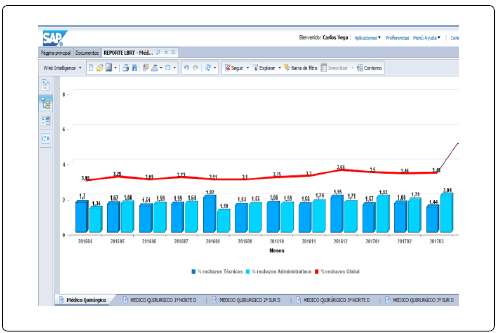
After they able to have real-time information and a robust data collection system, being able to collect data and therefore using efficiently that information, with the purpose to achieve the control of the pre-analytical errors in the Institutional Computer System. With this objective in mind we design an integral scorecard delivering the daily warning of what is going on in each Clinical service. The system is visible in the corridors of the laboratory and in the laboratory head office. In a complementary manner, it was drafted an e-learning course with items concerning the control of the pre-analytical errors to achieve an interaction with the scorecard every time there are events raised. Also, the data monitoring obtained in the SAP system allows to feed with monthly information the matrix of indicators, which is analysed quarterly to establish the indicator achievement of sample rejections, the objectives of quality, the achievement of the policy and the laboratory contribution concerning the patient care (Figures 13-20).

Figure 13: Comparison of the use rate of the sample taking system in the Ambulatory patients sample taking v/s the rate of rejection of 0.3%.

Figure 14: Integral scoreboard (CMI).

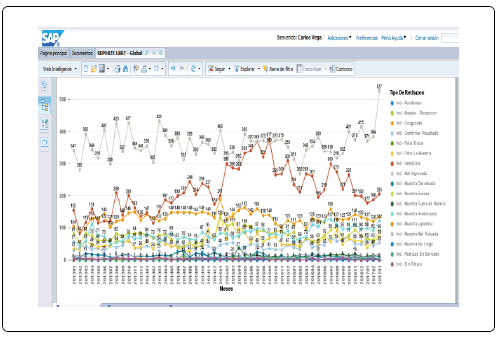
Figure 15: Daily monitoring of the indicators in real time.

Figure 16: Installed screens in the corridor of the laboratory.

Figure 17: Flow of continuous improvement.

Figure 18: E-learning course items.

Figure 19: Indicators matrix.

Figure 20: Behaviour Sigma of the data for each analysed area.
Finally it is important to underline that the information collected, must be expressed in a standardized manner in Sigma value, so it can be compared with the behavior in other care centers (Table 2).

Table 2: Sigma values of each analysed area.
The work in the improvement of processes in the pre-analytical requires a lot of effort and needs an empowered leadership able to motivate the laboratory team, the staff of the Clinical services and the management. Also we should get around obstacles which should be solved with a high level of creativity taking profit of all the resources economic as well as computing.
The application of these recommendations, should deliver the first alignments to start raising objective information, creating a training system and selecting a type of Institutional Computer System tool allowing to monitor the indicator achievements. It is important to take as a guide some laboratory standards, useful as an argument to generate the change of behaviour of the entire environment with which the laboratory is related.