Journal of Osteoporosis and Physical Activity
Open Access
ISSN: 2329-9509
ISSN: 2329-9509
Research Article - (2015) Volume 3, Issue 3
Recent studies have challenged the traditionally accepted view that obesity is beneficial to the growing skeleton. Despite having greater bone mineral content (BMC) and lean mass when assessed by dual X-ray energy absorptiometry (DXA), compromise in skeletal integrity (i.e. fracture, joint pain) are increasingly being reported in the pediatric population. The objective of this study was to evaluate the relationship between absolute quantitative (mass) and qualitative aspects of bone and muscle (cortical and trabecular density, muscle and marrow density, and stress strain index; SSI) in obese peri-pubertal girls ages 7-11 years. Mass (bone, fat and lean) was assessed by DXA and density, strength and fatty infiltration was evaluated by peripheral quantitative computed tomography (pQCT). pQCT scans were performed at 4% and 66% of radius length as well as 66% of the tibia length. All girls were obese BMI % (>95th). Statistical analysis was conducted using the sample mean body fat percentage girls to stratify into two groups, obese (<43.78%), and morbidly obese (>43.78 %). BMC and lean mass were not significantly different between the groups. Total body fat was positively associated with both lean and bone mass in both groups. Total body fat was inversely associated with cortical density and SSI in the upper and lower extremity. SSI at 4% in the radius was significantly lower in the morbidly obese group, yet the trabecular and cortical density of the upper extremity was higher. In addition, marrow area was greater yet marrow density, an estimate of bone marrow adipose tissue was significantly lower in the morbidly obese group (p<0.05). This study extends these observations to demonstrate the impact of obesity in the context of bone and muscle quality and suggest the increased fracture in obese, particularly morbidly obese girls, rates may be due to the adverse impact of obesity on musculoskeletal health.
<Keywords: Obesity; Bone; Muscle; Musculoskeletal
BMC: Bone Mineral Content; DXA: Dual X-ray Energy Absorptiometry; PQCT: Peripheral Quantitative Computed Tomography; SSI: Stress Strain Index;
It has been suggested that a 10 % increase in peak bone mass will delay onset of osteoporosis by 13 years [1]. Clinical investigations have established that a high body weight and obesity are positively correlated with bone mass and/or bone mineral content (BMC) as well as lean mass. However, greater incidence of skeletal impairments (i.e. fracture in growing bones with subsequent poor healing resulting in stiffening of sub-chondral bone) [2] and poor musculoskeletal health (e.g. joint laxity or malalignment), has also been well-documented [3-6]. In obese children has challenged the traditionally accepted view that obesity is beneficial to the growing skeleton. Evolutionarily, the interplay between growth and obesity represent a physiologically adaptive trait in which the body chooses between investing energy is growth or saving the energy for storage. The environmental conditions encompassed by the obese state, the positive energy imbalance, adipose tissue infiltrates into muscle and bone impairing each tissue’s physiology and functioning.
Although capacity to maintain musculoskeletal function is among one of the strongest determinants of health aging and musculoskeletal conditions in the pediatric population are an emerging public health concern, few studies have investigated the impact of obesity on strengthstructural properties of the musculoskeletal system. Previous studies have examined associations between body composition (by DXA) and qualitative assessment (via pQCT) measures in adolescents, but few have included obese participants [7-9] and one included only males [10]. These studies demonstrated a positive correlation between stress strain index (SSI) and total body fat mass in healthy weight children. More recently, [10] compared a large group of obese and normal weight children and adolescents observing that obese children had greater cortical dimensions, muscle mass and bone strength in the tibia (but not the radius) relative to their normal weight peers.
Given the multi-factorial nature of attaining and maintaining musculoskeletal health, it is likely that obesity during growth and development may initiate musculoskeletal disease by interacting and potentiating the effects of other risk factors, such as skeletal alignment and muscular deconditioning. Recent reports show that obese children have impaired lower-limb biomechanics that result in a lowered longitudinal arch, such as foot pronation, are thought to increase tension within the plantar fascia and thereby increase the risk of facial injury and decreased gross motor skills [11]. An understanding of the effect of obesity on qualitative aspects of the musculoskeletal system and its interactions with other risk factors would provide a greater opportunity to provide meaningful support in the prevention and treatment of musculoskeletal disorders in the obese pediatric population. The objective of this study is to evaluate the relationship between musculoskeletal mass and quality in obese peri-pubertal girls. We hypothesize that although fat and muscle and bone mass would be positively correlated, lower qualitative measures such as cortical thickness, bone marrow density, muscle density (an estimation of fat infiltration in the muscle) and SSI would be apparent [12].
Data included baseline assessment of girls ages 7-11 years participating in a dietary weight-loss intervention (NIH/NIDDK 083333 PI: Casazza). All girls were self-reported Caucasian (non- Hispanic White) or African American (non-Hispanic Black; 57 %). Reproductive maturation (Tanner stage) was assessed by a pediatrician based on the criteria of Marshall and Tanner. One composite number was assigned for Tanner staging, representing the higher of the two values defined by breast and pubic hair. Girls, who had attained menarche, had a medical diagnosis and/or taking medications known to affect body composition, metabolism, and cardiac function were excluded.
Whole-body body composition was assessed using an iDXA instrument (GE-Lunar, Madison, WI) was used to assess BMC, lean and fat mass (total fat mass, percent body fat). DXA has proven to be a valuable two-dimensional bone imaging technique, but because DXA calculates areal, and not volumetric, BMD and since the bone area does not increase at the same proportion as bone volume during growth, the true BMD of children and adolescents might be overestimated for large bones and underestimated for small bones. Therefore, BMC is recommended as the bone measure to assess bone mass status in children and adolescents [13]. Girls were scanned in light clothing free of metal and other dense objects lying down on the DXA table and the scan took approximately 7 minutes. DXA scans were performed and analyzed using pediatric software (encore 2002 Version 6.10.029).
pQCT was used to assess the qualitative bone parameters at the radius and tibia using a Stratec XCT 3000 (White Plains, NY). The tibia and radial length was measured and trabecular and cortical density, muscle and marrow density as well as stress strain index (SSI) was evaluated at 4 % and 66 % of radial length and 66% of tibial length. The tibia scan was analyzed using the TIBIA muscle mask macro software. The radial length was measured from the radius head to the styloid process (mm). One image slice was taken at 4 % (a location where bone is predominantly trabecular in nature) and one at 66 % (a location where bone is primarily cortical in nature) of the length of bone defined by a region of interest and then analyzed using the macro software. All scans were conducted by the PI.
Statistical analyses were conducted using IBM SPSS Statistics Version 22. All the results are expressed as mean ± standard deviations and the two-tailed significance was set at p < 0.05. Bivariate correlation examined the relationship between fat, lean and bone mass (BMC), cortical and trabecular density, marrow and muscle density and SSI. In addition, data was analyzed after stratification by total body fat percentage, with the sample mean body fat percentage used as the cutpoint (43.78 %). Girls were categorized as obese if their body fat percent was less than or equal to 43.78 % (range 32 – 43.78 %) and morbidly obese if their body fat percentage was greater than 43.78 %.
Table 1 illustrates the sample characteristics (n = 51, 57 % black or African American). Half (n = 25) were classified as obese (total body percent fat >43.78). Girls were 9.98 ± 1.28 years, early pubertal (Tanner 2.48 ± 0.89) and BMI percentile and the height was 57.18 ± 3.70 inches. As expected, total fat mass (22.9 ± 5.6 vs. 30.5 ± 5.7 kg) and total body fat percent (40.2 ± 2.3 vs. 47.3 ± 3) were significantly different (p < 0.001), but there were no significant differences in age, tanner, or height between the obese and morbidly obese group. There were no significant difference in lean mass, BMC, and BMD between the groups.
| Parameter | Total Population Mean ± SD (n = 51) |
Obese Mean ± SD (n = 25) |
Morbidly obese Mean ± SD (n = 26) |
| Age (yrs) | 9.98 ± 1.3 | 9.9 ± 1.2 | 10.1 ± 1.4 |
| Tanner (average) Stage I (%) Stage II (%) Stage III (%) |
2.5 ± 0.9 11 59 30 |
2.6 ± 0.9 10 66 24 |
2.4 ± 0.8 11 54 34 |
| Race (% African American) | 57 | 54 | 62 |
| Height (cm) | 145.3 ± 9.4 | 145.3 ± 10.2 | 145.3 ± 7.7 |
| Weight (kg) | 135.6 ± 27.5 | 127.5 ± 30.2 a | 143.5 ± 22.5 b |
| BMI% | 99 | 98 a | >99 b |
| Total Fat (kg) | 26.8 ± 6.8 | 22.9 ± 5.6 a | 30.5 ± 5.7 b |
| Percent Fat | 43.8 ± 4.4 | 40.2 ± 2.3 a | 47.3 ± 3.0 b |
| Whole body Lean Mass (kg) | 32.4 ± 6.4 | 32.6 ± 7.8 | 32.2 ± 4.9 |
| Whole Body BMC (kg) | 1.6 ± 0.3 | 1.6 ± 0.4 | 1.6 ± 0.3 |
| Whole Body BMD (g/cm3) | 0.95 ± 0.1 | 0.94 ± 0.1 | 0.96 ± 0.1 |
a,b Statistically different p < 0.05
Table 1: Descriptive Parameters of the Population.
Figure 1 depicts the relationship between BMC and total fat mass (a) and the relationship between lean mass and total fat mass (b). Using the total sample a correlation r=0.73 (p < 0.001) was observed (data not shown). However, in the obese group correlation for BMC r = 0.75, p < 0.001, while in the morbidly obese group, the relationship was r = 0.18, p = 0.05. Lean mass was also correlated with total fat mass (r = 0.87, p < 0.001 obese; r = 0.53, p < 0.01, morbidly obese) in both groups.
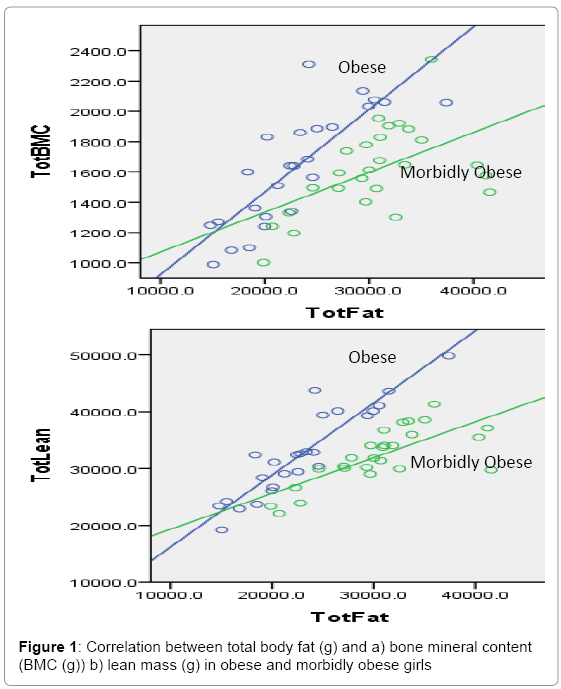
Figure 1: Correlation between total body fat (g) and a) bone mineral content (BMC (g)) b) lean mass (g) in obese and morbidly obese girls
Table 2 illustrates the qualitative aspects of musculoskeletal health in the girls as assessed by pQCT. At the tibia, cortical density was significantly greater (p = 0.017) and marrow area (p < 0.05) and marrow density was significantly lower (p = 0.04) in the obese group. Cross-sectional muscle area was significantly greater in the morbidly obese group (p < 0.05), yet SSI as well as muscle density was greater albeit not significantly in the obese group. In the radius, at 4 %, SSI was significantly greater (p = 0.04) in the obese group. The differences in trabecular and cortical density at 4 % did not reach statistical significance between the groups. Conversely, trabecular density and cortical density at 66 % radius length were significantly higher (p = 0.025 and p = 0.016, respectively) in the morbidly obese group, yet this was not extended to statistical difference in SSI.
| Variable | Total Population Mean ± SD |
Obese Mean ± SD |
Morbidly obese Mean ± SD |
|---|---|---|---|
| Tibia | (n = 51) | (n = 25) | (n = 26) |
| Length (cm) | 35.4± 3.3 | 34.5.4 ± 3.0 | 36.1.5 ± 3.5 |
| Cortical Density | 941.9 ± 48.7 | 956.1 ± 42.5 a | 928.2 ± 51.1 b |
| SSI | 1599.1 ± 601.6 | 1612.2 ± 662.9 | 1586.5 ± 549.2 |
| Marrow Area | 126.5+65.3 | 120.5+69.0a | 132.8+60.5b |
| Marrow Density | 34.9 ± 15.4 | 39.9 ± 15.4a | 29.7 ± 13.9 b |
| Muscle Density | 71.5 ± 6.5 | 72.4 ± 5.3 | 70.6 ± 7.4 |
| Cross-sectional muscle area (mm2) | 5012.7+1333.8 | 4820.6±1282.7a | 5297.3±1409.5b |
| Radius | |||
| Length (cm) | 22.8 ± 2.1 | 23.0 ± 2.5 | 22.6.4 ± 1.7 |
| 4% SSI | 39.3 ± 60.0 | 44.3 ± 51.6 a | 22.3 ± 17.7 b |
| 4% Trabecular Density | 284.7 ± 67.1 | 274 ± 69.6 | 295 ± 64.1 |
| 4% Cortical Density | 769.8 ± 49.3 | 773.4 ± 54.8 | 756.8 ± 21.8 |
| 66% SSI | 215.8 ± 72.9 | 217.8 ± 92 | 213.8 ± 49.8 |
| 66% Trabecular Density | 510.5 ± 125.4 | 470.7 ± 110.7 a | 548.7 ± 128.8 b |
| 66% Cortical Density | 960.7 ± 71.4 | 936.6 ± 70.9 a | 983.9 ± 65 b |
a Statistically different p < 0.05
Table 2: Comparison of Musculoskeletal Quality in the Tibia and Radius in Obese and morbidly obese ( > 43.78% fat) girls.
Table 3 presents the Pearson correlations between fat mass and musculoskeletal parameters. When the total sample was included, body fat was inversely associated with tibial cortical density (p < 0.05) and SSI at 4% of the radius and (r = -0.39, p = 0.004). Total body fat percentage was positively associated with trabecular (r=0.3, p < 0.05) and cortical (0.34, p<0.05) density at 66 % of the radius. When stratified, tibia length (r = 0.58, p<0.01), tibia SSI (0.76, p<0.01), radius length (r=0.51, p<0.01) and 66% radius SSI (r=0.58, p<0.01) and total fat mass were correlated in the obese group only. In addition, there was a marginal inverse association between marrow density and total fat mas only in the morbidly obese group (r =- 0.35, p = 0.07).
| Total Body Fat % | Total Fat Mass | ||
| Total Population | Obese (n=25) | Morbidly obese (n=26) | |
| Tibia | |||
| Length | r=.0.096 | r=0.581** | r=0.374 |
| Muscle Density | r=.-0.037 | r=0.144 | r=0.036 |
| SSI | r=.-0.190 | r=0.759** | r=0.152 |
| Cortical Density | r=.-0.273* | r=0.219 | r=0.078 |
| Marrow Density (mg/cm3) | r=.0.165 | r=-0.224 | r=-0.352† |
| Radius 4% | |||
| Trabecular Density | 0.060 | -.013 | .068 |
| Cortical Density | -0.179 | -.399 | .064 |
| SSI | -0.393** | .275 | -.275 |
| Radius 66% | |||
| Length | -0.164 | .505** | .305 |
| Trabecular Density | 0.309* | .095 | .260 |
| Cortical Density | 0.337* | .340 | .227 |
| SSI | -0.131 | .581** | -.025 |
*p < 0.05** p < 0.01, ***p < 0.001, †0.05 < p > 0.10
Table 3: Pearson Correlations between Qualitative Parameters and Body Fat.
The beneficial relationship between obesity and bone health has been largely extrapolated from osteoporosis prevalence studies in older adults with notional support by mechanostat theory (i.e., greater body weight exerts a greater load or weight on the skeletal frame thereby obesity enhances bone strength). However, in the obese pediatric population in which there is a wealth of accumulating reports of compromised bone integrity (i.e. increased fracture incidence) a benefit of excess adiposity on the skeleton may not translate. Although obesity is associated with a higher bone and lean mass, the impact of excess adiposity on bone and muscle quality, presents a more complicated picture that may actually lead to an adverse effect on musculoskeletal health [14-17]. Thus, the contribution of obesity as a risk factor for suboptimal musculoskeletal development remains an important clinical question. Similar to previous studies we observed a positive association between total body fat and lean and bone mass. However, our results provide support for an adverse effect of obesity on bone quality with the detriment becoming greater with increased degree of obesity. Bone strength at 4 % in the radius was significantly lower in the morbidly obese group (p < 0.05), yet the trabecular and cortical density of the upper extremity was higher. In addition, assessment of the bone marrow compartment revealed greater marrow space with a higher proportion of adipose tissue, which has been suggested to compromise bone integrity [18]. Further, the cross-sectional muscle area in the tibia was greater, while density was lower, in the morbidly obese girls indicating greater fatty infiltration in the muscle. Taken together, accumulating evidence of suboptimal bone and muscle quality in obese girls appear to be a product of both material and structural abnormalities or the musculoskeletal system.
The effect of obesity on bone integrity may be site dependent [19]. Kessler et al. reported lower leg, ankle and foot fractures were increased in obese children, but not in the hip [20]. Further, a fracture study in females aged 4–15 years reported that those who sustained a fracture were more overweight and had a smaller cross-sectional area at the non-fractured forearm compared to the non-fracture group [21]. Additionally, in a case–control study of children with and without fractures, it was found in girls that the prevalence of obesity was greater in those presenting with fracture at either upper or lower limb [22]. These studies report an increased risk of lower extremity, but not upper extremity, fractures in obese children [19,20,23,24] . In addition, when Fornari et al., reported that when fractures are sustained in the lower extremities, they are often more severe injuries compared with those in non-obese children [24]. Our results indicate potential diminished integrity of muscle and bone as obesity increases.
We have previously reported greater BMAT in obese girls relative to their leaner counterparts. This study provides a potential explanation for the impaired bone integrity frequently reported among obese children, particularly the lower extremities of obese girls. Though speculative, our results support a potential mechanism by which obesity impairs bone integrity via effects on the marrow compartment. Maintenance of hematopoietic capacity (i.e. dense marrow) is essential for bone strength-structure by promoting deposition of bone matrix proteins and minerals as well as supporting self-renewal, expansion and activity crucial for the dynamic remodeling of the skeletal system. This is particularly relevant to the development of the appendicular skeleton during the linear growth spurt.
An obligatory level of fat is required for the initiation of skeletal maturation; however, excess adiposity, while associated with increased bone size, may have an adverse effect on bone quality. Across the pubertal years, body fat has been associated with larger and denser bones in girls [25]. However, accelerated skeletal growth and greater bone size may not translate into reduced fracture risk. Although proximately adiposity may contribute to greater height, an associated deceleration of growth post-pubertally may be met with increasing adipogenic pathways, in addition to early closure of the growth plate and subsequent hindrance of maximal adult height. We observed a positive relationship between appendage lengths in obese girls that was not apparent in the morbidly obese girls. In addition, though not statistically significant, the morbidly obese group had greater trabecular and cortical density at 4 % of radius length, possibly indicating closure of the growth plat despite relatively early in pubertal progression. A recent evaluation of height variation over the past few decades indicates that while average adult height began to increase around 1975 after nearly two decades of stagnation. However, increases in height of AA females diminished [26]. The majority of the morbidly obese girls in this sample were African American. The extent to which the relationship translates into health outcomes and whether these observed relationships contribute in part to decline in adult height and greater adverse health outcomes among AA women warrants further investigation.
Alterations in cross-links drastically affect the strength-structural properties of entire musculoskeletal system. The skeleton is about 60 % mineralized. The composition and degrees of cross-linking also has great influence on function. For example, there is some evidence that bone mineral density is increased early in the disease process and is associated with the progression of joint-space narrowing, focal degeneration of cartilage has also been shown to occur in the absence of measurable changes in bone mass. In the context of increased fracture and severity on obese, beyond BMC, the abnormalities could be interrelated since distorted collagen is also likely poorly mineralized. It has been documented that an overly glycated collagen matrix, confounded by reduced osteoblast differentiation, in the setting of increased cortical porosity, may lead to compromised biomechanical competence [27].
There were no associations between total body fat and muscle quality in either group. However, it is conceivable that muscle function may also be impaired in these girls [28]. Previous research has consistently documented that normal weight children outperform obese children in activities requiring gross motor competence (i.e., upper-limb coordination, bilateral coordination, balance, running speed and agility, and strength) and the magnitude of difference is greater among girls. Syed and Davis proposed that reduced muscle strength relative to body weight induces earlier fatigue of the quadriceps muscles in the obese which, in turn, reduces shock attenuation and increases the loading rate and variability at the knee during gait. Conceivably, obese children perform worse because a greater proportion of excess mass has to be supported or moved against gravity during these tasks. Thus, that excess mass limits an optimal execution of movement, which in turn could have long-term effects on musculoskeletal development [11,27,29,30] . As such, poorer balance and motor skills in obese children might result in an injury mechanism which tends to increase fracture risk. In the context of muscle quality, muscle density has been validated as a reflection of adipose deposition into the muscle such that, greater fat infiltration is an indicator of reduced muscle density [31].
Capacity to maintain musculoskeletal function is a major determinant of healthy aging, thus longitudinal studies covering to identify key factors regulating qualitative aspects of bone and muscle development and the relative changes in the relationship between fat and bone during growth are needed to provide critical information needed to maximize potential therapeutic interventions to counter the linked risks of obesity and early onset morbidity and mortality. Furthermore, the identification of a detrimental effect of obesity on musculoskeletal health, in the absence of consideration of quality, would lend that fat-free mass (lean and bone) as the primary determinant of resting energy expenditure, responsible for whole-body glucose disposal and regulation of lipid metabolism would be protective of cardiometabolic disease, which is well-documented to be converse. In fact, in obese children, Weber et al. [32] found that higher lean mass was associated with increased odds of abnormal BP, HDL cholesterol, and WC, even after adjustment for fat mass. Another smaller study [33] found similar associations between higher lean mass and cardiometabolic risk factors (reviewed in (15).
The use of robust body composition measures in conjunction with pQCT allowed for quantitative and qualitative evaluation of musculoskeletal health. Although this study generates valuable insight regarding the relationship between obesity and bone and muscle, limitations must be taken into consideration. Despite the crosssectional nature of this study, with modest sample sizes, the interesting findings relating to muscle and bone quality in obese and morbidly obese girls lay the groundwork for future studies of longer duration and larger sample size. All of the girls in this were obese and normative data is lacking, warranting further research. Although we examined only the appendicular skeleton, specifically the radius and tibia, that of the axial skeleton may also be relevant and warrants investigation. Future studies should include a larger sample size, inclusion of multiple races/ethnicities, as well as inclusion of individuals with a wider range of body habitus. In addition inclusion of functional musculoskeletal health assessment in future studies will provide a more comprehensive evaluation of quality.
The effect of obesity on musculoskeletal health is an important area of investigation, as obese children have been a population with surges in fracture incidence and have poorer muscle function relative to their healthier weight peers. Although it has become clear that body mass is a significant determinant of bone and lean mass in absolute terms, the influence of excessive amounts of fat on musculoskeletal quality during critical stages of development is an emerging health concern. Particularly in girls, across the pubertal years, body fat has been associated with larger and denser bones in girls; however, accelerated skeletal growth and greater bone and lean mass does not translate into qualitative benefits in musculoskeletal quality.