Journal of Fertilization: In Vitro - IVF-Worldwide, Reproductive Medicine, Genetics & Stem Cell Biol
Open Access
ISSN: 2375-4508
ISSN: 2375-4508
Research Article - (2015) Volume 3, Issue 3
Background: There are comparatively few data on the value of different ovarian response predictors in conjunction with a gonadotropin-releasing hormone (GnRH) antagonist controlled ovarian stimulation (COS) protocol. This study assessed the predictive value of AMH, FSH and AFC for determining poor and high ovarian responses in Vietnamese patients (n=820) undergoing GnRH antagonist protocol COS.
Methods: Poor, normal and high response were defined as ≤ 3, 4-15 and >15 oocytes retrieved, respectively. AMH, FSH and AFC were assessed on cycle day 2. Cut-off predictive values were identified, and poor and high response models developed.
Results: AMH had the highest accuracy for predicting both poor and high ovarian response (cut-off values ≤1.25 and >3.57 ng/mL, respectively) and was significantly better than AFC (cut-offs ≤5 and >12), and both AMH and AFC were significantly better than FSH (cut-offs >8.94 and ≤7.36 IU/mL). For prediction of poor ovarian response, a model including AMH+AFC (AUC 0.93, 95%CI 0.91, 0.96) was equivalent to one using AMH only (AUC 0.92, 95%CI 0.90, 0.95; p=0.131), and both were better than AFC alone (AUC 0.89, 95%CI 0.86, 0.92; p<0.001). For high ovarian response, AMH+AFC (AUC 0.90, 95%CI 0.88, 0.92) was significantly better than AMH alone (AUC 0.89, 95%CI 0.87, 0.91; p=0.03), and AMH+AFC and AMH were better than AFC alone (AUC 0.86, 95%CI 0.83, 0.89; p<0.001).
Conclusions: In Vietnamese women undergoing GnRH antagonist COS, the best single biomarker was AMH, while a model including AMH+AFC had the highest predictive value for high ovarian responses.
<Keywords: Antral follicle count; Follicle stimulating hormone; Anti-Müllerian hormone; Ovarian response; In vitro fertilization; GnRH antagonist
AFC- Antral Follicle Count; AMH- Anti-Müllerian Hormone; ART- Assisted Reproductive Technologies; AUC- Area Under The Curve; BMI- Body Mass Index; CI- Confidence Interval; COS- Controlled Ovarian Stimulation; FSH- Follicle Stimulating Hormone; ICC- Intra-Class Correlation Coefficient; IVF- In vitro Fertilization; IQR- Interquartile Ratio; NPV- Negative Predictive Value; OHSS- Ovarian Hyperstimulation Syndrome; OR- Odds Ratio; PCOSPolycystic Ovary Syndrome; ROC- Receiver Operator Characteristic; SD- Standard Deviation
Optimal ovarian response is a key part of controlled ovarian stimulation (COS) procedures. The ability to predict ovarian response is crucial to obtain an adequate response and an optimal outcome from assisted reproductive technologies (ART) and offers the possibility of tailoring COS protocols for each individual patient. From a clinician’s perspective, the goals are to identify potential high responders and hence avoid over-stimulation, whilst in the poor responders to counsel the patient as to a potential cycle failure as well as to apply the most appropriate stimulation protocol. For the patient, use of accurate predictors of ovarian reserve could help them to be given realistic information about their chances of conceiving as well as facilitating discussion of alternative options such as egg donation or adoption. In addition, prevention of cycle cancellation has the obvious potential to reduce costs [1].
Factors used to try to predict the success of COS and to determine the most appropriate regimen and gonadotropin starting dose for an individual patient include response in previous cycles, age, menstrual cycle length and body mass index (BMI) [1]. In addition to obtaining a full patient history, use of markers of ovarian reserve such as follicle stimulating hormone (FSH) and antral follicle count (AFC) and more recently anti-Müllerian hormone (AMH), are measured for the prediction of ovarian response and clinical outcome during COS [2].
There is growing evidence that ovarian response tests have an important role to play in the prediction of extremes to FSH stimulation and provide useful information on which to base therapeutic COS strategies. However, there are still some significant areas where knowledge is lacking. Firstly, there is relatively little data on the use of these ovarian response tests in conjunction with a gonadotropinreleasing hormone (GnRH) antagonist COS protocol, and study results have not been consistent [3-6]. The use of this agent to control untimely LH surges is increasing across centres worldwide and therefore more supporting data is vital. Secondly, the role of ethnicity has not been widely studied. Ethnicity has been associated with altered age-specific AMH levels, with women of Chinese, Black African, Hispanic and South Asian descent reported as having a lower AMH at a given age compared with Caucasian women [7,8]. With respect to AFC, a single cross-sectional study showed a lower average age-specific AFC in Indian versus Caucasian women, suggesting that ethnicity may also influence this measure of ovarian reserve [8]. As a result, ethnicityspecific cut-off values may be required to accurately define poor [9] and high [10] responders to COS.
The current study was designed to determine the predictive value of AMH, FSH and AFC for determining poor and high responses to ovarian stimulation in Vietnamese infertile patients undergoing COS using a GnRH antagonist protocol. Cut-off predictive values for these biomarkers were identified, and a model developed for prediction of poor and high responders.
Study subjects and design
This prospective cohort study was conducted at IVFAS, An Sinh Hospital, Ho Chi Minh City, Vietnam, from December 2012 to December 2013. Female partners of infertile couples requiring ART and undergoing their first cycle of In vitro fertilization (IVF) were eligible to participate in the study. Inclusion criteria were: Vietnamese ethnicity, age 18-45 years, BMI ≤ 25 kg/m2, ovarian stimulation using a gonadotropin-releasing hormone (GnRH) antagonist protocol and willingness to participate in the study. Patients were excluded if they had undergone ovarian stimulation for a different ART technique (e.g. intrauterine insemination) in the previous 2 months, were categorised as WHO Group 1 or current smokers, or had polycystic ovary syndrome (PCOS), hyperprolactinemia, thyroid tumors, ovarian tumors or endometrioma.
The Institutional Review Board (IRB) and Ethics Committee approved the study protocol (IRB reference number: 53 DHYD-HD). All patients provided written informed consent to participate in the study, which was conducted in accordance with the Declaration of Helsinki and Good Clinical Practice. Trial registration number was NCT02173444.
Ovarian stimulation protocol
All subjects received a GnRH antagonist protocol (cetrorelix 0.25 mg/day, Cetrotide®; Merck Serono, Germany). The starting dose of recombinant FSH (rFSH, Gonal-F®; Merck Serono, Germany) was 225 IU for subjects aged <36 years and 300 IU for those aged ≥ 36 years, as reported previously [11]. The daily dose was fixed until human chorionic gonadotropin (hCG) was administered. Human chorionic gonadotrophin (hCG; 250 μg, Ovitrelle®; Merck Serono, Germany) was administered when there were ≥ 2 follicles of ≥ 17 mm. For patients with ≥ 20 follicles of ≥ 14mm on the day of hCG administration, a GnRH agonist (triptorelin 0.2 mg subcutaneous injection, Decapeptyl®; Ipsen Beaufour, France) was given to trigger maturation rather than hCG, in order to avoid ovarian hyperstimulation syndrome (OHSS) in these high-risk patients. Embryo transfer (ET) was performed on day 2 after oocyte retrieval. Luteal phase support was provided using vaginal progesterone gel, 2 applicators per day (Crinone® 9% gel; Merck Serono, Germany) from the day of oocyte retrieval until the day of pregnancy testing (14 days). For patients triggered with a GnRH agonist, luteal support consisted of a combination of progesterone gel (Crinone® 9% gel; Merck Serono, Germany), intramuscular (IM) progesterone 50 mg (Rotex Medica, Germany) and oral estradiol valerate 2 mg, three times per day (Progynova®; Bayer Schering, Germany) from the day of oocyte retrieval until the day of pregnancy testing (14 days). A poor response was defined as ≤ 3 oocytes retrieved [9], a normal response as 4-15 oocytes retrieved and a high response as >15 oocytes retrieved.
Measurement of AFC, AMH and FSH
Eligible subjects had 3 mL of blood drawn on day 2 of their menstrual cycle and just prior to FSH stimulation for determination of AMH and FSH levels. Serum separation was done within one hour after blood collection, serum was stored at –20 °C and than transferred to testing laboratories within 24 hours after blood sampling. Serum AMH levels were determined using AMH Gen II assay (Beckman Coulter, Texas, USA; lowest detection limit 0.08 ng/mL) and the FSH level was determined using the electrochemiluminescence method (Roche, Mannheim, Germany; assay sensitivity 0.100 mIU/mL). Each serum sample was sent to two independent laboratories for measurement of AMH and FSH (lab 1 and lab 2).
To determine AFC, eligible subjects underwent transvaginal 2-dimensional ultrasound (7.5MHz, Toshiba, Japan) on day 2 of their cycle. AFC was performed independently by two trained doctors (doctor 1 and doctor 2). Total AFC included all follicles of 2-10 mm in both ovaries as previously defined [12].
Statistical analysis
An equation developed by Hanley & McNeil [13,14] was used to compare the AUCs of receiver operating characteristic (ROC) curves for AMH, FSH and AFC in the prediction of poor or high ovarian response, with an estimated correlation of the AUCs to predict poor response/not poor response or high response/not high response of 0.4 and a power of 80%. In view of the lack of published information on this ethnic group, the estimated correlation of 0.4 was based on an analysis of previous data, obtained from 1200 patients treated at the study institution during 2011 and who underwent AMH, FSH and AFC measurement. The minimum sample size required was 410 patients treated for one ART cycle. However, as different initial doses of rFSH were applied in patients aged <36 years and ≥ 36 years, 410 patients were included in each age group, thus the total patient population recruited was 820.
Data were analyzed using SAS (Version 9.3, Cary, NC, USA). All analyses were performed on the intention-to-treat population. Continuous data are presented as mean ± standard deviation (SD) or median and interquartile range (IQR); categorical data were presented as frequencies and percentages. Differences between groups classified by ovarian response (poor, normal or high) were evaluated using Pearson Chi-squared test for the rates; t-test was used to test between two means.
Intra-class correlation coefficients (ICC) (two-way mixed model) were used to compare values obtained for AFC, AMH and AFC between the two laboratories/doctors (i.e. AMH-lab 1 vs AMH-lab 2, FSH-lab 1 vs FSH-lab 2, AFC-doctor 1 vs AFC-doctor 2) to evaluate the reliability of the tests. A p-value of <0.05 was defined as statistically significant for comparisons between the two patient age groups and when choosing covariates for models.
Logistic regression was used to predict the chance of being a poor or high responder. The discrimination attained between the possible covariates was evaluated with ROC analysis. ROC curves were obtained for each model and compared using the method described by DeLong et al. [15].
833 patients were screened and found eligible, resulting in 820 allocated to participate in the study (Figure 1). Demographic and clinical data at baseline, including basal AFC, AMH and FSH are shown in Table 1. All three ovarian response tests demonstrated good reliability (ICC values of >0.8) between the test results analysed at the two laboratories and AFC measurements between doctors. Average ICC values (95% confidence interval [CI]) were 0.94 (0.94, 0.95) for AMH, 0.97 (0.97, 0.98) for FSH and 0.91 (0.90, 0.92) for AFC. In view of the high consistency between test results analyzed at the two laboratories or by the two doctors, the results of AMH and FSH from one laboratory (lab 1) and one doctor (doctor 1) were used in the analyses. Lab 1 is the central diagnostic laboratory in Ho Chi Minh City and serves many IVF centres in the region therefore making the results more widely applicable and doctor 1 had the most clinical experience. This approach provides a more accurate reflection of routine clinical practice.
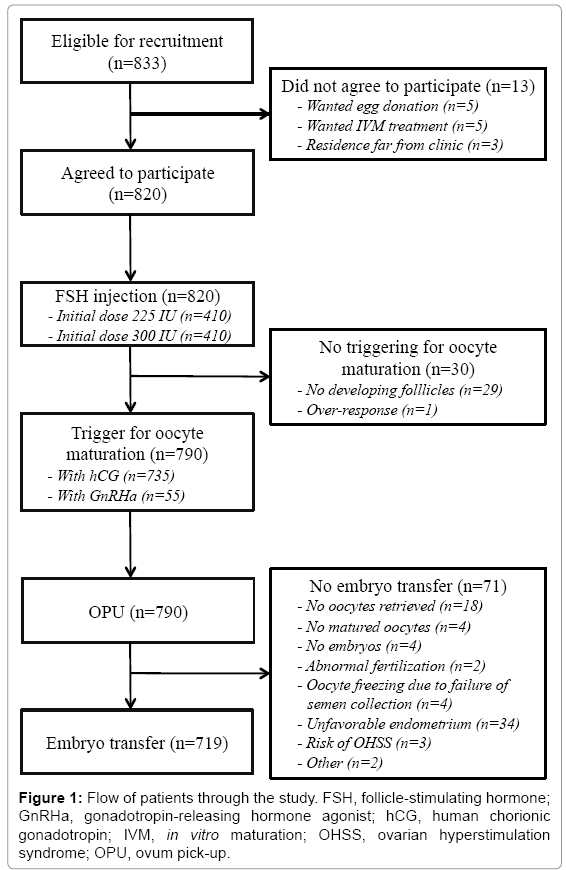
Figure 1: Flow of patients through the study. FSH, follicle-stimulating hormone; GnRHa, gonadotropin-releasing hormone agonist; hCG, human chorionic gonadotropin; IVM, in vitro maturation; OHSS, ovarian hyperstimulation syndrome; OPU, ovum pick-up.
| Patients (n=820) | |
|---|---|
| Age, years | 34.3 ± 5.2 (19–45) |
| Body mass index, kg/m2 | 20.96 ± 1.95 (15.2–25.0) |
| Duration of infertility, months | 63.4 ± 49.6 |
| Infertility factor, n (%) | |
| Age | 85 (10.4) |
| Male | 353 (43.0) |
| Tubal | 182 (22.2) |
| Unexplained (n,%) | 129 (15.7) |
| Other | 71 (8.7) |
| Infertility type, n (%) | |
| Primary | 454 (55.4) |
| Secondary | 366 (44.6) |
| AFC, n | |
| Doctor 1 | 10.31±6.62 (1–46) |
| Doctor 2 | 9.34±5.78 (1–31) |
| FSH, IU/L | |
| Lab 1 | 8.0±4.01 (0.10–52.14) |
| Lab 2 | 7.8±3.67 (0.36–40.15) |
| AMH, ng/mL | |
| Lab 1 | 2.8±2.45 (0.08–18.53) |
| Lab 2 | 3.01±2.55 (0.08–15.44) |
Values are mean ± standard deviation (range), or number of patients (percentage). AFC- antral follicle count; AMH- anti-Müllerian hormone; FSH- follicle-stimulating hormone
Table 1: Baseline demographics and patient characteristics.
Ovarian stimulation outcomes
Ovarian stimulation characteristics and cycle outcomes are shown in Table 2.
| Variable | Patients undergoing COS (n=820) |
|---|---|
| Ovarian stimulation, days | 8.96±1.4 (5–14) |
| Total FSH dose, IU | 2344±513.9 (1125–4200) |
| Follicles ≥14 mm*, n | 9.13±6.02 (1–31) |
| GnRHa trigger, n (%) | 55 (6.9) |
| hCG trigger, n (%) | 735 (93.1) |
| Cancellation due to under-response, cycles, n (%) | 29 (3.5) |
| Cancellation due to over-response, cycles, n (%) | 1 (0.1) |
| Patients with oocytes retrieved, n (%) | 790 (96.3) |
| Poor response, n (%) | 113 (14.3) |
| High response, n (%) | 172 (21.8) |
| Estradiol*, pmol/L | 4352±4127 (50–25,860) |
| Progesterone*, ng/mL | 1.04±2.39 (0.03–34.39) |
| Luteinizing hormone*, IU/L | 2.91±3.05 (0.10–41.40) |
| Oocytes retrieved† per trigger, n (range) | 10.48±6.80 (0–37) |
| OHSS, n | 4 |
| Mild | 2 |
| Moderate | 2 |
| Clinical pregnancies† per oocyte retrieval, n (%) | 226/790 (28.6) |
| Ongoing pregnancies† per oocyte retrieval, n (%) | 209/790 (26.5) |
Values are mean ± standard deviation (range), or number of patients (percentage). *On day of hCG administration or cancellation day; †Values relative to the number of patients with oocyte retrieval
Table 2: Ovarian stimulation and cycle outcomes.
Predicting poor ovarian response
Patient and stimulation characteristics (n=790 which represents those patients who had either hCG or GnRH agonist to trigger final follicular maturation) by ovarian response category are shown in Table 3. The ROC curves for AMH, AFC and FSH are shown in Figure 2A. AMH had the highest accuracy for predicting poor response (AUC 0.93, 95% CI 0.90, 0.95), and was significantly better than AFC (AUC 0.89, 95% CI 0.86, 0.92; p<0.008), and both AMH and AFC were significantly better than FSH (AUC 0.75, 95% CI 0.69, 0.81; p<0.001 vs AMH and AFC). An AMH cut off value of ≤ 1.25 ng/mL had sensitivity of 86.7%, specificity of 84.8%, positive predictive value (PPV) of 48.7%, negative predictive value (NPV) of 97.5%, positive likelihood ratio (LR+) of 5.70 and negative likelihood ratio (LR–) of 0.76. Corresponding values for an AFC of ≤ 5 were 78.8%, 86.0%, 48.4%, 96.0%, 5.61 and 0.25, and for an FSH cut-off of >8.94 IU/mL were 57.5%, 85.4%, 39.6%, 92.3%, 3.93 and 0.50. Thus, an AMH level of ≤ 1.25 ng/mL had the best sensitivity and specificity for predicting poor ovarian response.
| Overall (n=790) | Poor response (n=113) | Normal response (n=505) | High response (n=172) | p-value | ||
|---|---|---|---|---|---|---|
| Poor vs normal/high | High vs normal/poor | |||||
| Age, years | 34.9±5.0 | 38.5±4.1 | 35.1±4.7 | 31.8±4.5 | 0.01a | 0.01a |
| BMI, kg/m2 | 20.9±1.9 | 21.5±1.9 | 20.5±2.1 | 20.5±2.1 | 0.01a | 0.01a |
| Duration of infertility, months | 62.9±49.6 | 65.5±55.9 | 64.6±50.3 | 56.3±42.5 | 0.77a | 0.77a |
| Type of infertility, n (%) | 0.25b | 0.04b | ||||
| Primary | 438 (55.4) | 57 (13.1) | 274 (62.5) | 107 (24.4) | ||
| Secondary | 352 (44.6) | 56 (15.9) | 231 (65.6) | 65 (18.5) | ||
| Indication for IVF, n (%) | 0.01b | 0.01b | ||||
| Advanced age | 75 (9.5) | 35 (46.7) | 37 (49.3) | 3 (4.0) | ||
| Male factor | 345 (43.7) | 35 (10.1) | 216 (62.6) | 94 (27.2) | ||
| Tubal diseases | 177 (22.4) | 15 (8.5) | 121 (68.4) | 41 (23.2) | ||
| Unexplained | 129 (16.3) | 15 (11.6) | 91 (70.5) | 23 (17.8) | ||
| Other | 64 (8.1) | 13 (20.3) | 40 (62.5) | 23 (17.8) | ||
| Duration of stimulation, days | 9.0±1.4 | 9.0±2.0 | 8.9±1.3 | 9.0±1.2 | 0.74a | 0.75a |
| Total rFSH dose, IU* | 2343±513 | 2569±611 | 2357±505 | 2154±388 | 0.01a | 0.01a |
| Follicles ≥14mm, n | 9.1±6.0 | 2.9±2.2 | 8.0±4.0 | 16.7±5.4 | 0.01a | 0.01a |
| AMH, ng/mL | 3.1±2.5 | 0.7±0.8 | 2.7±1.7 | 6.0±2.7 | 0.01a | 0.01a |
| FSH, IU/L | 7.6±3.1 | 10.8±5.1 | 7.3±2.3 | 6.0±1.5 | 0.01a | 0.01a |
| AFC | 10.5±6.5 | 4.4±2.8 | 9.6±4.9 | 17.2±6.7 | 0.01a | 0.01a |
Values are mean ± standard deviation, or number of patients (percentage).
aStudent t-test; bPearson's Chi-squared test.
Poor response, ≤3 oocytes; Normal response, 4-15 oocytes; High response, >15 oocytes.
AFC, antral follicle count; AMH, anti-Müllerian hormone; BMI, body mass index; IVF, in vitro fertilization; rFSH, recombinant follicle stimulating hormone.
Table 3: Patient and stimulation characteristics by ovarian response category for cycles in which ovum pick-up was completed.
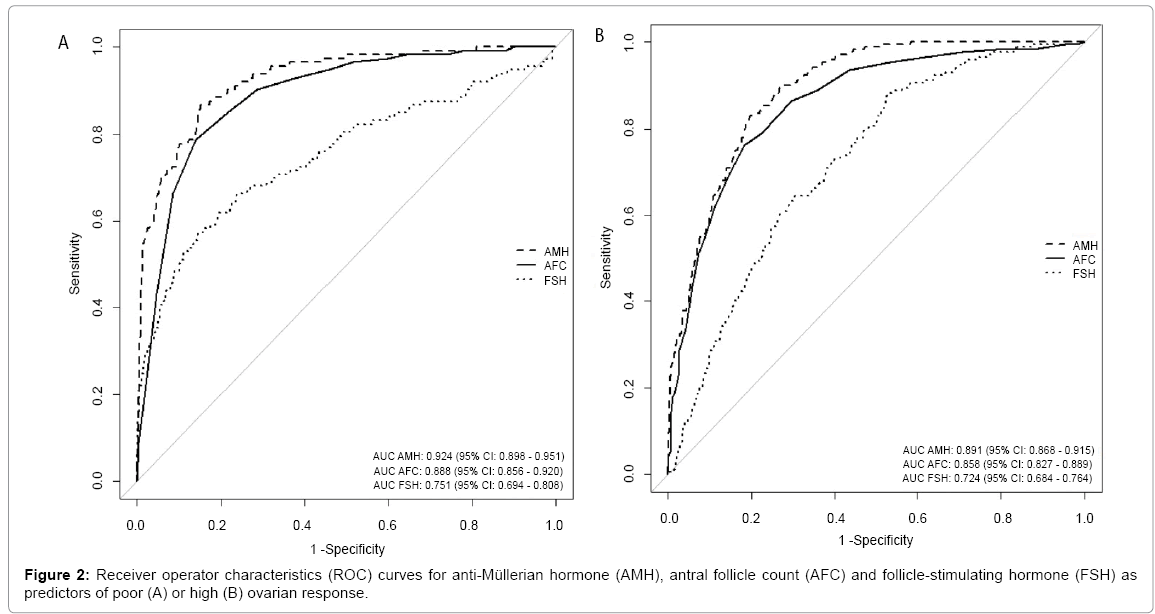
Figure 2: Receiver operator characteristics (ROC) curves for anti-Müllerian hormone (AMH), antral follicle count (AFC) and follicle-stimulating hormone (FSH) as predictors of poor (A) or high (B) ovarian response.
Predicting high ovarian response
Patient and stimulation characteristics by ovarian response category are shown in Table 3. The ROC curves for AMH, AFC and FSH are shown in Figure 2B. AMH also had the highest accuracy for predicting high ovarian response (AUC 0.89, 95% CI 0.87, 0.92), and was significantly better than AFC (AUC 0.86, 95% CI 0.83, 0.89; p=0.03), and both AMH and AFC were significantly better than FSH (AUC 0.72, 95% CI 0.69, 0.76; p<0.001 vs AMH and AFC). An AMH cut off value of >3.57 ng/mL had sensitivity of 83.7%, specificity of 79.8%, PPV of 53.6%, NPV of 94.6%, LR+ of 4.14 and LR– of 0.20. Corresponding values for an AFC of ≥ 12 were 79.2%, 81.7%, 53.7%, 92.5%, 4.17 and 0.29, and for an FSH cut-off of ≤ 7.36 IU/mL were 88.4%, 46.9%, 31.7%, 93.5%, 1.67 and 0.25. Thus, an AMH level of >3.57 ng/mL had the best combined sensitivity and specificity for predicting high ovarian response.
Models for predicting poor and high ovarian response
Univariate analysis was performed and significant parameters for predicting poor and high ovarian response identified. Age, BMI, indication for IVF, total dose of FSH used and ovarian reserve tests (AMH, basal FSH and AFC) were significant predictors of poor response. Age, BMI, indication for IVF, duration of infertility, types of infertility, total dose of FSH used and ovarian reserve tests (AMH, basal FSH and AFC) were significant predictors of high ovarian response.
Multivariate logistic regression revealed no multicollinearity existed between the variables included in the model. Only AMH and AFC qualified to stay in the model as independent predictors of poor or high ovarian response. The adjusted odds ratio (OR) of having a poor ovarian response based on AMH was 0.25 (95% confidence interval [CI] 0.16, 0.41; p<0.001). For AFC, the OR of having a poor ovarian response was 0.83 (95% CI 0.73, 0.94; p=0.004).
The adjusted odds ratio (OR) of having a high ovarian response based on AMH was 1.70 (95% CI 1.48, 1.95; p<0.001) and based on AFC was 1.09 (95% CI 1.03, 1.14; p<0.001).
For prediction of poor ovarian response, a model including AMH+AFC (AUC 0.93, 95% CI 0.91, 0.96) was equivalent to one using AMH only (AUC 0.92, 95% CI 0.90, 0.95; p=0.131), whilst both were better than AFC alone (AUC 0.89, 95% CI 0.86, 0.92; p<0.001). The logistic regression equation for poor response according to the model AMH+AFC was z = 2.0139–1.5508*AMH–0.2378*AFC.
When looking at high ovarian response, the combined parameters (AUC 0.90, 95% CI 0.88, 0.92) were better than AMH alone (AUC 0.89, 95% CI 0.87, 0.91; p=0.03), and AMH+AFC and AMH were better than AFC alone (AUC 0.86, 95% CI 0.83, 0.89; p<0.001). The AMH+AFC model-based logistic regression equation for high response was z = –4.67 + 0.53*AMH + 0.11*AFC.
Model calibration
ROC curves for models predicting poor and high response using AMH+AFC are shown in Figure 3. The calibration plots for both poor and high ovarian responses showed good agreement between predicted and observed percentages, with the exception of one outlier in the high response analysis (Figure 4).
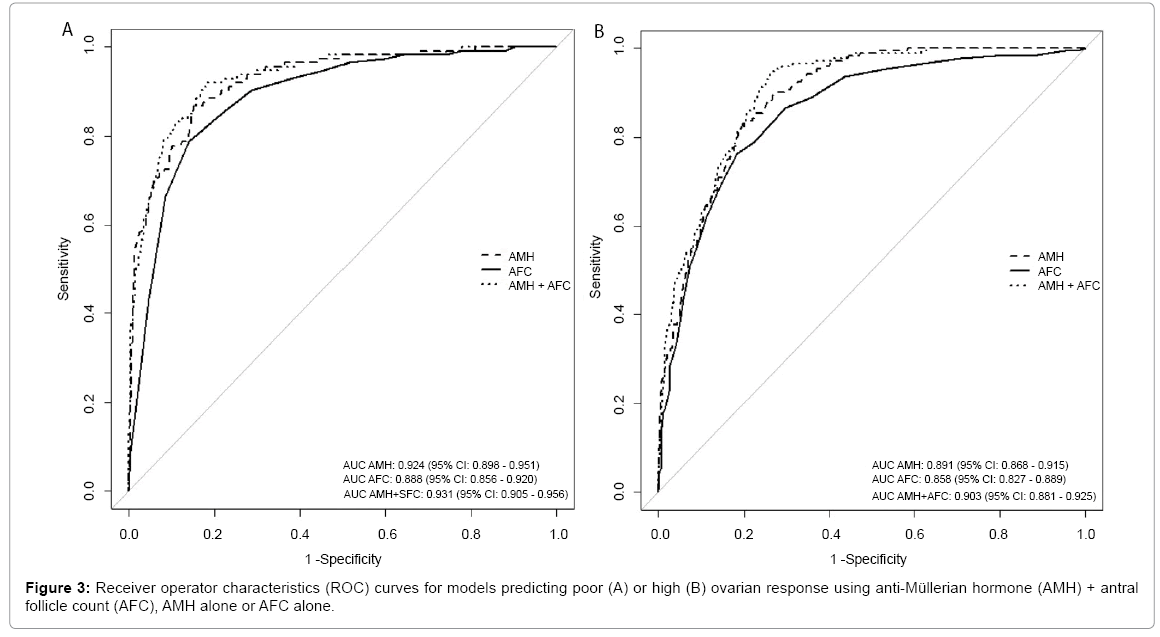
Figure 3: Receiver operator characteristics (ROC) curves for models predicting poor (A) or high (B) ovarian response using anti-Müllerian hormone (AMH) + antral follicle count (AFC), AMH alone or AFC alone.
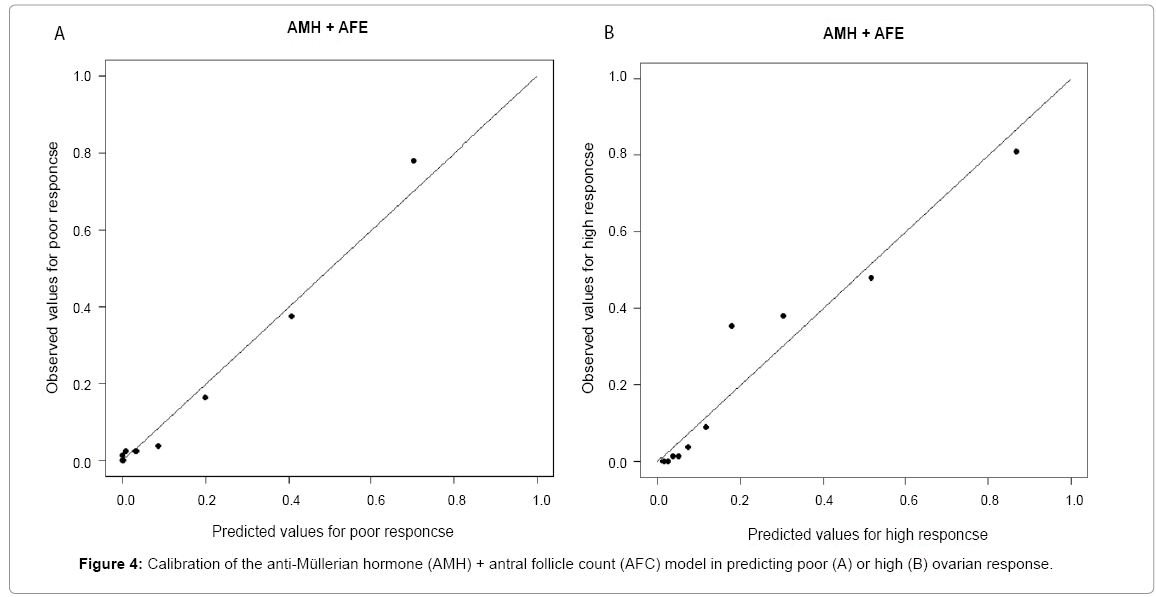
Figure 4: Calibration of the anti-Müllerian hormone (AMH) + antral follicle count (AFC) model in predicting poor (A) or high (B) ovarian response.
The results of this prospective study demonstrated that, overall, AMH is the best predictor of ovarian response in Vietnamese infertile women undergoing COS using a GnRH antagonist protocol. FSH was the least useful of the biomarkers studied.
Our findings are in agreement with previous studies showing that AMH is a good predictor of ovarian response in GnRH antagonist cycles, and better than other parameters, including AFC, FSH and inhibin B [3-6,16]. Nevertheless, there are some important differences between the results of our study and those of the most recent clinical study, which was conducted in European women [5]. Hamdine et al. [5] concluded that AMH was a better predictor of high ovarian response than poor ovarian response (AUC prediction model values of 0.87 and 0.79, respectively). The AMH AUC value for high ovarian response from our prediction model utilizing data from Vietnamese women was almost identical (0.89) to the previous study, but the prediction model AUC value for poor response was found to be higher (0.92). We also looked at additional biomarkers and were able to demonstrate that AMH + AFC had an equivalent value to AMH for predicting poor ovarian response (AUC 0.93), but provided significantly better prediction of high ovarian response (AUC 0.90; p<0.03 vs AMH alone). This contrasts with an analysis of data from two clinical trials looking at prediction of ovarian reserve during COS with GnRH agonist or antagonist protocols which showed no value of adding AFC to AMH in prediction models [16]. This difference may be attributable in part to the fact that the previous reports were taken from data obtained from multiple sites, resulting in greater heterogeneity compared with the current study (2 sites with both doctors using the same measurement procedures). However, our finding that AMH performed better than AFC as a predictor of poor and high ovarian response is in accordance with the results of a meta-analysis, the authors of which concluded that AMH is a more accurate and robust biomarker of ovarian response [17]. Along with age, FSH, luteinizing hormone (LH) and AFC were included in a model that was able to predict ovarian response in patients undergoing GnRH antagonist-based COS, but AMH was not assessed [18].
Definitions of poor, normal and high ovarian response used in the current study were the same as those reported by Hamdine et al. [5]. Differing definitions for this important endpoint can affect study results. Lower AUC values for AMH (0.82 and 0.80, respectively) were reported when high response definitions of >18 and >20 oocytes were used [3,6]. When poor response was defined as <6 oocytes, the AUC for AMH was slightly lower (0.88) [3].
Although a different definition of high ovarian response was used (>20 oocytes), the results of a European study by Polyzos and colleagues were very similar to ours. In both studies, AMH and AFC were the only variables to remain in the model as independent predictors of poor or high ovarian response. They reported that the optimal threshold for identifying patients with poor ovarian response (≤3 oocytes) was 1.37 ng/mL (sensitivity 74.1% and specificity 77.5%) [6], slightly higher than our threshold of 1.25 ng/mL, which had better sensitivity (86.7%) and specificity (84.8%). For AFC and poor response, Polyzos et al reported that an AFC threshold of 8 had sensitivity of 72.2% and specificity of 84.6% [6]. In our study, an AFC cut-off value of 5 had better sensitivity (78.7%) and specificity (86.0%) for prediction of poor ovarian response. Comparison between cut-off values for predicting high ovarian response is less valid given the different definitions used for this parameter in the two studies. However, AMH cut-off values were similar (3.52 ng/mL vs 3.57 ng/mL in our study; sensitivity 89.5% vs 83.7% and specificity 89.5% vs 79.77%) whereas the AFC cut-off was higher (16 vs 12; sensitivity 80% vs 79.2% and specificity 84.5% vs 81.7%). The differences between studies in the results observed could be due to different study designs and the patient selection bias issues inherent in the retrospective study design used by Polyzos et al compared with the prospective design of our study, and/or the differences could be due to the difference in ethnicities between the study populations.
As for FSH, other studies (Arce et al [4]) have found that this was significantly less useful than AMH as a predictor of ovarian response during GnRH antagonist-based COS. Using the same definitions of poor and high ovarian response as the current study, ROC AUC values for FSH as a predictor were significantly lower than those for AMH, and the combination of AMH and FSH was not significantly better than AMH alone [4]. Unlike the current results, AFC was not correlated with oocyte yield and FSH was better than AFC [4]. A study by Andersen et al [3] reported that the best predictive model of ovarian response included both AMH and basal FSH determined at the early follicular phase of the stimulation cycle, although AMH was the only predictive factor across all models regardless of the cycle or treatment group [3]. In addition, AMH showed less inter-cycle variability. AFC was identified as a predictor of the number of follicles ≥11 mm on the day of hCG, but variability between different ultrasound operators at different study centers was cited as an issue with this test [3]. This inconsistency in determination of AFC may have also contributed to the lack of association between AFC and oocyte yield in the study by Arce et al. [4].
In the current study, AFC was determined by two different doctors and the two assessments showed good consistency. There was also good concurrence between AMH and FSH levels measured at the two different laboratories. That being the case, the use of test results from lab 2 and doctor 2 would have had no effect on the final study conclusions (data not shown). The test with the highest ICC was FSH, followed by AMH and then AFC. FSH has been historically used as a marker of ovarian response for a long time, and its measurement is well standardized [19]. In contrast, measurement of AMH is more variable, with different values generated by different assays [1], and lack of stability under some storage or assay conditions [20]. In addition, there is a lack of consensus about clinical cut-off values [21]. As a result, rapid expansion of the clinical use of AMH as a marker of ovarian response needs to take into account measurement variability and the European Society of Human Reproduction and Embryology (ESHRE) has stated that improved assay validity and an international standard for AMH are urgently needed so that the clinical utility of this promising ovarian response biomarker can be maximized [22]. It has been suggested that because of the lack of standardization in AMH assays, each laboratory should have their own cut-off value for use in their specific clinical setting [17]. Determining the most appropriate cutoff values for our Vietnamese population was an important aim of this study. Fully-automated AMH assays are currently under development, and commercial availability of such options would allow technical standardization of AMH determination globally, further improving AMH utility in daily practice. Reliable determination of AFC may also be difficult, particularly when using standard two-dimensional or three-dimensional (3D) transvaginal ultrasound [23]. Use of a new 3D automated follicular tracking ultrasound technique has been shown to markedly decrease intra- and inter-individual variations in determining AFC [24,25] and may improve the consistency and utility of AFC measurements in the future, but this technology is expensive and requires off-line analysis.
Previous studies comparing the utility of AMH, AFC and FSH for the prediction of ovarian response have used measurements from a single laboratory and/or doctor, and there has been no assessment of the reliability or consistency of the levels or counts reported. Utilisation of two laboratories/doctors in this study and confirmation of consistency across all measurements is a significant strength of this study. Others include the study’s prospective design, the large sample size (n=820), a low rate of non-participation (1.5%) and complete follow-up data for all patients. Furthermore, by keeping the dose of rFSH constant during the study we eliminated any influence of FSH dose on the ovarian response. All of these factors improve the validity and reliability of our results.
This study did however have some limitations. Patients with a high BMI, PCOS or endometrioma were excluded to control for confounding variables that might have affected the ovarian response. This means that the results cannot be generalized to these patient groups. In addition, the data reported are applicable to the Vietnamese population in which they were obtained but may not be representative of the situation for other ethnicities, although results do appear to be similar across the different patient groups. In addition, investigation of ovarian response predictors across a variety of ethnic populations undergoing COS is important. Finally, prediction of ovarian response is about the quality, not quantity, of oocytes. While AMH and AFC have been shown to provide useful information for predicting ovarian response, they appear to be of less value in predicting live birth rate [26]. There are a number of factors that determine the chance of pregnancy other than ovarian response, including embryo quality, transfer technique and endometrial receptivity, which may be why tests for ovarian response may not be sensitive enough to predict pregnancy outcome after IVF [26]. Patients with very low ovarian reserve may still become pregnant, and those with high ovarian reserve might not achieve ongoing pregnancy. Nevertheless, previous studies where COS has been tailored based on markers of ovarian response suggests that outcomes are improved and the incidence of low and high response reduced compared with standard treatment [27,28]. The inclusion of data on oocyte quality, oocyte outcome after fertilization and live birth rate would have added value to this study.
Taken together, currently available data indicate that AMH is a useful predictor of ovarian response in women undergoing GnRH antagonist COS for ART, and that this provides better qualitative information than the alternatives, including AFC and FSH. The results of the current study confirmed results obtained in populations of other ethnicities that AMH is the best marker and AMH+AFC is the best model for predicting poor and high ovarian response. The only differences were in the cut-off values, which could vary for a number of reasons, including patient characteristics (including ethnicity), assays used to measure AMH and FSH, and techniques used to determine AFC. The specific influence of ethnicity on the usefulness of AMH as a predictor of ovarian response and the most appropriate cut-off values needs to be addressed in future studies, using standardized and consistent testing procedures, and adjusting for age, BMI, smoking, ovarian stimulation protocol and FSH doses. In conclusion, the results of this study provide guidance on the use of ovarian response biomarkers for clinical management of the ART cycle to optimize outcome, including reducing cycle cancellation and complications such as OHSS, and indicate that results are generally similar in patients of Vietnamese ethnicity compared with previous studies in primarily Caucasian populations. AMH seems to be the best predictor for both low and high ovarian response in GnRH antagonist cycles, while a model including AMH+AFC had the highest predictive value for high ovarian responses.
The author would like to thank Nicola Ryan, independent medical writer for her English medical writing assistance and Colin M Howles, PhD, ARIES Consulting Sarl, Geneva, Switzerland for his input into the preparation of the manuscript.