Journal of Pollution Effects & Control
Open Access
ISSN: 2375-4397
ISSN: 2375-4397
Research Article - (2016) Volume 4, Issue 3
Best strategies are required to mineralize the extending number of contaminants at low spotlights on the water environment using advanced oxidation process. Phenols, pesticides, composts, chemicals, and other synthetic materials are disposed of direct into nature. Ozonation of refractory aromatic compound p-nitrophenol (PNP) in waste water has been studied in the pH range 4.5-9.2. Ozonation is a straightforward process which can be used for clearing of the phenol at the contaminant destinations or even refinement of defiled water gathered post transfer. Thus, this experimental work provides a solution for pre as well as post disposal removal of nitrophenols. The examination work was finished in a uniformly stirred reactor. Uniform stream of ozone gas and uniform blending was guaranteed, utilizing a polymeric diffuser. The oxidative degradation using O3 was carried out after adjusting the initial pH at room temperature. The degradation rate is found to be optimum (99.95%) at pH 9.2 as a sharp decline in concentration of the substrate was found. The order of reaction was found to be first order at pH values 7 and 9.2, and fractional order (1.5) at pH 4.5. The amount of nitrates formed was also found out. A decrease in the pH value and an increase in the conductivity were also observed, which confirms the formation of acidic by-products.
Keywords: Ozonation; p-nitrophenol (PNP); Nitrates; pH; Conductivity; Order of reaction
UV: Ultraviolet; O.D: Optical Density; PNP: Paranitrophenol; [C]o: Initial Concentration of the Substrate; [C]: Final Concentration of the Substrate; CODo: Initial COD; COD: Final COD
λ- Wavelength
ε- Molar extinction coefficient
The fundamental purpose of the present investigation is the establishment of an optimum pH for the reaction of ozone with phenols. The studies is carried out using p-nitrophenol as a model compound. Discharge of phenolic waste causes serious effects when water from receiving bodies is employed in industrial and domestic applications. Technologies such as chlorination, activated charcoal adsorption, coagulation etc. are used for the removal of such pollutants but all these technologies have certain limitations [1]. In case of activated charcoal adsorption, the process is slow and generates large amount of used adsorbent as secondary pollution. The used carbon must be regenerated periodically so as to make the process cost effective. Chemical processes like chlorination may lead to the formation of more dangerous chloro derivatives and hence for complete removal of the pollutants more attractive alternatives must be explored.
Advanced oxidation techniques therefore emerge as an important treatment technique for the removal of such phenolics. Ozonation is one among the widely investigated advanced oxidation technologies (AOT) for treating contaminated waters [2,3].
The processes commonly called as advanced oxidation processes (AOPs), involve the generation of hydroxyl (OH) free radicals, which oxidize the chemical pollutant that are present in wastewater [4]. In our present study oxidation of the hazardous and refractory aromatic compound p-nitrophenol (PNP) in aqueous solution by very strong oxidizer ozone was investigated. Compared to chlorine ozone is 50% stronger oxidizer and acts over 3,000 times faster. It constantly tries to get rid of one oxygen atom, O3 → O2+O, which allows it to react with almost anything it encounters.
If an ozonation study in aqueous solution of a reactant species is carried out, in addition to the O3 molecule and the reactant molecule the degradation products of the latter are also found. Ozone degradation is catalyzed mainly by OH-ions. In high pH values, or more precisely, a high concentration of OH-ions, is effective in breaking down of many organic species. The mode of hydroxyl ion action is usually, attack at the polar bonds, resulting in the breaking, hydrolysis, and/or elimination reactions. The critical pH value at which O3 -decomposition predominates, depends on the rate at which ozone reacts directly with the OH-ion and on the rate of reaction with organic compounds and their oxidation products [5]. Possible reaction paths for the hydroxylation of p-nitrophenol and the primary intermediates formed can be given as Figure 1 [6].
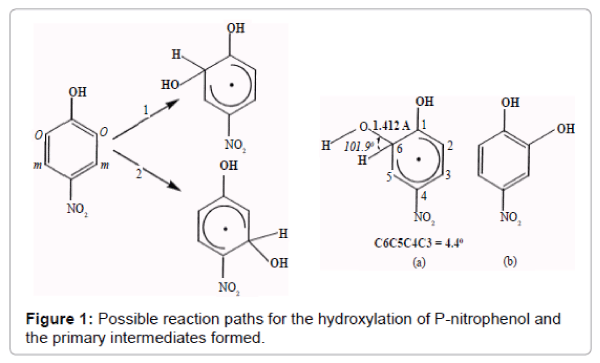
Figure 1: Possible reaction paths for the hydroxylation of P-nitrophenol and the primary intermediates formed.
The hydroxyl ion reacts with ozone to form the hydrogen peroxide ion HO2-. HO2- is the conjugate base of H2O2 and at pH lower than 11.6 (which is the pKa of H2O2) will be predominantly converted to H2O2. Therefore, high pH catalyses the formation of H2O2, which is a source of hydroxyl radicals. The process can be shown as:
Few researchers have considered studying degradation of nitrophenol priority pollutant [7] particularly using oxidative degradation using ozone. In this work a trial has been made to optimize the pH value in which ozone can be used as an oxidant for the degradation of p-nitrophenol. Efforts are made to achieve maximum degradation at a minimum possible time.
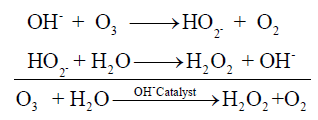
Ozone was produced using an ozone generator in which high voltage is generated with a high quality ferrite core transformer. The ozone cells are fabricated from high-grade stainless steel. The dielectric used is 99.99% pure quartz glass. The output gas of the generator contains 61.1295 mg/l ozone. The generator was fed with an inlet of 6.5196 l/min of air using an aerator. The ozone generated is directly fed to the reactor. The total volume of the solution taken in the reactor was 750 ml. Uniform stirring of the solution and distribution of ozone gas was ensured using a polymeric diffuser. The exit gas from the reactor was fed to the iodine wash bottle (Figure 2).
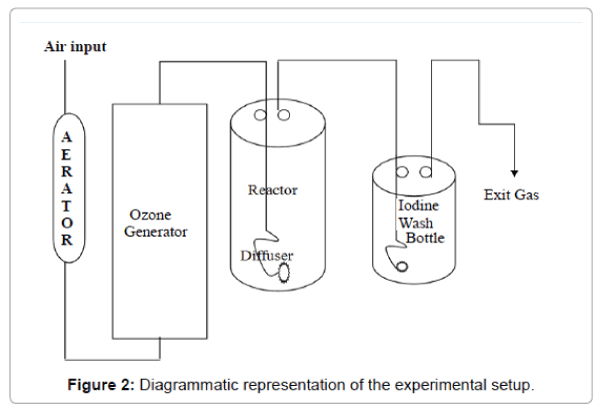
Figure 2: Diagrammatic representation of the experimental setup.
The amount of ozone in the input and exit gas was found out by iodometric method [8]. Synthetic wastewater containing 2.2×10⁻⁴ mol/L solution of PNP in distilled water was used in this study. The initial pH of the solution was maintained using phosphate buffer. 750 ml of this synthetic wastewater was taken in the reactor and ozonation was carried out. The exit gas was trapped in potassium iodide solution in order to find out the amount of ozone in it (Table 1). The temperature of the solution was maintained between 30°C ± 2°C.
| pH value | Ozone consumed in mg/l |
|---|---|
| 4.5 | 63.48 |
| 7 | 65.115 |
| 9.2 | 71.607 |
Table 1: Amount of Ozone consumed by PNP solution at different pH.
P-nitro phenol shows a strong absorption peak in the UV region at 318 nm and has very high molar extinction coefficient (ε). The UV spectrophotometric method was used for measurement of PNP concentration in aqueous solution. A GBC UV/Visible 911A Spectrophotometer was used for this purpose. A calibration plot between absorbance and concentration of PNP was plotted experimentally at pH-values 4.5, 7, 9.2 (At λ=318 nm). The amount of nitrates present in the final solution after degradation was found out by UV spectrophotometric method. A calibration plot between absorbance and concentration of nitrates (mg/l) was plotted experimentally, which gave a high linear regression coefficient of 0.99 at 220 nm (Figure 3).
Figure 3: Calibration curve for nitrates.
The result of ozonation experiments performed at different pHs are reported in Figure 4. In the pH range 4.2-9.5, the system reactivity increases with increasing pH. At pH 9.2 the reduction percentage of Substrate concentration is found to be highest. Also the COD/CODo value is also found at pH 4.5, 7.0 and 9.2 (Table 2). Since the direct ionic attack of ozone to aromatic substrates develops through an electrophilic mechanism, it is evident that higher the concentration of phenate-like form, higher is the reactivity [9].
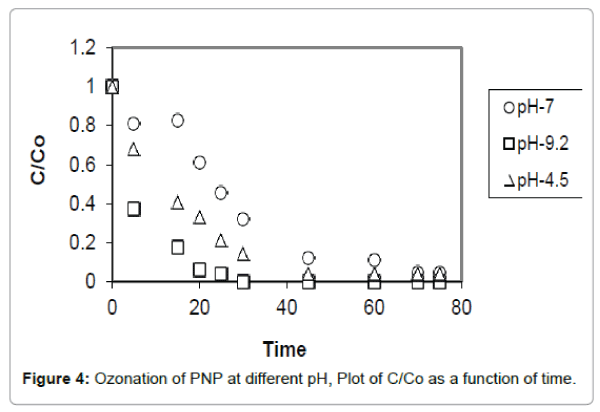
Figure 4: Ozonation of PNP at different pH, Plot of C/Co as a function of time.
| pH value | %Reduction in concentration | COD/CODo |
|---|---|---|
| 4.5 | 96.1682 (60 minutes) | 9.667 |
| 7 | 95.22 (75 minutes) | 9.785 |
| 9.2 | 99.95 (45 minutes) | 8.486 |
Table 2: Concentration and COD reduction of 2,4D under different pH conditions.
The degradation by-products of ozonation are smaller fragments, in which higher percentage of oxygen appears in the form of alcohols, carboxylic acids etc. [9]. The ozonation by products of p-nitrophenol are nitrates, pyrocetechol, hydroquinone, resorcinol, muconic acid, oxalic acid, formic acid, gyoxylic acid, formaldehyde, hydrogen peroxide etc. [10]. The amount of nitrates formed was quantitatively found to be 11.86 mg/l, 11.45 mg/l,12.16 mg/l for pH 4.5, 7.0, 9.2 respectively. Further studies based on the present work include the use of advanced analytical techniques to identify the intermediate and by-products of the reaction which will help in explaining the reaction mechanism.
Reaction kinetics
It is a well-established fact that in batch-type reaction systems, in which an oxidizable solute is reacted, the reaction kinetics is of the first order in reactants, solute and oxidant (ozone). In practice, this concept holds for the initial reaction velocity constants as well as the reaction of single organic products with “residual ozone”. If by-products of the first substrate occur, transiently accumulating in the process, the overall velocity of the ozone consumption decreases with time, followed by significant discrepancies of the first order kinetics. This is mostly the case with model compounds as well as with “natural waters” which contain a mixture of oxidizable substrates [11].
The kinetics of the experiments done were analyzed using the integrated rate expressions. By applying simple first and fractional order equations (Equation 1 and 2) to the results of the current study, it has been observed that a linear plot is obtained [12]. The results are presented in Figures 5-7. From this it is evident that at pH 4.5 the order of the reaction is 1.5 and at pH 7 and 9.2 the order of the reaction is 1. The slope of the best fit line through the data points represents the rate constants for the initial concentration taken.
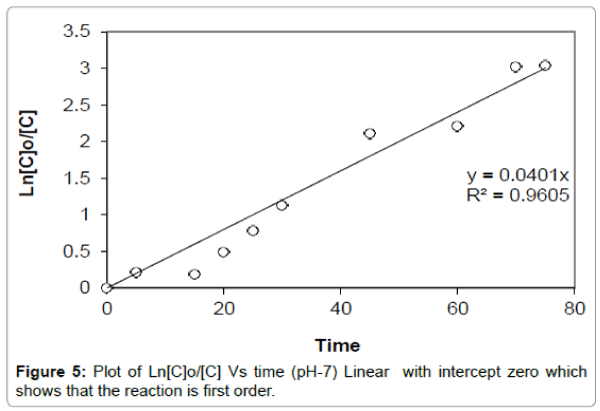
Figure 5: Plot of Ln[C]o/[C] Vs time (pH-7) Linear with intercept zero which shows that the reaction is first order.
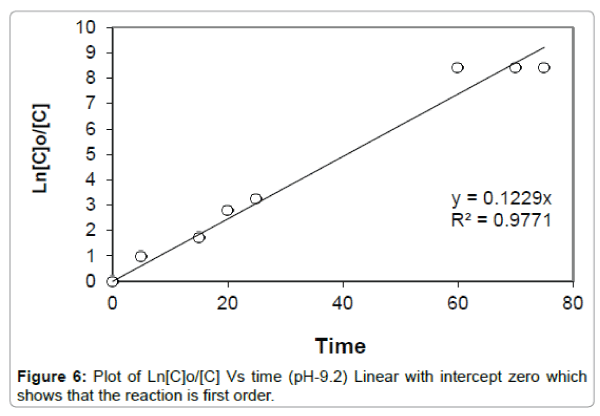
Figure 6: Plot of Ln[C]o/[C] Vs time (pH-9.2) Linear with intercept zero which shows that the reaction is first order.
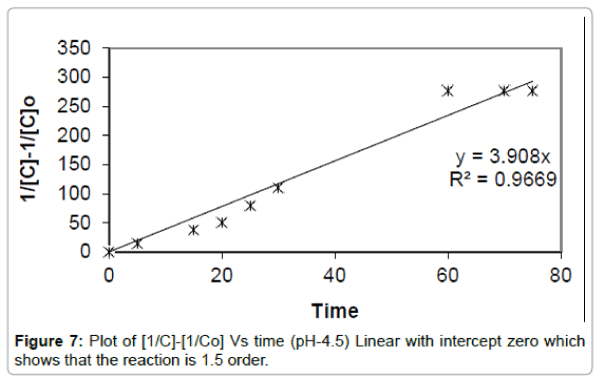
Figure 7: Plot of [1/C]-[1/Co] Vs time (pH-4.5) Linear with intercept zero which shows that the reaction is 1.5 order.
Ln([C]o/[C]) = kt -----------(1) (first order rate equation)
1/[C]1/2-1/([C]o)1/2 = kt -----------(2) (1.5 order rate equation)
Change in pH and conductivity
The pH of the experimental solution decreased as the ozonation proceeded (Figure 8). The conductivity of the solution increased with ozonation time (Figure 9). Both these observations reinforce the literature [10] suggestions that ozonation of p-nitrophenol produces resorcinol, muconic acid, oxalic acid, formic acid, glyoxylic acid and many more lower molecular weight acidic by-products. Since ozone is the oxidant used the degradation products contain more of by-products with oxygen containing functional group like hydroxyl, carboxylic acid which attributes to the acidic nature of the ozonation products. All of these low molecular weight organic acids are readily biodegradable and hence can be removed by simple biochemical post treatment methods. Conductivity studies also supports the removal of nitrates as discussed in the first part of results and discussion.
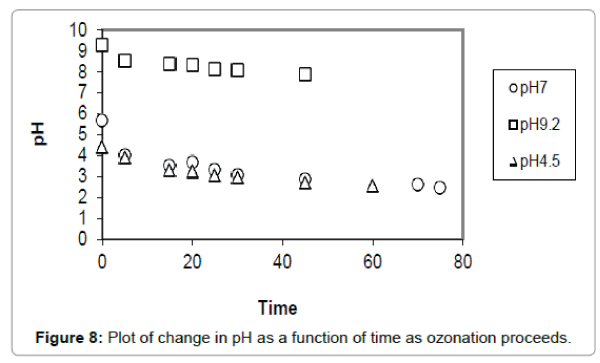
Figure 8: Plot of change in pH as a function of time as ozonation proceeds.
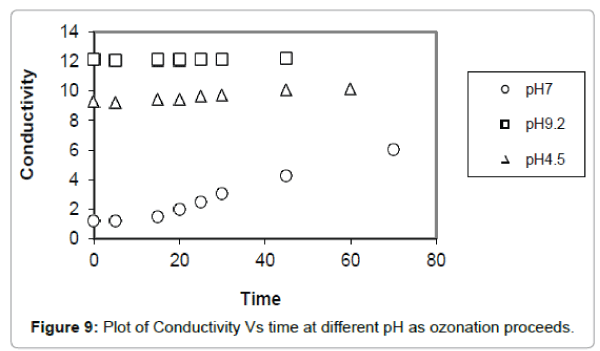
Figure 9: Plot of Conductivity Vs time at different pH as ozonation proceeds.
To understand better the reaction of ozone with substances contained in the water, which by this reaction allows the optimum use in drinking water treatment and wastewater treatment, respectively, it is first necessary to make experiments with model substances in pure solution. It appears from the results elaborated in this work that the pH value plays an important role. With rising pH, the rates of elimination of the aromatic compounds increases and likewise the mineralization of the hetero groups. Thus, if one wishes to compare with each other the results of ozonation reactions as determined by different working groups, indication of the pH is indispensable. Also it is found that the reaction time corresponds to the principle of electrophilic attack of aromatic nucleus, seeing that here the aromatic nucleus is substituted by the electron withdrawing nitro-group the reaction takes place at a slow pace initially. At this initial stage the nitro group may be eliminated and the reaction gains velocity (after 5-10 min).