Fisheries and Aquaculture Journal
Open Access
ISSN: 2150-3508
ISSN: 2150-3508
Research Article - (2023)Volume 14, Issue 1
Species composition, abundance and diversity indices of phytoplankton and zooplankton of three ponds in Chittagong University campus were evaluated for two years period from January 2017 to December 2018. A composition of 12 phytoplankton and 33 zooplankton species were recorded in the entire study area. Analysis cane as phytoplankton and Nullius larva, Brach onus febricula, and Cyclops variants rubella’s as zooplankton were the most dominant species in all the ponds. Phytoplankton and zooplankton abundance during the two years study was almost same. Phytoplankton species belonged to four groups (blue-green algae, green algae, desmids and diatoms,) where blue-green algae occupied the highest position in all the ponds, whereas, the zooplankton species belonged to five groups (cladocera, copepoda, rotifera, protozoa, and nematoda), of which rotifera and copepoda occupied the first and second positions in all the ponds. Species richness (S) of phytoplankton was almost the same in both the years but for zooplankton, species richness was found to be much higher in 2017 (S=30) than in 2018 (S=19). The range of Simpson Diversity index (D) of phytoplankton in the three ponds were found to be 1.362-2.879 and 1.362-2.265, whereas, the range of zooplankton in the three ponds were 6.495-10.05 and 5.372-8.826 during 2017 and 2018 respectively. The Shannon Wiener diversity index (H') of phytoplankton in the three ponds were varied from 0.636 to 1.317 and from 0.235 to 0.9981 and that for zooplankton ranged between 2.229-2.506 and 1.847-2.457 in 2017 and 2018 respectively. According to Simpson and Shannon Wiener’s diversity indices of phytoplankton and zooplankton, the highest diversity was found in pond 2 and the lowest in pond 1. The range of species Evenness (E) of phytoplankton in the three ponds varied from 0.2269-0.6042 and 0.2755-0.3235, and that of zooplankton varied from 0.3608-0.5288 and 0.3816-0.5372 during 2017 and 2018 respectively. The species evenness of phytoplankton and zooplankton indicated pollution in pond 1, where the individuals of the community were not equally distributed than the other two ponds. Pond-1 was found to be polluted due to mass use by the local peoples and draining of surrounding run-off, which should be stopped to keep the water quality in good condition.
Phytoplankton; Zooplankton; Species composition; Abundance; Species diversity indices; Ponds
The monthly fluctuation in ecological factors brings about corresponding fluctuations in the populations of planktons. These fluctuations in plankton populations vary from species to species, place to place even in same species in different places. The frequency prevalence of optimum condition always causes the increase in the number of animals and conversely the frequent recurrence of extreme condition would bring about the decrease in the number of plankton. It acts as the main source of food for most fauna both in lotic and lentic water ecosystems. Plankton is a good indicator of changes in water quality because it is strongly affected by environmental conditions and responds quickly to changes in environmental quality. It is generally accepted that plankton community on which the whole aquatic life depends directly or indirectly is largely governed by the interactions of a number of physical, chemical and biological conditions of the water body [1-5].
Phytoplankton is an essential organism in aquatic ecosystem and in food web, as it provides the food for zooplankton. Phytoplankton’s are vital and important organisms which act as producer to the primary food supply in any aquatic ecosystem. They are the initial biological components from which the energy is transferred to higher organisms through food chain. Phytoplankton plays an important role in aquatic ecosystems as they produce oxygen and food, which sustain all other forms of life, ensuring ecological balance. Phytoplankton communities are influenced by various natural factors like temperature, grazing, nutrients and light etc. The seasonal variation of phytoplankton community in freshwater depends on various physicochemical factors.
The zooplankton communities, very sensitive to environmental modifications, are important indicators for evaluating the ecological status of the aquatic ecosystem. They do not only form an integral part of the lentic community but also contribute significantly to the biological productivity of the fresh water ecosystem. Zooplankton occupies an intermediate position between autotrophs and carnivores. It is an essential component of aquatic biodiversity and it forms an important link in aquatic food web, as it is in the second trophic level as primary consumer, and as contributor to the next trophic level. Zooplankton constitutes an important food item of many omnivorous and carnivorous fishes.
The area of University of Chittagong (CU) is about 1754 acres, situated in the hilly area of Haphazard Upazilla, 25 km North of Cartogram city. Due to insufficient supply of underground water in CU campus, some ponds were excavated in different locations for different uses like bathing, household washing, cooking etc. by the general staffs. The selected three ponds in different areas of CU campus are used in different levels i.e. for highly domestic use, moderate domestic use and very little domestic use. So, it was very important to know the water quality level of these ponds’ water and whether these ponds were suitable for human use [6].
Some limn logical works done on pond water in Bangladesh and India. However, no works were done on the species composition, abundance and diversity of plankton on the three selected ponds at CU campus. Hence, the present study was undertaken to find out the plankton composition, abundance and diversity in three ponds at Chittagong University campus, Bangladesh.
Pond 1 was situated inside the Shove colony of the Chittagong University campus. It is situated in the North-West side of the CU campus (Latitude 22° 483778΄ and Longitude 91° 79082΄) (Figure 1). The average depth of the pond was 3.1 m. It was a rectangular shaped pond which covered an area of 838 sq m. The pond was generally used by the colony people for different purposes including washing, bathing, cooking, fishing etc.

Figure 1: Map showing location of three experimental ponds (Pond 1: Shova colony pond, Pond 2: Gol Pukur and Pond 3: Biological Science Faculty pond) in the Chittagong University campus.
Pond 2 is commonly known as Gol pukur. It is a round shaped pond situated in front of the south campus mosque (Latitude 22° 466205΄ and Longitude 91° 792128΄) (Figure 1). It is one of the oldest ponds of the CU campus, area of which was 1288 m2 and the average depth was 5 m. The pond was mainly used for swimming and other recreational purposes but now a day, it is also used for fish culture [7-12].
Pond 3 was situated near the Biological Science Faculty of CU (Latitude 22° 466197΄and Longitude 91° 781166΄) (Figure 1). It is a rectangular shaped pond, and average depth was 4.2 m with an area of 2632 m2. The pond was mainly used for swimming, bathing, and fishing and by the local farmers for washing their vegetables which are locally produced.
Collection and preservationThe plankton samples were collected monthly from three sites of the three ponds (pond 1, pond 2 and pond 3) between 9.00-11.30 AM during January 2017 to December 2018. The plankton net used for the collection of plankton was made of bolting silk of 55 mesh size. The collected plankton samples were taken in plastic pots and preserved in 5% commercial Formaldehyde. For the identification of the plankton, keys given by APHA (2012), and, were consulted.
Plankton biodiversityThe collected data were processed and analyzed by using computer software’s such as Species Diversity and Richness 4 (SDR, version: 4.1.2), Statistical Package for the Social Sciences (SPSS) and Microsoft Excel. Plankton diversity had been recorded on the basis of species abundance and various diversity indices.
Species abundanceAbundance of plankton was estimated using the proportion of species as shown in (Table 1).
Table 1: Population sizes and corresponding grades used to measure abundance.
| Size of population for an individual species | Grade | Abundance |
|---|---|---|
| More than 50% of the total population | A+ | Very common |
| More than 15% of the total population | A | Common |
| More than 5% of the total population | A- | Less common |
| More than 1% of the total population | B | Few |
| More than 0.5% of the total population | B- | Very few |
| More than 0.1% of the total population | C | Rare |
| More than 0.05% of the total population | D | Very rare |
During the study, four diversity indices were used to determine species composition, abundance and diversity of the plankton population in the studied ponds which were: (a) Species richness (S), (b) Simpson index of diversity (D), (c) Shannon-Weiner diversity index (H') and (d) Species Evenness (E) [13-19].
A diversity index proposed by Simpson (1949) to describe the probability that a second individual drawn from a population should be of the same species as the first. The statistic is given by:
Where, S is the number of observations and,
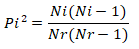
But is usually approximated as:
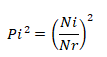
Where, Ni is the number of individuals in the ith species and Nr the total individuals in the sample. The index is:

The larger its value the greater the diversity.
The statistic 1-C gives a measure of the probability of the next encounter (by the collector or any animal moving at random) being with another species. According to May (1975), this index is strongly influenced for values of S>10 by the underlying distribution. States ‘Simpson's Index is heavily weighted towards the most abundant species in the sample, while being less sensitive to species richness.’ However, also states ‘The Simpson index is one of the most meaningful and robust diversity measures available.’ In essence it captures the variance of the species abundance distribution.
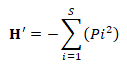
Shannon index or Shannon-Weiner index (H′)
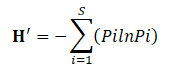
Where, ‘ln’ denotes for natural log, the value ranges from 0 to 4.6. The greater the value, the greater the diversity.
Species Evenness (E)

Where, D is Simpson's diversity index and S is the number of species.
Krebs (1989) noted that for continuous data or data with large numbers of records, the maximum value for Simpson's D is 1/S. The value E ranges between 0 to1. ‘1’ represents complete evenness or all species have equal frequency, when dissimilarity in frequency increases the value E increases.
Diversity indices were determined with Species Diversity and Richness 4 (SDR, version: 4.1.2).
During the study period (January 2017 to December 2018) a total of 10399579 phytoplankton and 20960356 zooplankton individuals were enumerated from a total of 144 catch samples collected from the three experimental ponds in different seasons (Table 2).
Table 2: Number of plankton individuals from three ponds of CU campus at different seasons.
| Seasons | 2017 | 2018 | Total | |||||
|---|---|---|---|---|---|---|---|---|
| Pond 1 | Pond 2 | Pond 3 | Pond 1 | Pond 2 | Pond 3 | |||
| Phyto-plankton | Pre-monsoon | 232122 | 304338 | 119500 | 640313 | 1572583 | 391598 | 3260454 |
| Monsoon | 247167 | 573427 | 122079 | 483158 | 473013 | 589762 | 2488606 | |
| Post-monsoon | 71700 | 450918 | 427276 | 429855 | 563970 | 506370 | 2450089 | |
| Winter | 99726 | 213638 | 265651 | 326690 | 778898 | 515827 | 2200430 | |
| Total | 10399579 | |||||||
| Zoo-plankton | Pre-monsoon | 579015 | 488316 | 889801 | 543337 | 994170 | 1614107 | 5108746 |
| Monsoon | 1383275 | 305627 | 443611 | 741931 | 1116765 | 1626573 | 5617782 | |
| Post-monsoon | 396155 | 640485 | 895389 | 529582 | 1320516 | 2123486 | 5905613 | |
| Winter | 196014 | 252325 | 1170067 | 359359 | 916452 | 1433998 | 4328215 | |
| Total plankton | 20960356 | |||||||
The composition of 12 phytoplankton and 33 zooplankton species in the study areas are shown in Table 3. During 2017, 10 phytoplankton and 30 zooplankton species were identified and 09 phytoplankton and 19 zooplankton species were identified in 2018. The proportion of different species in the population was irregular with a great difference. Anacystiscyanea as phytoplankton and Nauplius larva, Brachionusforficula, and Cyclops varicans rubellus as zooplankton were the most dominant species in all the ponds. The lowest percentages of individuals were counted for some phytoplankton species such as Oscillatoriaprinceps, Desmidium swartzii and some zooplankton species such as Brachionuscalyciflorus, Brachionusnilsoni, Platyiasquadridentatus and Lecanecurvicornis in the population.
In 2017, out of 10 phytoplankton species, one species (Anacystiscyanea) was recorded as very common (A+), four species were represented as less common (A-), two species were found as few (B) and three were listed as rare (C) (Table 3). Besides, in 2018, out of 09 phytoplankton species one species (Anacystiscyanea) was recorded as very common (A+), one species (Ulothrixaequalis) was counted as common (A), three species were found as few (B) and 4 species were listed as rare (C) (Table 3).
Table 3: Species composition and status of abundance of plankton species in the three experimental ponds in Chittagong University campus (A+=Very common, A=Common, A=Less common, B=Few, B--=Very few, C=Rare and D=Very rare).
| No | Species | 2017 | 2018 | 2017 | 2018 | |||||
|---|---|---|---|---|---|---|---|---|---|---|
| P1 | P2 | P3 | P1 | P2 | P3 | |||||
| Phytoplankton | Anacystis cyanea | A+ | A+ | A+ | A+ | A+ | A+ | A+ | A+ | |
| Microcystis flosaquae | B | A- | A- | |||||||
| Phormidium murrayi | B | B | C | C | ||||||
| Oscillatoria princeps | B- | C | ||||||||
| Spirulina platensis | C | C | ||||||||
| Pediastrum duplex | A | B | B | B | A- | B | ||||
| Scenedesmus opliensis | A | A- | B | A- | B | |||||
| Ulothrix aequalis | A- | B | A | B | B | A | ||||
| Docidium ehrenbergii | B | B | C | C | ||||||
| Closterium praelongum | B | A | B- | B | B | A- | B | |||
| Desmidium swartzii | B | C | ||||||||
| Melosira varians | B | B | ||||||||
| Zooplankton | Daphnia lumholtzi | A- | B- | B | ||||||
| Ceriodaphnia cornuta | B | - | C | |||||||
| Diaphanosoma brachyurum | C | B | B | B | B | B- | B | |||
| Moina brachiata | C | C | B | B | C | B | ||||
| Alona guttata | C | - | C | |||||||
| Bosmina longirostris | B | C | ||||||||
| Cyclops varicans rubellus | A | A- | A- | A | A | A | A- | A | ||
| Mesocyclops leukarti | C | C | ||||||||
| Nauplius larva | A | A | A | A | A- | A | A | A | ||
| Brachionus angularis | A | B | A- | B | B | A- | B | |||
| Brachionus caudatus | B | A- | A- | B | B | A- | A- | A- | ||
| Brachionus calyciflorus | C | C | ||||||||
| Brachionus diversicornis | B- | A- | A- | B | B | A- | B | |||
| Brachionus donneri | B- | B | B | C | B | |||||
| Brachionus forficula | A- | A | A- | A | A- | A- | ||||
| Brachionus falcatus | A | B- | B | A | A- | B | A- | A- | ||
| Brachionus quadridentatus | B- | C | ||||||||
| Brachionus nilsoni | C | C | ||||||||
| Brachionus urceolaris | B | C | B | |||||||
| Keratella tropica | B | A- | A- | B | A- | A- | A- | A- | ||
| Keratella cochlearis | C | B | B | C | C | C | B | C | ||
| Filinia terminalis | C | C | ||||||||
| Filinia opolinesis | B | B | B | C | B | B | B | B | ||
| Filinia camascela | B | C | ||||||||
| Trichocerca capucina | B | B- | C | C | B- | C | ||||
| Trichocerca cylindrica | B | B | B | |||||||
| Lecane curvicornis | C | D | ||||||||
| Testudinella patina | B- | B- | B- | |||||||
| Platyias patulus | A- | B | ||||||||
| Platyias quadridentatus | C | C | ||||||||
| Euglena gracilis | B- | C | C | |||||||
| Ceratium hirundinella | A | B | A- | C | B | B | ||||
| Nematode worm | B | B | B | A- | B- | B | B | B | ||
In 2017, out of 30 zooplankton species one species (Nauplius larva) was recorded as common (A), seven species were represented as less common (A-), seven species traced as moderately few (B), three species were found as very few (B-), eleven species were enumerated rare (C), and one species was found as very rare (D) (Table 3). In 2018, out of 19 species two species were counted as common (A), four species were represented as less common (A-), nine species were found as few (B) and four species were listed as very rare (C) (Table 3).
The abundance status of phytoplankton species was in a fluctuating condition (Figure 2). The percentages of less common and rare were very high and the percentage of few was comparatively low. But the percentages of very common and common were lowest. Besides, the abundance status of zooplankton species was in an oscillating state (Figure 2). The percentages of few and rare were very high and the percentages of less common and very few were comparatively low. But the percentages of common and very rare were lowest. The comparison of phytoplankton and zooplankton abundance status of the two years was almost the same.

Figure 2: Comparison of abundance status of plankton in three ponds of Chittagong University campus.
The total phytoplankton species belonged to four groups (Blue-green algae, Green algae, Desmids and Diatoms). The Blue-green algae occupied the highest position in the population in all the three ponds. In pond 1 rest of the three groups contributed only 6.12% of the total phytoplankton population. The second highest contribution in the population of pond 2 was made by Green algae and in pond 3 was by Desmids. Diatoms found in pond 1 only (Figure 3).
The total zooplankton species belonged to five groups (Cladocera, Copepoda, Rotifera, Protozoa, and Nematoda). Rotifera and Copepoda occupied first and second highest position in the population of all the three ponds. In ponds 1 and 3, rest of the three groups contributed less than 10% of the total population. In pond 2, representatives of Cladocera, Protozoa and Nematoda contributed 20% of the total zooplankton population (Figure 3).

Figure 3: Composition of groups of planktons in three ponds of Chittagong University campus.
Diversity indicesSpecies richness (S): The Species richness (S) of the total studied phytoplankton and zooplankton during the two years study period in the three experimental ponds were 12 and 33 respectively. Among the 12 phytoplankton species, 10 and 09 species were found in 2017 and 2018 respectively, and of the 33 zooplankton species, 30 and 19 species were found in 2017 and 2018 respectively (Table 3).
During 2017, the highest number of phytoplankton species was found in both the ponds 1 (6) and 2 (6) followed by pond 3 (4). In the same year the highest number of zooplankton species was found in pond 1 (21) followed by pond 2 (19) and pond 3 (18). In 2018, the highest number of phytoplankton species was found in pond 2 (7), followed by pond 3 (5) and pond 2 (4), and the highest numbers of zooplankton species were found in pond 2 (19) followed by pond 3 (17) and pond 3 (10) (Figure 4).

Figure 4: Comparison of Species richness (S) of plankton in three ponds of Chittagong University campus.
Simpson Diversity index (D): The Simpson Diversity indices (D) of total phytoplankton were found to be 2.52 and 1.74 in 2017 and 2018 respectively and the higher value was found in 2017 (Table 3). Besides, the Simpson Diversity indices (D) of total zooplankton were found to be 10.59 and 7.51 in 2017 and 2018 respectively and the higher value was found in year 2017 (Table 3). Simpson’s diversity indices for both phytoplankton and zooplankton were greater in 2017 than 2018 [20-21].
In 2017, the highest value of Simpson diversity indices for phytoplankton species was found in pond 2 (2.879), followed by pond 3 (2.417) and pond 1 (1.362). In the same year the highest value of Simpson diversity indices for zooplankton species was found in pond 2 (10.05), followed by pond 1 (7.613) and pond 3 (6.495) (Figure 5). In 2018, the highest value of Simpson diversity indices for phytoplankton species was found in pond 2 (2.265), followed by pond 3 (1.397) and pond 1 (1.362). In the same year the highest value of Simpson diversity indexes for zooplankton species was found in pond 2 (8.826), followed by pond 3 (6.488) and pond 1 (5.372) (Figure 5).

Figure 5: Comparison of Simpson diversity index (D) in three ponds of Chittagong University campus.
The Simpson diversity indices of phytoplankton showed that the highest diversity was found in pond 2 and the lowest diversity in pond 1. The Simpson diversity indices of zooplankton also recorded the highest diversity in pond 2 and lowest diversity was found in pond 1.
Shannon Wiener diversity index (H'): Species diversity is one of the notable parameters of the community structure in any ecological study. Throughout the study a clear fluctuation of species diversity was observed. The species diversity utterly relies on water motion, volume of water and the impact of physicochemical parameters. Found the Shanon Wiener diversity index (H′) to be a suitable indicator of water quality. Normal values ranges from 0 to 5. The higher values of Shannon Wiener diversity index indicates the greater species diversity or indicates the even distribution of the species while the lower values indicate poor species diversity. This index also determines the pollution status of a water body. Shanon Wiener legislation on aquatic environment classified water quality as >4=very good quality, 3-4=good quality, 2-3=moderate quality, 1-2=poor quality and less than 1 = very poor quality. Set a scale of pollution in terms of species diversity as less than 1 for highly polluted, 1 to 3 for moderately polluted and greater than 4 for the unpolluted water body. The Shannon Wiener diversity index (H') of total phytoplankton were found to be 1.337 and 0.852 in 2017 and 2018 respectively and the higher value was found in 2017 (Table 3). Besides the Shannon Wiener diversity indices (D) of total zooplankton were found 2.657 and 2.339 in 2017 and 2018 respectively and the higher value was found in 2017 (Table 3).
During 2017, the highest value of Shannon Wiener diversity index for phytoplankton species was found in pond 2 (1.317), followed by pond 3 (1.034) and pond 1 (0.636) and the highest value of Shannon Wiener diversity index for zooplankton species was found in pond 2 (2.506), followed by pond 1 (2.328) and pond 3 (2.229) (Figure 6). During 2018, the highest value of Shannon Wiener diversity indices for phytoplankton species was found in the pond 2 (0.998), followed by pond 3 (0.587) and pond 1 (0.235), whilst the highest value of Shannon Wiener diversity indices for zooplankton species was found in pond 2 (2.457), followed by pond 3 (2.169) and pond 1 (1.847) (Figure 6).

Figure 6: Comparison of Shannon Wiener diversity index (H') in three ponds of Chittagong University campus.
The Shannon Wiener diversity indices of phytoplankton showed that the highest diversity was found in pond 2 and the lowest diversity was found in pond 1. The Shannon Wiener diversity indices of zooplankton also indicated that the highest diversity was recorded in pond 2 and the diversity of pond 1 and 3 was almost the same.
Species Evenness (E)
Throughout the study period the species evenness values showed clear fluctuation. There are many factors that impact on the species evenness. The evenness index ranges a value between 0-1. The lower values indicate more diversity while the higher values indicate less diversity. An index value of 1 indicates that all groups have the same frequency or tend to be equally distributed. When evenness values far below 1, means that the individuals of the community are not distributed equally. This may be due to organic pollution and eutrophication. Evenness index value also indicates the pollution status of the water body. When evenness index values ranges between 0-0.3, indicates heavy pollution and values >0.5 indicate light pollution. The Species Evenness (E) of total phytoplankton was found to be 0.252 and 0.193 in 2017 and 2018 respectively. Whilst, the Species Evenness (E) values of total zooplankton were found to be 0.352 and 0.395 in 2017 and 2018 respectively, the evenness values in both the years being almost the same (Table 3).
In 2017, the highest value of species evenness for phytoplankton species was found in pond 3 (0.6042), followed by pond 2 (0.4799) and pond 1 (0.2269). In the same year the highest value of species evenness for zooplankton species was found in pond 2 (0.5288), followed by pond 1 (0.3625) and pond 3 (0.3608) (Figure 7). In 2018, the highest value of species evenness for zooplankton species was found in pond 2 (0.3235), followed by pond 3 (0.2794) and pond 1 (0.2755) and in the same year the highest value of species evenness for zooplankton species was found in pond 1 (0.5372), followed by pond 2 (0.4645) and pond 3 (0.3816) (Figure 7).

Figure 7: Comparison of Species evenness (E) in three ponds of Chittagong University campus.
The species evenness of phytoplankton showed that the highest dissimilarity was found in pond 3 and the lowest dissimilarity was found in pond 1. The species evenness of zooplankton showed that the highest dissimilarities were recorded for pond 2 in 2017 and pond 1 in 2018 (Table 4).
Table 4: Species richness (S), Simpson Diversity index (D), Shannon Wiener diversity index (H') and Evenness index (E) in three ponds of Chittagong University campus during January 2017 to December 2018.
|
Species richness | Simpson diversity index | Shanon-Wiener diversity index | Evenness index | |||||
|---|---|---|---|---|---|---|---|---|---|
| Year | 2017 | 2018 | 2017 | 2018 | 2017 | 2018 | 2017 | 2018 | |
| Phytoplankton | Pond-1 | 6 | 4 | 1.362 | 1.102 | 0.636 | 0.2352 | 0.2269 | 0.2755 |
| Pond-2 | 6 | 7 | 2.879 | 2.265 | 1.317 | 0.9981 | 0.4799 | 0.3235 | |
| Pond-3 | 4 | 5 | 2.417 | 1.397 | 1.034 | 0.5867 | 0.6042 | 0.2794 | |
| Total | 10 | 9 | 2.52 | 1.74 | 1.337 | 0.852 | 0.252 | 0.193 | |
| Zooplankton | Pond-1 | 21 | 10 | 7.613 | 5.372 | 2.328 | 1.847 | 0.3625 | 0.5372 |
| Pond-2 | 19 | 19 | 10.05 | 8.826 | 2.506 | 2.457 | 0.5288 | 0.4645 | |
| Pond-3 | 18 | 17 | 6.495 | 6.488 | 2.229 | 2.169 | 0.3608 | 0.3816 | |
| Total | 30 | 19 | 10.59 | 7.51 | 2.657 | 2.339 | 0.352 | 0.395 | |
Among the three studied ponds, pond-1 was highly used by the local peoples for different domestic purposes and also there was an open access of surrounding washings and rain water to the ponds, which was reflected by poor species diversity and uneven plankton distribution than the other two ponds. Different indices (Simpson diversity index, Shannon Wiener diversity index and species evenness) also indicated that pond-1 was more polluted than the other two ponds. For keeping the water quality in good condition no household and foreign materials should be dumped to the water body and there should be a digging programme after five years interval.
Citation: Islam S, Azadi MA, Nasiruddin M, Sarker MM (2022) Plankton Species Composition, Abundance and Diversity Indices in Three Ponds of Chittagong University Campus, Bangladesh. Fish Aqua J. 14:321
Received: 02-Jan-2023, Manuscript No. FAJ-23-16007; Editor assigned: 04-Jan-2023, Pre QC No. FAJ-23-16007; Reviewed: 18-Jan-2023, QC No. FAJ-23-16007; Revised: 25-Jan-2023, Manuscript No. FAJ-23-16007; Published: 31-Jan-2023 , DOI: 0.35248/2150-3508.23.14.321
Copyright: © 2023 Islam S, et al. This is an open-access article distributed under the terms of the Creative Commons Attribution License, which permits unrestricted use, distribution, and reproduction in any medium, provided the original author and source are credited.