Pancreatic Disorders & Therapy
Open Access
ISSN: 2165-7092
ISSN: 2165-7092
Research Article - (2015) Volume 0, Issue 0
The pancreatic duct ligated (PL) piglet is a model for pancreatic exocrine insufficiency (PEI) in children. PEI is very common in children suffering from cystic fibrosis and is of highest relevance as the nutritional status affects survival rate of these patients. This study aimed comparing growth and body weight development of PL-piglets with (PL+enz) or without (PL-0) pancreatic enzyme replacement therapy (PERT) with those of controls. Growth, proportion of gastrointestinal tract (GIT; including digesta) and digestibility of nutrients was measured in young PL-pigs. The body weight (kg) at dissection differed significantly (p<0.005) between controls (79.7), PL-0 (51.3) and PL+enz (62.9). GIT mass accounted for 8.17% of body weight in controls, 21.1% in PL-0, whereas in PL+enz the relative weight of GIT was 12.0% differing significantly (p<0.01) from both other groups. Faecal digestibility of nutrients was markedly reduced for fat and protein in PL-0, while starch digestibility reached values of controls (p>0.05). PERT increased digestibility of fat and protein but reached no normalisation. Samples of ileal digesta taken during dissection indicated a significant reduction (p<0.005) in praecaecal starch digestibility in PL-0 (33.4%) compared to the controls (79.7%). This study demonstrates that PEI impaired growth, with improvement, but no complete normalisation, by PERT. The massive increase (p<0.0005) in GIT mass (21.1% of body weight in PL-0 compared to 8.17% in controls) is noteworthy, resulting in an overestimation of growth and nutritional condition in PL-0. Endocrinological parameters like leptin and IGF 1 were also impaired in the PL-pigs (p<0.05) and are supposed to be useful parameters to evaluate nutritional status in these PEI patients. As weight and BMI might result in an overestimation of nutritional status in PEI patients due to increased gut fill, there is need to implement further parameters to estimate nutritional status. Leptin seems to be a promising parameter to characterize nutritional status, even in juveniles – allowing an indirect quantification of the body fat content. Without need for any technical equipment on-site this parameter can be measured continuously during routine consultation, allowing an early detection of malnutrition and early therapeutic intervention.
<Keywords: Pancreatic exocrine insufficiency, Growth, Body composition, Body mass index, Animal model, Children, Cystic fibrosis
Pancreatic exocrine insufficiency (PEI) is most often the result of chronic pancreatitis in adults. In children cystic fibrosis (CF) is the most relevant cause of PEI [1]. It is seen at birth in most CF-patients and develops later in some [2,3]. The effects of CF on lung function are the primary medical concern and “progressive pulmonary disease is the major cause of mortality in cystic fibrosis” [4]. Nevertheless, the effects of PEI are also highly important since nutritional status has a great impact on lung function [5,6], prognosis and lifespan [4,7]. Nutritional management is crucial for optimising the outcome in CF-patients and is an integrated part of the overall treatment [3,8].
The pancreatic duct ligated pig is an established model for PEI in adults [9-12] and there are also studies dealing with juvenile pigs as a model for children [10,13-15]. The much higher growth rate of juvenile pigs in comparison to human babies allows the effects to be studied in fast-motion and to cover the whole period of adolescence within a short time scale (Table 1). It is well known that PEI causes growth retardation in children, which can be resolved, but often not completely, by pancreatic enzyme replacement therapy (PERT). PERT is the standard therapy in PEI patients as it is safe and has few side effects [1]. Up to 90% of CF patients need PERT [16]. CF children grow poorly [17] and are often malnourished [18] although it was found in another study that growth and body composition of children suffering from CF did not differ significantly from the matched control group [19]. Murphy et al. (2006) stated that most of the children with CF nowadays are well nourished (with only a small percentage considered malnourished) but that nutritional status seems to decrease with age. Malnourished children are believed to have an impaired function of the immune system [20] and the course of the pulmonary disease is negatively affected by malnutrition [16,21], so that it is of the greatest importance that body weight development and body composition are continuously assessed in children with PEI [22].
| Child | Piglet (cross-bred) | |
|---|---|---|
| Body weight at birth (kg) | 3.5g | 1.5 |
| Body weight aged 6 months (kg) | 8 | 120 |
| Age at onset of puberty (months) | 120 – 140 | 4 – 5 |
Table 1: Synopsis of the bodyweight of children and piglets at birth and at the age of 6 months and the onset of puberty.
A depletion of the fat compartment is suggested to be a risk factor for the development of complications in chronic diseases according to [19]. The present study was conducted in growing piglets with experimentally induced PEI to test the effects of PEI and PERT on growth and bodyweight development. Special emphasis was given to the mass of the GIT (with differentiation between tissue mass and digesta mass). The hypothesis of this study was that body weight of young growing pancreatic duct ligated piglets is not only affected by the reduced enzymatic digestion (resulting in a decreased body weight) but also by the increase in digesta due to maldigestion and malabsorption (resulting in a higher body mass).
All efforts were made to minimise both the stress for the individual animal as well as the numbers of animals used. The procedures used in this study were conducted in accordance with the German Animal Welfare Act and with the European Council Directive of 24 November, 1986 (86/609/EEC) and were approved by the Ethics Committee on Animal Welfare of the Hannover District Government (reference number: 33.9-42502-04-10/0208).
A total of 12 female cross-bred piglets of the same genetic background and age were used for this study. Piglets were housed individually, beginning at an age of 6 weeks and with a mean body weight (bw) of 12.8 ± 1.59 kg at the Institute of Animal Nutrition of the University of Veterinary Medicine, Hannover, Foundation.
PEI was induced experimentally in 8 randomly selected piglets by ligation of the pancreatic duct at the age of 8 weeks (PL-pigs), as described by [12], while the other 4 pigs were sham operated at the same age and served as controls (C). The PEI was confirmed by measuring the chymotrypsin activity in the faeces 10 days post-surgery (test kit purchased from Immundiagnostik AG, Wiesenstrasse 4, 64625 Bensheim, Germany, catalogue no. K6990) and only pigs with a chymotrypsin activity < 0.90 U/g faeces were defined and used as PL-pigs. All eight pigs undergoing PEI surgery fulfilled this criterion and were used as PL-pigs.
Housing
All animals were housed individually in pens of 3 m2 without litter and with free access to water via nozzle drinkers, with fences allowing limited social contact between the animals.
Experimental Diet
The diet was designed as a complete diet to meet the requirements of growing pigs, but with a higher supply of fat soluble vitamins than recommended by [23]. The diet was produced at the Institute of Animal Nutrition, University of Veterinary Medicine Hannover, Foundation and was based on wheat, barley, soy bean meal, fish meal and skimmed milk powder which were enriched with linseed oil and soybean oil. Brewer’s yeast was added as well as isolated amino acids and a mineral premix (Phoskana S35, supplied by Karl Wolpers, Hildesheim, Germany) containing vitamins. The dietary contents used were chosen to ensure a high digestibility and a high supply of essential fatty acids. The diet was not pelleted. The chemical composition of the diet is given in Table 2.
| Chemical composition of the diet | |||
| Crude ash (g) | 55.0 | Cu (mg) | 43.6 |
| Crude protein (g) | 210 | Zn (mg) | 172 |
| Crude fat (g) | 103 | Se (mg) | 0.44 |
| Starch (g) | 407 | ||
| Sugar (g) | 44.3 | Vitamin A (IU) | 13393 |
| Ca (g) | 10.5 | Vitamin D (IU) | 1875 |
| P (g) | 5.68 | Vitamin E (mg) | 122 |
Table 2: Chemical composition of the diet (analysed values, per kg dry matter).
Enzyme substitution
The PL-pigs were divided into two equally sized groups according to their weight and weight gain during the phase post-surgery (ensuring comparable conditions in both groups at the beginning of the trial): PL-0 (no pancreatic enzyme replacement therapy) and PL+enz: (receiving a porcine pancreatin product (Creon®, Abbott Laboratories GmbH, Neustadt, Germany) at a dosage of 9.9 g (~ 518.700 Ph. Eur. U. lipase)/kg diet, accounting for 5620 Ph. Eur. U. lipase/g dietary fat); the specific enzyme activities (Ph. Eur. / g) were 52,394 lipase, 48,942 amylase and 2,996 protease. The coated enzyme product (without capsules) was mixed into the diet (pH 6.18) directly before offering the meal. During ad libitum feeding phase maximum enzyme dosage reached about 25,000 IU lipase/kg body weight/day.
Feeding management
Control and PL-pigs were fed a complete diet (Table 2), offered in a liquid form (25% dm). All animals were fed an identical amount of the diet three times a day; feed allowance was progressively increased during the course of time according to the feed intake of the pig with the lowest feed intake. To avoid extra corporal digestion of the diet by the added enzymes the amount of feed offered was adapted for maximum intake duration of 20 minutes, with most pigs consuming their meal within less than 5 to 10 minutes. The last two weeks before dissection the animals were fed ad libitum. In that phase of the study the diet was offered in a dry form.
Test design
After surgery, at the age of 8 weeks, animals were pair-fed for 9 weeks followed by a period of two weeks ad libitum feeding. All pigs were euthanised at the age of 19 weeks by intracardial injection of T61 ad us vet.® (per ml: 5 mg tetracainhydrochloride, 50 mg mebezoniumiodide, 200 mg embutramid; supplier: Intervet Deutschland GmbH, Unterschleißheim, Germany; dosage used: 1.5 ml/10 kg bw), following anaesthesia by intramuscular injection of ketamine (Ursotamin®, Serumwerk, Bernburg, Germany; 0.023 mg ketaminhydrochloride/kg bw) and azaperone (Stresnil®, Janssen-Cilag GmbH, Neuss, Germany; 2 mg/kg bw).
Parenteral vitamin supplementation
To ensure that results of this study were not predominantly affected by a vitamin deficiency in PL-pigs all animals were administered an intramuscular injection of a vitamin supplement every 2nd week (3 ml of Ursovit AD3EC wässrig pro inj.® (Serumwerk, Bernburg, Germany) per ml: 50.000 I.U retinolpalmitate, 5.000 I.U. cholecalciferol, 30 mg tocopherolacetate, 100 mg ascorbic acid); 3.3 mg vitamin K1 (Konakion®; Roche Pharma AG, Grenzach-Wyhlen, Germany) and 3 ml of Vitamin B-Komplex per inj.® (Serumwerk Bernburg, Germany; per ml: 8 mg thiaminchloridhydrochloride, 0.02 mg cyanocobalamin, 0.8 mg pyridoxinhydrochloride, 20 mg nicotinamide, 0.42 riboflavinphosphate-Na, 0.84 mg dexpanthenol) per animal.
Parameters: focus on growth resp. length and relative proportion of the GIT on bw
The following parameters were measured continuously: feed intake (daily) and body weight (weekly). A complete faeces collection was performed over three days (every second week) to calculate nutrient digestibility (values of week 6 are shown in results). At dissection the body measurements were taken to quantify growth; in detail the body length was gauged (from nose to the base of the tail), the perimeter of the breast (directly caudal of the olecranon), the perimeter of the abdomen (at the umbilicus) and additionally the perimeter of the metacarpus were measured to the nearest 0.5 cm using a measuring tape.
Each animal was weighed alive, directly before dissection, to quantify the body weight; during dissection the gastrointestinal tract (GIT) from stomach to rectum was separated from the carcass. The different parts of the GIT were separated according to their anatomical regions (stomach, small intestine, caecum, colon and rectum) and weighed first including digesta as well as afterwards after emptying. The mass of the carcass without GIT but including liver was defined as “empty body weight” (ebw).
The digesta mass within the different parts was quantified and samples were taken from the stomach, small intestine (oral, middle and aboral), caecum as well as colon for further analysis. The digestibility of nutrients was determined using the marker method (using HCl nonsoluble ash as an original marker present in the diet).
Sample preparation and analyses
Feed as well as samples of digesta and faeces were weighed and frozen immediately after collection, freeze-dried (freeze dryer alpha 1-4 LSC, Martin Christ, Gefriertrocknungsanlagen GmbH, Osterode am Harz, Germany) and analysed for dry matter, crude fat, crude protein and starch (polarimetrically) according to [24].
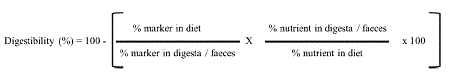
Digestibility was calculated using the following formula for the marker method:
Leptin concentration was measured in serum taken on day of dissection by use of a porcine specific Leptin ELISA (Sea084Po, cloud-clone corp., Houston, USA). IGF-1 concentration was determined using a commercial radioimmunoassay with the standard operation manual (A15729, IGF-I IRMA; Immunotech, Beckman Coulter, CA, USA).
Statistical evaluation
Statistical analysis was performed using SAS® version 9.3.1 (SAS Institute Inc., Cary, NC; USA). The Shapiro-Wilk test from the procedure UNIVARIATE was used to test for normality. For variables with normal distributions of the residuals of the linear model estimated by the GLM procedure a two sample t-test was used – for those being non-normally distributed a Wilcoxon`s two sample test was used.
Significant effects of the group were stated when two-sided p<0.05. Summary results are expressed as mean ± SD.
Feed intake
Due to the study design (pair-feeding) feed intake did not differ markedly between the groups during the phase of restrictive feeding. During the ad lib feeding phase there was also no difference in feed intake between the groups (absolute amount per animal per day). When feed intake was calculated on the basis of bw, the feed intake was significantly higher (p<0.02) in PL-0 and PL+enz (Table 3) due to the lower bw in these groups compared to the controls.
Body weight
In PL-pigs without enzyme substitution (PL-0) the body weight was significantly lower (p<0.005). Enzyme substitution (PL+enz) caused a markedly higher body weight but the values of healthy controls were not reached (Table 3).
| Control | PL-0 | PL+enz | |
|---|---|---|---|
| Feed intake (g dm/day) | 2069 ± 424a | 1904 ± 306a | 2048 ± 132a |
| Feed intake (g dm/kg bw) | 32.1 ± 4.46a | 45.7 ± 4.23b | 40.0 ± 2.19b |
| Body weight (kg) | 79.7 ± 5.03a | 51.3 ± 4.36c | 62.9 ± 3.03b |
| Empty body weight (kg) | 73.2 ± 4.77a | 40.5 ± 3.83c | 55.4 ± 3.20b |
| Relative mass of GIT (%) of bw | 8.19 ± 0.59a | 21.1 ± 0.88c | 12.0 ± 1.18b |
| Body length ([nose to tail], cm) | 128 ± 2.83a | 117 ± 7.79b | 123 ± 2.94ab |
| Metacarpus perimeter (cm) | 15.9 ± 0.63a | 13.3 ± 0.50c | 14.8 ± 0.47b |
| Breast perimeter (cm) | 92.2 ± 2.25a | 76.5 ± 1.22c | 84.2 ± 3.36b |
| Abdomen perimeter (cm) | 108 ± 6.11a | 99.4 ± 5.44a | 99.3 ± 7.58a |
| Different superscripts within one row mark significant (p<0.05) differences between the groups. | |||
Table 3: Feed intake (week 9 of trial; ad libitum feeding), bw, empty bw and relative weight of GIT (% of bw) and body measurements at time of dissection, mean ± SD
Proportion of the gastrointestinal tract (GIT) of total body weight
The relative weight (% of bw) of the GIT including digesta differed markedly between the different treatment groups: while in the healthy control-pigs the GIT was only 8.2% of the total bw, the GIT in PL-0 accounted for > 20% of the bw (Table 3). In PL-pigs treated with enzymes the relative mass of GIT was about 12% of bw (Table 3), differing significantly (p<0.01) from the other two groups.
During the course of the study it was observed that the shape of the body (especially the abdominal region) diverged between the different groups; in PL-0 pigs the abdomen had a much higher volume (bulging and exceeding the rib arch). In PL-pigs substituted with enzymes this phenomenon was not obvious (Figures 1A and B).
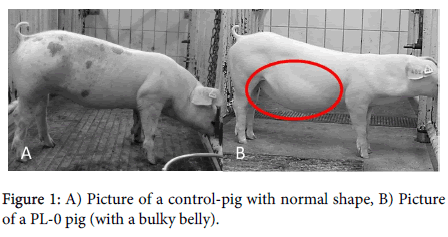
Figure 1: A) Picture of a control-pig with normal shape, B) Picture of a PL-0 pig (with a bulky belly).
The experimentally induced PEI markedly reduced the growth of the pigs as the body length was significantly shorter (p<0.05). Pancreatic enzyme replacement therapy (PERT) did not improve the body length markedly but resulted in a significantly higher (p<0.05) perimeter of metacarpus and breast in comparison to PL-0. For both parameters the PL-0 pigs showed the lowest values while PERT (PL+enz) caused an improvement but no complete normalisation (Table 3). The perimeter of the abdomen did not differ between the groups, but the ratio of umbilicus to breast perimeter differed markedly, being highest in PL-0 pigs, which supports the macroscopically finding of increased abdomen volume in this group.
Digestibility of nutrients
Digestibility of nutrients over the entire GIT in piglets fed restrictively
Total tract digestibility of nutrients was distinctly affected by experimentally induced PEI: digestibility of organic matter, crude protein and crude fat were significantly (p<0.05) lower in PL-0 (Table 4). In the group PL-0 a very strong reduction of crude fat digestibility, with high variability, was observed (Table 4). Substitution of pancreatic enzymes resulted in a significant (p<0.05) increase (50.6%) in comparison to PL-0 (18.4%). Nonetheless, the values of healthy control-pigs (80.1%) were not reached. Starch was almost completely digested in control-pigs (99%) and even in PL-0 pigs receiving no enzymes starch digestibility reached values of 97.4% over the entire GIT (not different from controls).
| Control | PL-0 | PL+enz | |
|---|---|---|---|
| Ileal digestibility (%) | |||
| Organic matter | 56.3* ± 1.41a | 19.8 ± 13.2b | 32.4* ± 6.02b |
| Crude protein | 46.9 / 29.4 | 46.1* ± 5.48 | 38.1 / 22.6 |
| Crude fat | 69.1 / 62.8 | 40.2 ± 5.04 | 39.9 / 68.9 |
| Starch | 88.4 ± 1.59a | 33.4 ± 15.7c | 79.7 ± 3.25b |
| Total tract digestibility (%) | |||
| Organic matter | 88.0 ± 2.40a | 70.4 ± 1.36c | 78.9 ± 2.10b |
| Crude protein | 85.0 ± 3.17a | 49.5 ± 1.17c | 64.3 ± 5.85b |
| Crude fat | 80.1 ± 4.53a | 18.4 ± 22.1c | 50.6 ± 3.98b |
| Starch | 99.0 ± 0.31a | 97.4 ± 1.50a | 98.6 ± 0.52a |
| Number of animals: 4 per group; (if the amount of digesta available for analysis was not sufficient, values represent only 3 animals (these values are marked by a * or in the case of only two values per group, both single values are given); Different letters mark significant effects (p ≤ 0.05) within one line | |||
Table 4: Ileal digestibility of nutrients (observed during dissection) and total tract digestibility (%) during week 6 of trial; restrictive feeding (feed intake rate (dm): 3% of bw of controls), mean ± SD.
Ileal digestibility of nutrients
During dissection samples of the digesta at the terminal ileum were taken to quantify praecaecal nutrient digestibility. In the control-pigs praecaecal digestibility of starch reached values of 88.4 ± 1.59%, while in PL-0 pigs values were massively (p<0.02) reduced (33.4 ± 15.7). Administration of PERT (PL+enz) resulted in a significant increase up to 79.7 ± 3.25, but values still differed significantly (p<0.05) from controls. The amount of digesta taken from the terminal ileum was not sufficient to analyse all intended parameters for all pigs therefore only values from two pigs in each group are available for crude protein and crude fat digestibility (Table 4).
Mass of GIT – differentiation of tissue mass and digesta mass
The absolute weight of tissue of the different parts of the GIT did not differ between the three treatment groups (one exception: weight of stomach was significantly lower in PL-0 compared to the controls). The absolute amount of digesta (fresh weight or wet weight [ww]) differed markedly between groups, with values in PL-0 pigs being significantly higher (p<0.05) for all parts of the GIT in comparison to the controls. Especially in the small intestine and caecum the absolute amount of digesta was markedly higher in PL-0 (factor of increase: small intestine: 2.6; caecum: 3.4; colon: 1.8). For the pigs in group PL+enz there was only a higher mass of digesta of the small intestine in comparison to the controls (factor 2.0) while in the postileal parts of the GIT the values of PL+enz did not differ from those observed in the controls.
The data of tissue weight and digesta mass of the entire GIT are summed up in Table 5. While tissue mass of group PL+enz did not differ from controls (neither absolute nor relative) the relative weight of GIT tissue was higher in PL-0 when calculated on basis of body weight (Table 5).
| Control | PL-0 | PL+enz | |||||||||
|---|---|---|---|---|---|---|---|---|---|---|---|
| Absolute (g) | Tissue | stomach | 543 | ± | 87.6a | 412 | ± | 33.9b | 446 | ± | 40.9ab |
| small int. | 1617 | ± | 130a | 1657 | ± | 283a | 1885 | ± | 95.0a | ||
| caecum | 158 | ± | 22.2a | 164 | ± | 4.64a | 129 | ± | 41.4a | ||
| colon | 1095 | ± | 225a | 1104 | ± | 199a | 984 | ± | 114a | ||
| total GIT | 3413 | ± | 399a | 3337 | ± | 419a | 3744 | ± | 230a | ||
| Digesta | stomach | 622 | ± | 339a | 1455 | ± | 471b | 428 | ± | 323a | |
| small int. | 764 | ± | 179a | 1955 | ± | 476b | 1551 | ± | 239b | ||
| caecum | 208 | ± | 151a | 717 | ± | 162b | 205 | ± | 140a | ||
| colon | 1623 | ± | 318a | 2882 | ± | 621b | 1536 | ± | 402a | ||
| total GIT | 3218 | ± | 780a | 6869 | ± | 692c | 3720 | ± | 879b | ||
| Relative (g/kg bw) | Tissue | stomach | 6.79 | ± | 0.68a | 8.04 | ± | 0.34b | 7.11 | ± | 0.69ab |
| small int. | 20.3 | ± | 1.69a | 32.2 | ± | 4.69b | 30.0 | ± | 1.78b | ||
| caecum | 1.98 | ± | 0.21a | 3.22 | ± | 0.33b | 2.04 | ± | 0.59a | ||
| colon | 13.7 | ± | 1.95a | 21.4 | ± | 2.23b | 15.6 | ± | 1.57a | ||
| total GIT | 42.8 | ± | 2.79a | 64.9 | ± | 4.37b | 54.8 | ± | 3.21a | ||
| Digesta | stomach | 7.65 | ± | 3.71a | 28.6 | ± | 9.97b | 6.96 | ± | 5.51a | |
| small int. | 9.56 | ± | 2.05a | 37.8 | ± | 7.28c | 24.7 | ± | 3.84b | ||
| caecum | 2.59 | ± | 1.81a | 14.3 | ± | 4.56b | 3.42 | ± | 1.85a | ||
| colon | 20.3 | ± | 3.02a | 56.5 | ± | 13.6b | 24.3 | ± | 5.61a | ||
| total GIT | 40.1 | ± | 7.39 | 134 | ± | 15.6b | 59.2 | ± | 13.5b | ||
| Different letters mark significant effects (p ≤ 0.05) within one line | |||||||||||
Table 5: Mass of tissue of the different GIT segments and digesta mass (wet weight), absolute values (g) and relative to body weight (g/kg bw), mean ± SD.
Highest amounts of total digesta were found in PL-0; PERT caused a significant lower (p<0.05) ingesta mass in PL+enz but values were still significantly higher (p<0.05) than in controls. This was found for absolute amounts as well as for relative values (g digesta/kg bw).
To check the effects of increased weight of GIT on parameters used to estimate nutritional status the body mass index (BMI) and the weight per length was calculated using the body weight of the animals as well as the empty body weight. When BMI was calculated using the body weight the PL-0 pigs reached 77.2% of the controls, but if empty body weight was used for calculation the value was even lower (66.2%). For the parameter weight per length the situation was the same (lower value when calculation was done with the empty body weight). For all parameters calculated the group PL+enz showed higher values than PL-0 but did not reach level of controls (Table 6).
| Control | PL-0 | PL+enz | |
|---|---|---|---|
| BMI (kg bw/m2) | 48.6± 2.88a [100] | 37.5 ± 2.59c [77.2] | 41.6 ± 1.55b [85.6] |
| BMI (kg empty bw/m2) | 44.7 ± 2.86a [100] | 29.6 ± 2.04c [66.2] | 36.6 ± 1.20b [81.9] |
| Bw/length (kg/m) | 62.2 ± 3.55a [100] | 43.9 ± 1.65c [70.5] | 51.1 ± 1.84b [82.2] |
| Empty bw/length (kg/m) | 57.2 ± 3.47a [100] | 34.6 ± 1.64c [60.5] | 45.0 ± 1.82b [78.7] |
| Different letters mark significant effects (p = 0.05) within one line | |||
Table 6: Body mass index and weight per length calculated with body weight and empty body weight; mean ± SD; relative values in brackets (taking the values of control-pigs as 100).
Serum levels of leptin as well as IGF-1 were lowest in pigs of PL-0. Enzyme substitution in group PL+enz resulted in a significant (p<0.05) increase in IGF-1 level – nonetheless values did not reach those of controls (Table 7).
| Control | PL-0 | PL+enz | |||
|---|---|---|---|---|---|
| Leptin | 6.45±1.66 a | 0.925±1.12 b | 1.82±1.12 b | ||
| IGF-1 | 473±112 a | 187±82.2 c | 325±45.2 b | ||
| Different letters mark significant effects (p ≤ 0.05) within one line | |||||
Table 7: Serum levels (ng/mL) of leptin and IGF-1 at day of dissection; mean±SD.
One limitation of this study that should be taken into account is the fact that in the pig there are no negative effects of digestive disorders on feed intake despite those directly related to postprandial fullness or pain caused by bloating. In human patients other aspects like stress and sense of shame related to bowel sounds, flatulence and diarrhoea might be relevant and reduce food intake. Nonetheless this animal model allows studying the effects of PEI in juvenile patients in fast-motion with completely standardised dietary composition, and the possibility to quantify the body composition precisely during dissection.
The complete loss of exocrine pancreatic secretion by pancreatic duct ligation resulted in a markedly reduced growth rate as shown by a lower body weight and shorter body length. Scaparrotta A et al. [25] found children with CF being shorter and lighter than an aged-matched reference group. Thus the results of this study indicate that this PEI piglet model is a suitable model for children suffering from PEI as often seen in CF-patients. Growth is a relevant parameter in children and moreover [26] stated that stature (height for age) is a significant prognostic indicator of survival. The impaired growth rate observed in the present study is a consequence of the reduced availability of nutrients due to impaired enzymatic digestion. Nonetheless, it has to be emphasised that the pigs in this study did not show a complete growth retardation as had been observed by [13] with pigs that underwent pancreatic duct ligation at almost the same age (7 or 8 weeks of age). This observed difference is noteworthy and hard to explain but might be due to the vitamin supplementation used in the present study. In orientating studies a very fast exhaustion of fat soluble vitamins was seen in young PL-pigs, so that a parenteral vitamin supplementation was performed in this study even though the diet contained vitamin levels far above the recommended values for healthy growing pigs.
The very high contribution of the weight of the GIT to bodyweight (> 20% in PL-0 pigs) was unexpected. The distinct reduction in digestibility of nutrients resulted in a clinical maldigestion and malabsorption, which led to a significantly higher mass of digesta in all parts of the GIT (Figure 2).
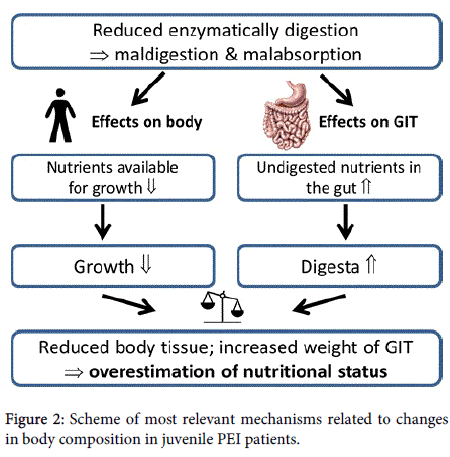
Figure 2: Scheme of most relevant mechanisms related to changes in body composition in juvenile PEI patients.
It has to be emphasised that this increase is an absolute increase (total amount of digesta was higher than in controls) and not only an effect of the reduced empty body weight of the PL-0 pigs. A distinct increase in the relative weight of the small intestinal tissue was already previously reported by [27], who found a significant increase in the empty weight of the small intestine (+20%) 12 weeks post induction of PEI in comparison to sham operated, pair-fed control-pigs.
Overall, it has to be concluded that body weight gain in pigs with experimentally induced PEI is not comparable with that of healthy pigs. The massive increase in digesta accounts for an overestimation of growth and nutritional status. This is of special interest when considering the fact that BMI is stated as an indicator for health outcome and processes in adults [19] and body weight and body mass index (BMI) are standard parameters to evaluate “growth” in children >2 years [28]. Sinaasappel M et al. [3] stated that BMI must be interpreted on the basis of comparison with age and gender. Therefore, the authors conclude that there is no advantage of using BMI rather than weight for height for detecting malnutrition. In the present study with piglets values of weight per length (according to weight/height in human medicine) show larger differences to the controls than BMI. Both parameters are also used to monitor efficacy of PERT in adults [7]. Pedreira et al. [5] found lung function and BMI to be strongly correlated while correlation between lung function and fat-free mass measured by DEXA was weaker in children with mild lung diseases. These authors recommend that BMI should remain the gold standard for estimating nutritional status in children. The BMI has a highly significant and relevant clinical effect on FEV1% with the odds ratio being higher than that for chronic infection by Pseudomonas aeruginosa [29,30].
The data generated in this animal model study raises the question whether BMI (or other body weight based parameters) is an adequate parameter, as an increased mass of GIT would result in an overestimation of BMI especially in unsupplemented PEI-patients but to a lesser extent also in PEI patients treated with enzymes. The finding that BMI is inappropriate for quantifying nutritional status in CF-patients was already published [19,31-33].
The use of age- and sex-specific BMI percentiles (BMIp) was recommended by [25] allowing early intervention in case of clinical relevant nutritional failure. But the greatest disadvantage of BMI is the fact that it is not possible to differentiate between fat-free mass and body fat using this parameter [33]. To estimate nutritional status of patients with malnutrition in general or CF-patients different parameters are used such as skinfold thickness and bioelectrical impedance analysis (BIA; [34]) but the fat-free mass calculated with these methods is not comparable with those measured with dual-energy x-ray absorptiometry (DEXA; [35]). A depletion of the fat compartment is suggested to be a risk factor for the development of complications in chronic diseases according to [19]. In this context it is worth thinking about how the massive increase of GIT mass caused by PEI influences these parameters. In DEXA measurements a water content of 73.2 % is assumed for fat-free mass [36] – a value that is comparable to that of digesta.
Although it is not possible to transfer the observed results of this animal model study directly to human patients these findings should be taken into account. A higher mass of digesta within the GIT is difficult to differentiate – if only the body weight is measured the nutritional status of the patients might be overestimated. Even though this problem is also known in human medicine and it has already been described for patients with ascites [37], it seems to be quite difficult to differentiate body composition. As the higher digesta mass is not only found in oral parts of the GIT the procedure of performing the analysis after a two- or three-hour fasting period [34] would presumably not result in a correction in those patients with maldigestion as it would have done in other patients. Furthermore it has to be kept in mind that methods like DEXA, measurement of total body potassium or total body electrical conductivity can help to characterise the chemical composition of the body more precisely – but the use of these techniques is mainly limited to research studies [25] due to costs and complexity and therefore these techniques are no standard for daily clinical examination.
Nonetheless, even if there is up to now no ideal method for estimating body composition of patients suffering from PEI it seems to be important to keep likely sources of errors in mind. In pigs supplemented with enzymes, for most parameters a significant improvement was seen – even though values of controls were not reached. These findings are consistent with those in human patients – even treatment with the most modern PERT clearly improves but does not normalise digestibility of fat [29]. The distinct enhancement of digestibility of nutrients resulted in a lower digesta mass – resulting in a GIT accounting for about 12 % of the total body weight (being still significantly higher (+ 50 %) than in controls but also significantly lower than in PL-0). PERT resulted in a distinct reduction in both digesta mass and tissue of GIT, implying a high grade of “normalisation” of digestive processes due to enzyme substitution. Therefore, the risk for overestimation of bw and nutritional status was much lower when the animals were treated with enzymes.
The findings observed in this study are of great interest for estimating the growth and body weight development in children suffering from PEI or other diseases causing malabsorption and/ or maldigestion. Even those children are well known to have a reduced body weight; there might be an overestimation of nutritional status as already described by [32]. This model allows a more detailed understanding of factors influencing body composition and might be helpful for evaluating new parameters to estimate growth and nutritional status in children. The endocrine parameters leptin and IGF-1 also indicate massive changes in nutritional and endocrine status of the different groups. Whether these parameters can be used as devices to evaluate nutritional status in PEI patients has remained unanswered up to now but this seems to be a promising option.
This animal model of the growing pancreatic duct ligated piglet allows a deeper understanding of the mechanisms involved in maldigestion due to PEI and may offer a way to optimise parameters for evaluating nutritional status in growing individuals. The quantification of the mass of the GIT as well as the digesta mass enables a deeper insight into processes occurring in the case of PEI. The opportunity to study effects in animals with completely standardised feeding and especially the possibility to study animals not treated with enzymes allows one to provoke maximal effects to better understand the prospects and limitations of pancreatic enzyme therapy.
The growing pancreatic duct ligated piglet seems to be a suitable model for PEI in children. The PL-pigs were shorter and gained less weight than the healthy controls and therefore the situation in children with CF [32] was mimicked quite well. The possibility to quantify the weight of different tissues during dissection allows a better understanding of the manifold effects of PEI on growth. The massive increased weight of the GIT in PL-0 was unexpected and seems to be of great clinical relevance for optimisation of parameters used to quantify growth and nutritional status in children with CF. The facility of quantification of praecaecal digestibility levels allows detection of the massive reduced praecaecal starch digestibility – due to the high compensative digestive capacity of the hindgut microflora [15] the impaired enzymatically starch digestion cannot be seen at faecal level. PERT resulted in distinctly increased digestibility rates of nutrients, growth parameters and reduced the relative weight of the GIT; nevertheless, values did not reach those of the controls. The findings observed in this animal model are helpful for a better characterisation of nutritional status in children with PEI. The use of leptin as a marker for nutritional status seems very promising and applicability should be checked in children. This is of greatest relevance as nutritional status is strongly correlated with pulmonary function and survival in CF [28] and an early detection of malnutrition allowing for timely therapeutic intervention [25,39].
The authors would like to thank Abbott Laboratories (GmbH) Germany for providing the enzymes needed for this study.