Fisheries and Aquaculture Journal
Open Access
ISSN: 2150-3508
ISSN: 2150-3508
Research Article - (2021)
Understanding environmental baseline parameters within Gulf of Guinea offshore areas as relevant delineating conditions favorably ensuring the survival of marine life bounded within was examined against Environmental Baseline Surveys (EBS) conducted during the Environmental Impact Assessment (EIA) by licensed oil and gas operators of the region. The case of the EBS within Ghana’s western basin is mainly because offshore marine habitation over a decade has seen a rise in anthropogenic activities. Current concerns span pollution, over-exploitation of natural resources, air emissions, growing anthropogenic activity, and climate change. A series of samplings were taking at essential offshore and coastal facility locations to investigate baseline ocean environment; understand the nature of ecology and identify issues of vulnerabilities that could ensure destructive tendencies. The paper observes EBS conditions were consistent with findings of EIAs. The tropical nature of the region meant high radiation influx from the sun leading to the thermal insulation of the area. Temperatures recorded are a direct function of solar energy absorbed in the atmosphere delimiting humidity over infrared wave outputs, atmospheric precipitations and occasional poor visibility. Absorbed heat energy in the ocean depicted a generalized thermocline under 300 meters depth at the surface. Several surface and underwater factors such as wind influenced the salinity, and temperature along water-depth, sound velocity, and dissolved oxygen concentrations useful to marine animals such as turtles, seagull, pilot whales, dolphins, and sharks; clustered along with various webs of the food chain influenced by the seasonality’s of upwelling. The main challenge to the environment was the concerns of growing anthropogenic activities, plastic pollution and oil spills from operations and possible blowouts.
Environmental baseline survey; Gulf of guinea; Marine environment; Marine ecology
World over, there is a genuine concern for the environment stemming from several decades of work undertaken by several scientists and environmental activist, who believe there is clear proof that the environment is changing and changing for the worse. Efforts at addressing these concerns, however, have become more political and emotional than the use of standard scientific application and technology aimed at reversing predicted trends. Therefore, for the past two decades, very little progress has been made. Nevertheless, there is no doubt that a changing environment does beset with naturally devastating consequences. Hence, in Ghana, critical in reflection to issues within her maritime environment is the recent rise of carcasses of dead whales found along the beaches of coastal communities, thus fostering Ghana EPA’s concerns predicting many more deaths to come with the cause still to be determined. There is also the concern of sea-level rise encroaching and inundating coastal communities, increasing coastal erosions, lost in coastal eco biodiversity, the depleting fish stocks in the adjacent ocean. Many have attributed these changes occurring in the natural environment to human activities. It is far too common to find plastic pollution across major coastlines of Ghana today, despite the enormous humanitarian efforts by environmentalist and NGOs (e.g. the Plastic Punch organization based in Accra) on the beach clean-up exercises [1-3].
The current concerns range from pollution, over-exploitation of natural resources, coastal or offshore marine developments, erosion. Therefore, grounding the concerns for biodiversity, environment distraction and the desire for wildlife conservations will be the need to understand Ghana’s marine environment better. Thus the marine environment of Ghana forms part of the Gulf of Guinea bay and is today actively utilised for socioeconomic, cultural and political gains. The importance of conserving marine and notable coastal eco biodiversity areas (such as Amansuri Wetlands; and Domini Lagoon within Ghana, and internationally, Grand-Bassam Ramsar; N’Ganda N’Ganda Ramsar; and Iles Ehotilé-Essouman Ramsar of a neighboring country, Ivory Coast ) cannot be overemphasized particularly with the rising record of infrastructure developments springing up near shore and offshore areas along the gulf stretch. These changes include development on new hydrocarbon license blocks, massive port expansions covering several square kilometers of sea and landmass (such as the Tema and Takoradi port expansion projects, and the pecan oil field development offshore). In coastal areas, the commencement of expansion works to port facilities appears inevitable as seen with the two commercial seaports in Tema and Takoradi. This development was to shore-up capacity directed at hosting dedicated offshore-onshore terminals for the oil and gas industry .These developments are in tandem with observations from countries bound to the south Atlantic, according to David Rogers’ article. Some of the developments happening beside the various port expansions along with West Africa include subsea oil and gas pipelines from offshore areas to onshore receptacles, offshore FPSO unit installations, subsea installations, oil refinery plants [4-8].
The effect of all these projects on the natural environment is in no way hidden. Therefore, specific queries explored in this section of the study are as follows. What is the nature of the marine and coastal environment? What type of marine and coastal habitations contributes to the biodiversity found in the area? Is there a visible threat to the various natural habitats? What are the actions taking by authorities to ensure eco biodiversity sustenance? The study in resolving these questions will investigate the baseline knowledge of the marine and coastal biodiversity and ocean environment. The study will also proceed to identify vulnerabilities found in the natural environment while evaluating regulations and measures in place to ensure the destructive impact are minimized. Therefore the study herewith, asserts that results obtained will fill the gap of knowledge relevant to understanding the dynamics of the meteorological-oceanic environment, biodiversity, and eco sustenance within the Gulf of Guinea bay.
Study area
Though the entire Gulf of Guinea bay remains the subject of the study, the focus was on specific locations within the western basin (Tano Cape Three Point) of Ghana’s hydrocarbon reserves (Figure 1). These areas were particularly, crucial locations based on the region’s subjection to growing anthropogenic activities. At the Jubilee area, according to ERM-TGL, annual wind direction and speed characterizing the offshore area are relatively constant. The Jubilee field, which straddles Deep Water Tano and the West Cape Three Points license blocks located 60 km away from the southern coast of Ghana. Adjacent the DWT/WCTP license block is the OCTP license block stretching northward nears the coast with water depths under 1000 meters. This area is more within the continental shelf reach and towards the coast. To the south and east of WCTP and OCTP Blocks areas respectively, lies the Pecan oil fields discoveries situated within the DWT/CTP block (on the continental slope area), and the Afina-1 Well discovery within WCTP Block 2 license area. The same meteorological features broadly characterize all these areas [9].

Figure 1: Image offshore hydrocarbon basins of Ghana. The western basin is to the left nearest to Ivory Coast, the eastern basin is bounded to the right nearest to Togo, and the central basin sits right between the western and eastern basins.
Methodology
The study here largely remained descriptive relying on both qualitative and quantitative data obtained through various means of measurements in the field. This approach relied on the use of marine vessels in accessing remote locations, along with specialized sets of equipment, including ROVs operated by vessel staff. The study also made use of combined qualitative and quantitative data gathering techniques over the 2020 four-month-period field undertakings. The parameters tested in line with the natural marine environment include; (a) meteorological, and (b) oceanographic samples, thus, providing an outlook of the area environmental dynamics against the specie habitats thus forming part of the broad ecosystem of the region. The region is also believed to host the most recently discovered coral reef along the coast of Ghana. Thus suggesting a strong relationship between reef sight and surrounding habitats.
Data sources and analysis
Study design: Though the entire region of the western basin is the focus in this study, due to limited access and resource at the researchers’ disposal at the time of the 2020 study, the hydrographical profiling aspect of the environment was relatively limited to locations within the Jubilee oil field unlike meteorological data taken every six hours at any point of the marine vessel locations in the study region. Thus during field operations and transits between the port and offshore facilities.
The survey design shown in Figure 2 was planned to incorporate previous EBS studies during the analysis stage as the fundamental description of the area. Meteorological data covered daily recordings taken at all vessel locations while at the site in the year 2020.

Figure 2: Selected stations for the environmental baseline data sampling survey.
Ocean data gathered for EBS analysis included a sampling of station locations selected during the 2020 surf operations on the Jubilee field. Both night time and daytime data were gathered.
Field methods: Data Gathering process is defined by the nature and type of data parameter sort and utilized in the analysis process. Qualitative data, in this regard, was obtained through interviews, references to internal documents, and site observation. The quantitative data, however, which is in reference to the primary parameters of the study, involved the deployment of remotely operated vehicles, position beacons and access to data from a stationed weather buoy installed and operated by a third-party institution. The environmental variables considered are; Conductivity, Ocean Current, Visibility, Waves, Wind, Temperature, Density, Dissolved Oxygen, Water Depths, Salinity and Velocity. Each of these variables uniquely helps define the environment. Sighting observations conducted were also for the marine animal presence and visibility levels at surfacing. The instrument used in gathering data on salinity, temperature, water depth was Subsea 7 ACV09 SCU. Handheld binoculars as well as bridge equipment such as GPS, Gyro was also used. Secondary quantitative data from previous sample stations were also considered and retrieved from supplementary published EIA reports.
Data analysis
Climate and meteorological impression: This included wind, atmosphere pressure, visibility (fog/midst), atmospheric temperature and ocean surface (wave height and direction) conditions observed and recorded. Analysis of wind conditions makes use of the Lake Environmental Software Version 7.0.0., in Windows 10 OS. The study modeled for a viable wind rose and wind class frequency distributions over the data gathered for the period of the 10th of January to the 28th of March, 2020 taking into account wind speed and direction over an hourly interval. Atmospheric pressure, temperature, visibility, and ocean surface conditions, however, were analyzed using Microsoft Excel; in deducing graphical information of the various data obtained.
Ocean hydrographical visualization and modeling: Took into account key conditions (Water depth, Ocean temperature, Salinity or Conductivity and Density) measured and recorded over a selected number of locations. Densities computed were by UNESCO Equation of State of Seawater (EOS-80) Formula, and in some cases, Salinity computed was based on Weiss set of equations from specific conductivity readings [10-12].The general relationships given in equation (1) are shown here;
Applied Dissolved Oxygen Equations in Analysis
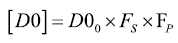
Where, Dissolved Oxygen (DO) concentration represented in mg/L, describes a baseline concentration in freshwater (DOo) multiplied by salinity (FS) and pressure correction factor (FP).
Additionally, the given salinity and the pressure correction factor are a function of salinity and barometric pressures respectively. The U.S. Geological Survey (USGS) reiterate these three terms of equation (1) are a function of water temperature.
Therefore, we examine each term under DO based on water temperature (T) under Benson and Krause equation of DOo given in equation (2)
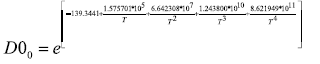
Note: equation (2) does not accont for atmospheric effects.
Where T is the water temperature in Kelvin given by (T=t(°C)+273.15). Thus t being the sampled temperature in degree Celsius of the water column at a given point in time.
The Benson and Krause’s deduced salinity factor is given by the relationship in equation (3)
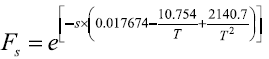
Where S is salinity in parts per thousands (%0), T is temperature in Kelvin. Salinity estimated in equation (3), however, is based on its relationship with specific electric conductivity (SC) given as;
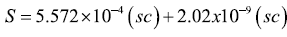
Note: Specific electric Conductivity (SC) values are obtained from measuring instrument deployed.
Whereas the pressure factor applied is given by;
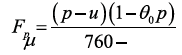
Where P is the barometric pressure in mm Hg and u is the vapour pressure of water in mm Hg with an additional correction factor for non-ideal gases. θo relates to the second virial coefficient of oxygen given by

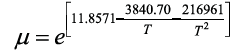
The pressure factor specified also relates to USGS in Technical Memorandum 81.11. Therefore, the empirical relation for the water vapour pressure in mm Hg is also given by
The analysis will be conducted by deducing a graphical relationship between D.O, Ocean temperature (degree Celsius), Salinity [Practical Salinity Unit (psu)] or Conductivity (micro Siemens per centimeter), Density (kg/m3) and the various Water depths of the selected study locations. The 2020 stations sampling data will be juxtaposed to a reanalyzed 2008 and 2011 EBS studies from the DWT and WCTP blocks of the study region and along gas export pipeline all the way to shore base facility conducted over water column sample. The 2011 samples are of three selected locations thus from near-surface to 100 m water depths at Station 4 (profiled on the 26th of March at 1,500 meter water depth), Station 10 (profiled on the 27th of March at 1000 meter water depth), and sample along the gas export line from near-surface and near-bottom (<5 m to the seabed) at station C1 (profiled the 28th of March at 77 meter water depth)). A comparison to the findings of the 2008 EIA EBS and 2020 EBS hydrographic data will be evaluated graphically. During the 2008 WCTP EBS EIA surveys by ERM-TGL, close to eighty (80) sample locations were selected however less that number was sampled due to insufficient data recovery at specific locations and inaccessibility as a result of extreme shallow depths. Therefore, this study highlights 14 stations of previous sample data of those locations (in the above map) from which graphical reanalysis would evaluate in comparison to the 2020 samples. (See supplementary material for the samples data). Stewart RH noted that because the atmosphere drives the ocean, while the ocean drives the atmosphere, it is imperative to consider the ocean and atmosphere as a ‘coupled dynamic system’ [13].
Observation of wind patterns: In general, the atmospheric characteristics underlining the coastal and marine environment of Ghana have minimal variations, thus according to earlier EIA baseline studies conducted by ERM/TGL and ESL Consulting/ ENI. The ERM/TGL, asserts for example that, primarily, observed winds generated are of the southwest quadrant and thus having a maximum non-squall attribute of 10 m/s wind speed. Figure 3 also shows results compiled of daily wind from the study region during the study. Winds on the sea surface usually represent velocity structure near the base of the Atmospheric Boundary Layer (ABL) and are directly linked to circulations above the ABL with patterns reflecting the entire structure of the atmospheric general. Therefore, at low latitudes, trade winds dominate while the easterlies winds dominate the Equator in both the Pacific and Atlantic Oceans. Again, the assertion from ERM/TGL and ESL Consulting/ ENI S is in agreement with the findings of the study depicted in figures, which showed an intense wind activity directed within the southwest quadrant of the wind rose, with maldistribution within the northwest (Figures 3 and 4). Again, 41.8 percent wind speed recorded between the 10th of January and the 28th of March 2020 study period, fell within the frequency range of 7-11 knots. ERM/ TGL notes that these wind characteristics accordingly, beset the fairly consistent year-round wind patterns of the region. Squall events observed, however, have been attributed to thunderstorm generating extreme wind conditions. Thus, approximately 15-30 squall events are expected yearly though with a short duration. Implicitly, over the ocean, they end up with weaker surface current and low wave heights (ERM/TGL). For coastal areas, with time, wind stress changes over most parts of the world’s oceans to a noticeable seasonal cycle. It was observed that the coastline areas show high levels of atmospheric salt precipitations largely due to high temperature and convectional wind activities near the surface [14,15].

Figure 3: Wind speed over 24 hr period.

Figure 4: left wind rose and right: speed frequency.
Observed atmospheric (barometric) pressure: The period of January to March 2020 for which the study carried out before the covid-19 pandemic, showed relatively, a Minimum And Maximum Sea-Level Pressure (MSLP) range of 1000 mbar and 1010 mbar in Figure 5 thus, below the standard average sea-level pressure of 1013.325 mbar (101.325 kPa; 29.92 inches of mercury; 760.00 mmHg per the International Standard Atmosphere (ISA). The GCNS; Stewart noted that pressure distribution around the earth surface results from the heating sun (insolation) which varies with latitude [16,17].

Figure 5: The 24 hr atmospheric pressure.
From the graph, the least sea-level pressure of 1000 mbar recorded was by the noon hour (GMT) midday. Pressures recorded remained reasonably low influencing atmospheric activities (such as cloud and winds resulting in the occasional rainfalls observed over the study period). The 6:00 am, 12:00 am and 12:00 pm periods recorded as high as 1010 mbar of barometric pressure with a Mean (average) at 1006.578947 mbar. The region under study lies near the equatorial latitude, and hence, tends to benefit from the massive influx of the sun’s thermal insulation resulting in surface heating. The area, therefore, lies within the ‘Equatorial Low’ (GCNS GCM). These recorded pressures are said to influence the amount of dissolved oxygen along the ocean column which helps maintain the function living of organisms that require oxygen for metabolism.
Observed conditions of visibility: In navigational terms, visibility means the extent to which an individual either on the navigational bridge or deck watch-keeping can maintain a visual lookout for an object over distances on ocean up to horizon form a marine vessel or platform. Brown explains this as the “term used in describing the transparency of the atmosphere, and defined by the maximum distance at which a suitable object is seen.” Conditions such as fog, sea smoke and massive rainstorm are a few atmospheric processes that contribute to reducing visibility during the day. Implicitly, the knowledge of the level of visibility on the ocean at any particular time is paramount in ensuring the safety of life, property and environment during navigation. Figure 6 is a graph indicating a visibility pattern over the study region for the study period [18].

Figure 6: Observed visibility over 24 hr period.
Though visibility recorded was relatively good (mostly) with a median of 10 nm, the minimum visibility recorded over the period was under 2 nautical miles (nm) in January and February. The reduced visibility recorded can be attributed to both radiation and advection fog activity. The radiation fog influenced the visibility of the vessel at the Takoradi port location from the 10 through to the 12th (during the P.O. vessel mobilization). Unlike the radiation fog formation occurring at the coast of Ghana, the remoteness of the condition’s location over 60 kilometers offshore, suggested an advection fog formation thus, consistent with the low visibility through the first and second weeks of February heading into March (marking the summer cold sea temperatures). This condition poor visibility, therefore, may put animals; surfacing on the water in the region, at risk of strikes from speeding marine vessels. Maximum visibility was as high as 12 nm, though did vary over 10 nm for the study period. The period under study also marked the upwelling season characterizing the feeding behavior of marine mammals in the area suggesting the imminence of animal surfacing behavior.
Atmospheric temperature: which is the measure of the degree of hotness or coldness of an object or place, was primarily crucial in this study in understanding the level of thermal energy transfer occurring above the ocean surface within the study location? Stewart RH in fact, asserted that only a fifth of the solar energy released by the sun is absorbed directly into the atmosphere as either evaporation or infrared wave energy. Therefore, the temperature seen in Figure 7 is a recorded function of these two primary atmospheric energy delineating the atmospheric dynamics of the study region within the subtropical area. From the graph, temperatures from the 10th of January and 28th of March at 0600 am (hr) range between 270°C and 300°C with a Median of 290°C. Similarly, the 1200 pm (hr), 1800 pm (hr), and 0000 am (hr) recorded minimum and maximum temperatures of 260°C-320 C (a median of 300°C); 260°C-310°C (a median of 300°C); and 280°C-300°C (a median of 29.50°C), respectively. These results are fairly consistent with sub-tropic temperatures readings suggesting some levels of active humidity. These temperatures conditionally influence marine animal’s surfacing and deep-dives from time to time.

Figure 7: Atmospheric temperature over 24 hr period.
The ocean surface conditions
Observed wave activity: The waves were driven by surface wind interactions-generating significant wave heights up to 1.4 meters. Waves with a median of 0.9 meters. These are represented in Figure 8. Wave patterns offshore and near coast showed the similar characteristic of small amplitudes, however, multi-directional offshore compared to near coast waves that ended up on the beach lines. Given that small-scale surface waves first are generated from wind stress; subsequently, via ‘wave-wave interaction,’ energy released in the phase space –resulting in surface waves with a long wavelength and large amplitude were not commonly seen in the region. This compared to larger-scale currents that indicated surface waves thus, concluding small-scale wave is the problem.

Figure 8: Significant wave amplitudes over 24 hr period; Maximum and minimum wave hieghts; Pattern of wave direction over 24 hr period.
The maximum recorded wave was over 2 meters in height for January through to March 2020. These waves characterized were associated with the southwestern quadrant the same pattern as with winds. However, wave periods over time are subject to dynamic instability in which stable ocean waves become unstable due to velocity shear.
Observed ocean current: Activities of ocean current observed were of both surface and water current conditions, primarily referred to as Guinea Surface Current and Guinea Underwater Current. The surface current measured was from the 0 meter ocean depth at the surface to a depth of 40 meters. Figure 9 shows both the amplitude and direction of the water surface current. The direction of the surface current showed a powerful feature within the southwest and northwest quadrants. According to GCNS, surface currents are mainly wind-driven a conduit of surface friction at a right angle due to the Coriolis Effect causing the current heading in the westerly direction. The patterns observed compared favorably with ERM/ TGL and ESL Consulting/ENI findings, as far as the depiction of global surface ocean current from GCNS, are of concern [19].

Figure 9: Surface current speed and direction over 24 hr periods.
Again, Stewart notes that tropical ocean currents, particularly of the Atlantic, play a vital role in the unsteady transportation of thermal energy (solar energy stored in the ocean) from summer to winter during the amelioration of the earth’s climate. This reason is also critical to understanding climate change.
The dynamics between the current and waves observed in the earlier graphs were paramount to understanding ocean stability. Hitherto, Stewart stressed that because oceans appear strongly stratified with weaker currents, turbulent mixing remains intermittent and are rare. This situation generates a period of the stable and unstable ocean surface from frequent wave formations and breaks.
The ocean structure and marine ecosystem
The ocean is a natural supporter of various life forms with the capabilities to thrive in its unique environment. However, the life support of most living mammal or organisms relies on fundamental environmental conditions that include Oxygen, lamination (Sunlight), water, favorable shelter and food sources. The ocean, unlike rivers and streams that are freshwater sources for animals within, living organism in the ocean, are forced to contend with a high concentration of salts. The study primarily examined the relationship of salinity concentration (psu), Dissolved Oxygen (D.O.) concentration (mg/L at 100% saturation level), Density (D) and temperature variations (synonymous to radiated heated energy from sunlight) over water depth as characteristic supportive of marine life forms in terms of feeding, habitat, and procreation.
Water column and hydrographical data
While previous Environmental Baseline Surveys (EBS) conducted in EIA over the region on the various oil fields and surrounding areas have determined to some level the baseline conditions of the environment. Thus on biological, chemical and physical importance before field developments, it also identifies ecosystem parameters sensitive to impending changes; thus, all as part of meeting environmental impact assessment requirement, the EBS sampling locations were selected by the oil field license operators in their EIA EBS. The scientists factored in; daily water column profiling, and seafloor sediment sampling.
The summary hydrographic results of the 2011 EBS on the DWT block by CSA International, Inc./TGL, which is also within the field demarcation of this study, have been presented in detail alongside the findings of sample location selected in this study, to enable comparative analysis. The sample data accompany graphical analysis. The other samples were from the WCTP license block, Jubilee oil field area, which also forms part of the study location. The EIA EBS carried out was conducted by TDI-Brooks International aboard R/V JW Powell between 09th through to the 13th of September 2008. The study at this point does consider graphical representation in Figure 10 which represents hydrographical data collected over the TEN and Jubilee fields at varying points in time.

Figure 10: Reanalysis of relationship between Temperature, Salinity and Oxygen over water depth from Profile site EBS 4 (tabular data obtained for TEN field developments EIA) and EBS003 (obtained for Jubilee development) for reanalysis.
The two graphs of TEN-EBS Station-4 and Jub-EBS0003 attempts to illustrate the relationship between Salinity, temperature and oxygen of the sampled location. (See supplementary material for tabular recorded data).
The graphs in Figure 10, represent parameter data obtained at varying timelines, thus, EBS Station -4 on the 26th march 2011 and sample station EBS003 on the 12th of June 2008 marking a threeyear interval of data timelines. Both locations fell within a 1400 and 1500 meter water depth zone. Sea temperatures observed varied between 24.80°C to 4.20°C (at Jub EBS 003) and 21.050°C to 4.150°C (EBS Station 4) respectively and in both cases decreasing along with the water depth. Juxtaposing the above graphs of March 2011 and June 2008 site data recordings to (Figure 11), which are sample analysis graphically produced based on 2020 data gathered on-site study, the assertions in the proceeding paragraphs can be made. Thus, the real sense or level of variations can be determined.

Figure 11: Hydro graphic data. Lef: EBS Station- Jubilee P1 Manifold; Right: EBS Station-Jubilee FPSO.
The Jubilee P1 Manifold location Figure 11 on the right: data taking within February 2020 had a maximum water depth range of 1235 meters (with a median water-depth of 621.5, and standard error (S.E.) of 10.12011199), from which various hydrographical data was as obtained. At a minimum of 8 meter water depth, sea surface temperature (SST) was 29.99 -degree Celsius (S.E=0.147263907, and a median temp of 6.31 degree Celsius, Sample Variance=26.63121632). A minimum temperature of 4.54 -degree Celsius recorded was also at the maximum water depths of 1235 meters. Salinity readings also did vary between a maximum and minimum of 35.27 psu and 33.74 psu (with a Median=34.42, S.E=0.007588667), whereas max., and min., densities (D) are 33.2522 and 20.8852 kg/m3 (with a Standard Error=0.071268403, and a Median=29.75945). Dissolved Oxygen (D.O.) estimated over the area showed a median value of 8.934279203mg/L (S.E=0.01663382) with a Minimum of 6.267872443 mg/L and a Maximum of 9.169776741 mg/L at a 100% saturation value under 1009.6 mbar of atmospheric pressure.
Similar patterns observed are of the Jubilee FPSO location in Figure 12 area with a 1002 meter water-depth, a minimum temperature of 4.8 -degrees Celsius and a maximum of 30.2 -degree Celsius.

Figure 12: Hydro graphic data for EBS from Jubilee station.
A 34.12 psu and 35.39 psu as well as 21.0411 and 31.9387 kg/ m3 are the minimum and maximum Salinity, and density values recorded respectively across the water depth-with estimated D.O. ranging between 6.240481615 mg/L and 9.173744832 mg/L of 100% saturation under 1005 mbar of atmospheric pressure.
Additionally, slight variations observed, are in Jubilee-field locations KP0.000 in Figure 12: data taking in March 2020, and KP48.808 in Figure 13 data taking in September 2020 over the study period. Again, profiling for chemical and physical parameters in the EIA survey by CSA International, Inc./TGL, (2011), revealed in total that nitrogen and phosphorous were present in all samples though with minor differences among samples. Differences were also evident in chemical composition for samples collected at deeper depth compared to shallow areas.

Figure 13: Hydro graphic data. EBS station jubilee field KP48.
Thus, the sample from deeper depth (i.e., at 100 m or near the bottom) regardless of the sample stations, recorded <0.24 to 0.40 and 0.0335 to 0.0545 mg/L total nitrogen (N) and phosphorous (P) concentrations respectively compared to <0.15 to 0.22 and 0.0141 to 0.0161 mg/L of N and P. Hence, there were no viable differences in chlorophyll and pheophytin concentrations compared to nutrients near the surface and at depth- a subject of productivity and organic mineralization (CSA International, Inc./ TGL).
The lack of difference according to CSA International, Inc./TGL, suggests the near-surface water column as beset with the same water mass.
Therefore, CSA International, Inc./TGL also stated that, given that the hydrographical parameters were consistent with measured water quality parameters from the various EBS, it was indicative of the general open ocean conditions underpinned by low levels of chlorophyll, suspended solids and nutrients in general. Comparatively, the rest of the selected stations for reanalyzes are present in Figures 14 and 15, which covers surveys conducted in 2008. The data also did concur with the findings of this study in terms of Salinity, DO, Temperature.

Figure 14: Hydrographical data from 2008 EBS EIA by ER.

Figure 15: Hydrographic data,Graph of EBS Station T6; Graph of EBS Station T4 from EIA EBS by ERM/TGL.
The results across 2008, 2011 and 2020 surveys showed very little variation in terms of average sea temperatures, salinity, and density. Thus, considering the thermocline divide by temperature, the halocline divide by salinity levels, and the pycnocline divide by density, according to Fondriest Environmental, Inc., each of these clines can affect the amount of dissolved oxygen the ocean strata hold. This could in part be attributed to the regions fairly consistent chemical composition across the sea area regardless of the waterdepth and composition of the seafloor. Dissolved Oxygen (DO) in the thermoclines regions was higher at 100 percent saturation. This was not the case for stations with relatively shallow water under 100 meters. The high concentration of DO along the water column of EBS stations with deep-water depth (1000 meter above) is in part due to strong offshore wind circulations on the ocean surface. The result also showed that there were no twilight zones (which refers to intercessions) of salinity and temperature samples collected at deep-water enclaves compared to relatively shallow waters which showed DO levels slightly below 5 mg/L at relative constant with little variation. Thus though locations with such shallow depth tend to be tidal with fluctuating dissolved oxygen levels where they are near estuaries, the results amplify a region with decline DO suggesting strong usage by colonies of coastal benthic organisms and pelagic fishes [20].
The sound velocity gradients: For the sample locations in the 2020 Jubilee study, the researcher also found that the sound velocities showed similar patterns of graduation summarized in Table 1 and 2. (See graphs in supplementary material)
| Descriptive statistics terms | Jubilee station identification | |||||
|---|---|---|---|---|---|---|
| P1 (10 Feb 2020) | B5 (15 Feb 2020) | B6 (15 Mar 2020) | ||||
| Depth (m) | Velocity (m/s) | Depth (m) | Velocity (m/s) | Depth (m) | Velocity (m/s) | |
| Mean | 505 | 1507.677709 | 505 | 1495.922824 | 493 | 1495.33529 |
| Standard error | 9.110434 | 0.343496926 | 9.110434 | 0.433606446 | 9 | 0.41149073 |
| Median | 505 | 1504.71 | 505 | 1490.7 | 493 | 1489.38 |
| Mode | N/A | 1526.42 | N/A | 1485.37 | N/A | 1485.13 |
| Standard deviation | 287.3761 | 10.83513671 | 287.3761 | 13.67751722 | 280.4479 | 12.8224105 |
| Sample variance | 82585 | 117.4001875 | 82585 | 187.0744774 | 78651 | 164.41421 |
| Kurtosis | -1.2 | -0.368146391 | -1.2 | 1.464434072 | -1.2 | 1.52001305 |
| Skewness | 8.95E-19 | 0.805357118 | 8.95E-19 | 1.377590478 | -6.2E-17 | 1.42319639 |
| Range | 994 | 39.77 | 994 | 61.23 | 970 | 58.36 |
| Minimum | 8 | 1494.97 | 8 | 1484.01 | 8 | 1484.84 |
| Maximum | 1002 | 1534.74 | 1002 | 1545.24 | 978 | 1543.2 |
| Sum | 502475 | 1500139.32 | 502475 | 1488443.21 | 478703 | 1451970.57 |
| Count | 995 | 995 | 995 | 995 | 971 | 971 |
Table 1: Sound velocities computed for three stations between February and March 2020.
| Descriptive statistics terms | Jubilee station identification | |||
|---|---|---|---|---|
| Station B2 (05 Sep 2020) | Station BX (22 Sep 2020) | |||
| Depth (m) | Velocity (m/s) | Depth (m) | Velocity (m/s) | |
| Mean | 377 | 1498.476762 | 360.5 | 1509.539088 |
| Standard error | 7.46101 | 0.409135915 | 7.653975 | 0.264031256 |
| Median | 377 | 1495.25 | 360.5 | 1508.67 |
| Mode | N/A | 1486.94 | N/A | 1521.39 |
| Standard deviation | 192.6906 | 10.56648452 | 202.7942 | 6.995582733 |
| Sample variance | 37129.67 | 111.6505952 | 41125.5 | 48.93817777 |
| Kurtosis | -1.2 | -1.274934095 | -1.2 | -1.33726051 |
| Skewness | -6 E-17 | 0.490753374 | -4.1E-17 | 0.168369103 |
| Range | 666 | 31.85 | 701 | 22.3 |
| Minimum | 44 | 1486.68 | 10 | 1499.09 |
| Maximum | 710 | 1518.53 | 711 | 1521.39 |
| Sum | 251459 | 999484 | 253071 | 1059696.44 |
| Count | 667 | 667 | 702 | 702 |
Table 2: Sound velocities computed for two stations in September 2020.
The study found the median sound velocity range of 1489.38 m/s and 1508.67 m/s over varying water depths ranging from 8 meters to 1002 meter depth of the various sample locations. The findings are in agreement with previous data which categorizes sound velocity at 1500 m/s allowing animals using sound to detect target prey (during echolocation), achieved their goal with wavelength 4 or 5 times to length of target prey (Project Oceanography). It is also useful in animal navigations, feeding and breeding.
Habitat found in the region and vulnerability concerns
The nature of the habitat observed was based on animal sightings that took place throughout the study. This period refers to the January to March 2020, and the September 2020 field observations. Other observations of species made include the periods of March 2017 to March 2018 on the offshore Sankofa Gye Nyame oil and gas field; and September to November 2015 on the TEN oil and gas fields. Among some of the animals observed, interest includes pelagic fishes, sharks, Short-finned Pilot whales, Bottlenose Dolphins, Humpback Whales, Marine Turtle, and Mantra. Bottom dwellers also observed included worms and pink colored jellyfishes at locations as deep as 700 meters on the Sankofa Gye Nyame field. Again, observation of offshore subsea construction operations over the period did appear to have risk implications in terms of sound (underwater noises), movement, night-time lightings, flaring and pollution. Several sightings of Mantra like that seen in Figure 16 occurred at over 100 meter water depth which corresponded with the high levels of dissolved oxygen concentrations (Table 3).
| Month of observation | Animals sighted |
|---|---|
| January | Bottlenose dolphins |
| January, February, March, September | Short-finned Pilot Whales |
| February | unidentified cetacean |
| September | Seagull |
| February, September | Mantra |
| March September | Marine Turtle |
| June, July, August | unidentified dolphins |
| February | Sharks |
| All months during the survey | Variety of Fishes |
Table 3: Some frequently observed animals.

Figure 16: Mantra observed subsea, courtesy Subsea 7 ROV.
Given that the area lies directly in the heart of the West African shipping lane as depicted in Figure 17 there are real vulnerabilities if measures are not adequately designed to cater for the growing changes. Other vulnerabilities identified were the concern of marine plastic particularly along the coast and oil spill [21].

Figure 17: West Africa shipping lane.
The region under the study appeared to have rich biodiversityfostering the presence of various marine animals clustered along with the various web of the food chain. The tropical nature of the region meant high radiation influx from the sun- leading to the thermal insulation of the area. The dynamic also is critical to the ocean and atmospheric relationship-thus, driving both wind and ocean current circulations. Winds observed were within southwestern quadrants, similar to ocean surface currents. The atmospheric temperature recordings taking were a direct function of the solar energy absorbed into the atmosphere, delimiting humidity infrared wave outputs. The ocean sampled showed consistency with underlining EBS studies. Thus, from all the locations sampled in this study with results in Figures 11-14 density remained relatively constant and in agreement with Boussinesq Approximation principles and assumptions, except where gravity was of concern. In this case, the study looks into marine animals’ navigations and marine assets movement within water columns of the offshore marine environment. Sea temperatures also showed a pattern of declination along with the water depth (pressure) from the ocean surface to the bottom (seafloor). Variation in salinity in some cases was relatively small. These two conditions have a direct impact on sound travel in the ocean, though the latter (salinity recordings) in this case is negligible. The velocity at which sound travels in the ocean environment is primary to the marine animals’ interactions of the region. This velocity was also imperative in understanding the adverse effect of the anthropogenic noises generated by marine assets. Sound velocity from the study region recorded is found in Table 1 and 2. According to Stewart, in typical ocean conditions, project speed within the range of 1450 m/s to 1550 m/s. The study’s findings of 1493.5 m/s and 1534.74 m/s for station P1 (Jubilee P1 Manifold) Location in Figure 11 agree with this typical ocean speed limits determined.
Another ocean condition that delineates the habitable nature of the offshore region was the amount of dissolved oxygen mix along the water column. Dissolved oxygen is a necessity to many life forms, and that includes fish, invertebrates, bacteria and plants reiterated that organisms within the marine environment use this oxygen for respiration; thus, in similar ways to living organisms found on land. They described the respiration process in fish and crustaceans as one that occurred through the use of gills. They also emphasized that dissolved oxygen for respiration only took place in plant life and phytoplankton, during periods of unavailable sunlight for photosynthesis and thus, suggesting the amount of dissolved oxygen needed by organisms varied. This assertion is true as the samples from the study showed D.O. levels relatively lower near sea surface compared to the mid-ocean dwellers. The dissolved oxygen structure along with the water depth also did suggest the nature of habitat stratification at each location in relation to presence of feed with surface regions of less D.O. indicating areas of dense marine habitats. Thus, more animals of varying species inhabited are near the ocean surface at most times. This may subject them to anthropogenic stressors that compound largely at the near-surface column [22-24].
Fondriest Environmental cites organisms (sea bottom feeders) such as crabs, oysters and worms as those requiring minimal oxygen of 1-6 mg/L, compared to shallow water fish requiring higher levels of 4-15 mg/L. Therefore, marine mammals of the order Odometer such as pilot whales, melon-headed whales, bottlenose dolphins, and predator fish like sharks sighted, suggest the offshore area as a conducive feeding ground all year-round. In an unrelated matter, the region is known to be a host of deep water coral reefs triggering the interest of scientist- but remain to be explored. The underlining condition of the larger marine environment of the Gulf of Guinea area as favorable habitation for living mammals requires further studies. Recent events suggest the need to ensure the area protected along with the increasing anthropogenic activities in the region. Thus, there is the eminent danger with growing marine traffic routed in the area.
Our most excellent acknowledgement goes to family and friends who supported us through this study in diverse ways. We wish to thank the Subsea Seven Borealis Team, who contributed to this study with their enormous experience and thoughtfulness. Our final thanks go to Prof Fava of the Selinus University of Science and Literature. The paper forms part of authors PhD thesis.
Supplementary data and analysis will be made available on reasonable request to the corresponding author.
Regardless of lead authors working relations with Subsea 7 Borealis, and having access to vessel equipment and documents, on behalf of all authors, the lead author wishes to state that at no stage in this study did the concerns of conflict of interest cloud our judgment to the best of our abilities.
Citation: Sackey AD, Lamptey BL, Ofori-Danson P, Yahaya B, Sackey AD (2020) Outlining the Offshore Marine Environment and Mammal Habitation with the Changing Climate in the Gulf of Guinea: The Case of Ghana’s Waters. Fish Aqua J. S3:001.
Received: 12-Jul-2021 Accepted: 26-Jul-2021 Published: 02-Aug-2021 , DOI: 10.35248/2150-3508.21.s3.001
Copyright: © Sackey AD, et al. This is an open-access article distributed under the terms of the Creative Commons Attribution License, which permits unrestricted use, distribution, and reproduction in any medium, provided the original author and source are credited.