Journal of Proteomics & Bioinformatics
Open Access
ISSN: 0974-276X
ISSN: 0974-276X
Research Article - (2011) Volume 4, Issue 6
An active area in cancer biomarker research is the development of statistical methods to identify expression signatures reflecting the heterogeneity of cancer across affected individuals. Tomlins et al. [5] observed heterogeneous patterns of oncogene activation within several cancer types, and introduced a statistical method called Cancer Outlier Profile Analysis (COPA) to identify "cancer outlier genes". Several related statistical approaches have since been developed, but the operating characteristics of these procedures (e.g. power, false positive rate), have not yet been fully characterized, especially in a proteomics setting. Here, we use simulation to identify the degree to which an outlier pattern of differential expression must hold in order for outlier-based approaches to be more effective than mean-based approaches. We also propose a diagnostic procedure that characterizes the potentially unequal levels of differential expression in the tails and in the center of a distribution of expression values. We find that for sample sizes and effect sizes typical of proteomics studies, the outlier pattern must be strong in order for outlier-based analysis to provide a meaningful benefit. This is corroborated by analysis of proteomics data from a melanoma study, in which the differential expression is most often present throughout the distribution, rather than being concentrated in the tails, albeit with a few proteins showing expression patterns consistent with outlier expression.
Differential expression analysis is a mainstay of clinical genomics and proteomics research, used to identify genes or proteins that are differentially expressed between two conditions. A traditional approach for data analysis uses a comparison of means such as Student's t-statistic to compare the expression level of two groups, e.g. a normal "healthy" group and a disease group, or disease groups with different degrees of severity. To perform the analysis, a statistic is computed for each molecular feature (e.g. a protein), and the ensemble of such statistics is assessed using a statistical framework such as type-I/type-II error rates, sensitivity/specificity, or false discovery rates.
Statistics based on mean values, such as Student's t-statistic, perform well when all samples in a group share a common mean, with approximately symmetric variation around the mean. We consider this a "homogeneous situation". In heterogeneous diseases such as some forms of cancer including breast [1], lung [2], prostate [3] and melanoma cancer [4], only a subset of the high risk samples exhibit altered expression of a particular protein, resulting in a skewed distribution. While such skew will shift the mean to some degree, the sample mean may not be the most effective way to identify such a pattern. Moreover, a differentially expressed feature could be upregulated in some samples, down-regulated in other samples and normally-expressed in others. In this scenario, the mean expression of this gene or protein could be similar among groups and thus avoid detection using any mean-based approach.
One way to account for this heterogeneity and to improve the detection of differentially expressed genes or proteins is to adopt a modified differential expression statistic that it is more sensitive to heterogeneous patterns of differential expression. To this end, a number of methods have been developed to detect so-called "cancer outlier genes" or genes expressed in only a subset of cancer samples. Methods for cancer outlier profile analysis include the COPA approach of Tomlins et al. [5], the outlier sum (OS) test [6], the outlier robust t-test [7], the MOST method [8], the LSOSS method [9], distribution based outlier sum statistics [10] and others. Compared to the traditional t-statistic, outlier-associated methods have the potential to detect a greater number of differentially-expressed genes in heterogeneous data sets, at a lower false discovery rate. However these methods are less powerful than approaches based on t-statistics when the differential expression is present throughout the distribution, or is concentrated in the center of the distribution, as opposed to being concentrated in the tails. Figure 1 illustrates this difference by showing quantile functions corresponding to two distributions that are different at all quantile values (Figure 1a), and quantile functions corresponding to two distributions that differ only in the upper quantiles, or in the right tail (Figure 1b).

Figure 1: Quantile functions of illustrating differential expression with a constant shift of all quantiles (a) and with outlier-like differential expression that is present only in the right tail (b).
Focusing on the OS approach to outlier analysis, we used three complementary approaches to better understand the circumstances in which outlier-based differential expression approaches have the potential to outperform traditional approaches based on mean differences (such as Student's t-statistic). First, we used a simulation strategy in which the strength of the outlier-pattern of differential expression and the strength of differential expression in the center of the distribution can be independently varied. This allowed us to identify the transition point where the outlier pattern is sufficiently strong for the outlier-based methods to perform best. We then explored a graphical diagnostic that summarizes the patterns of differential expression in a dataset. This diagnostic can be used to reveal the relative amounts of outlier-like versus "central" differential expression in a dataset. Finally, we used a proteomics dataset of serum samples from melanoma patients [11] to contrast the evidence for differential expression obtained using outlier-based versus mean-based approaches to differential expression analysis.
Our simulation studies suggest that approaches based on means are most powerful when the differential expression is strongest in the center of the distribution, or is equally strong at all quantile points. The outlier-based approaches are most powerful when the differential expression is concentrated in the tails of the distribution. Applying our graphical diagnostic to the melanoma data set revealed protein fractions that are differentially expressed primarily in the distribution centers, and protein fractions that are primarily differentially expressed in the distribution tails. However, even the latter proteins still showed shifted mean values, and in this moderate-sized dataset, the outlier approach did not identify any differential expression that was not also captured by the t-statistics (at a fixed significance level). However, inspection of distribution patterns did reveal an outlier-like pattern in several of the differentially expressed proteins, which may aid in understanding their mechanistic roles, or help to better define their utility as biomarkers.
Outlier sum
The outlier sum (OS) statistic is intended to detect a difference between two statistical distributions that is concentrated in one or both tails of the distributions. In terms of data, the difference in the tails results in the presence of "outliers" in one of the two sets of samples being compared. Outlier sum analysis contrasts a reference set of samples to a second set of samples in which outliers may be present. The reference set can be chosen as the one corresponding to lower risk subjects (e.g., subjects who are healthy, have benign lesions, or have slowly progressing disease), with outliers assessed in the contrasting higher risk group. Alternatively, we can consider the reference set to be the higher risk set, based on the idea that the greater part of the low-risk set may already be moving toward a more adverse state, with a smaller fraction of the low-risk set (the outliers) not having yet made this transition.
For a given molecular feature, an outlier is defined as an observed value that is greater than the 75th percentile plus the inter-quantile range (IQR), or less than the 25th percentile minus the IQR. A high OS score means that either a large number of outliers is present (in the non-reference set relative to the reference set), or that a few strong outliers are present. The outlier score for molecular feature i is defined as max (|Wi|, |Wi'|), where:
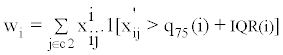
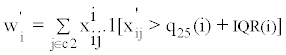
Note that x'ij denotes normalized expression value of molecular feature i in sample j, C2 denotes the non-reference set in which we are assessing for outlier samples, q25(i), q75(i), and IQR(i) represent, respectively, the 25th percentile, the 75th percentile, and the interquartile range for molecular feature i.
Simulation study
Previous simulation studies evaluating outlier-based differential expression methods have used Gaussian mixtures [6,10,12], or t-distributions [10] to produce synthetic data with outlier-type patterns of differential expression. To understand the operating characteristics of outlier-based differential expression analysis in more detail, we used a simulation approach in which the strength of differential expression in the tails and the strength of differential expression in the center of the distribution can be independently varied.
Our simulation studies are defined in terms of the quantile function Q(p) of the distribution of expression values. The defining property of the quantile function is that a value drawn from the distribution has probability p of being less than or equal to Q(p). The simplest form of differential expression is a constant shift of the quantile function, shifting all quantiles, as well as the mean, by the same amount (Figure 1a). To produce outlier-like differential expression (Figure 1b), we shifted the quantile function with a "hinge function" of the form H(p; k, k0) = k*(p-p0)*I(p>=p0), where I() is the indicator function that is equal to one when p>=p0 and zero otherwise. The slope parameter k controls how strongly H deviates from a constant function. When we compare a quantile function Q1(p) to a hinge-shifted quantile function Q2(p) = Q1(p) + H(p; k, k0), we find that the quantiles agree up to the p0 th quantile, but the quantiles for p>p0 are greater under Q2 compared to Q1. This represents an ideal setting for outlier-based analysis, with the advantage becoming stronger as the slope parameter k increases. We note that this construction maintains continuity of the quantile function, consistent with proteomics and genomics data that we have observed.
To aid in interpretation of the simulation studies, all comparisons were made under a fixed value for Cohen's-d effect size [13-14]. We make two types of comparisons - one in which Q1(p) and Q2(p) are constant shifts of each other (i.e. Q2(p) = Q1(p) + k), and one in which Q2(p) and Q1(p) are shifted by a hinge function. In the former case, the value of Cohen's d is fixed by setting the value of k. In the latter case, the value of Cohen's d is fixed by adjusting the values of p0 for a given value of k. Since Cohen's d can be fixed by varying only the parameter p0 of the hinge function, the slope parameter was available for us to change to control the strength of the outlier pattern. This gives us the ability to independently control the differential expression at the center of the distribution and in the tail of the distribution. In all our simulations, we used a normal distribution to determine the baseline quantile function Q1(p), but note that Q2(p) is not normal in the hinge-shifted case.
For each type of data distribution, we compared the power of the t-statistic and outlier sum approaches for detecting differential expression at the conventional type-I error rate of 0.05. This was done for various sample sizes (N=50, 100, 200) and Cohen's-d effect sizes (0, 0.1, 0.2, 0.3, 0.4). The power for detecting differential expression using t-statistics under normal populations for Q1 and Q2 was based on the normal approximation to the power function. All other power results were obtained using simulation. Specifically, the power of the outlier sum approach was estimated as the proportion of simulation runs that reject the null hypothesis of no differential expression at the given significance level (0.05). Since the outlier sum statistic does not have a tractable null distribution, simulation under Q(p) was used to determine the decision threshold. We used 1000 replications for all simulation studies.
Graphical diagnostics
To summarize the pattern of differential expression in the ith protein, we considered the difference Di = Qi1 - Qi2 between the estimated quantile functions Qi1 and Qi2, for the two groups of samples being compared. For a fixed grid of probability points, the difference in quantile functions Di was constructed for each protein, and summarized using principal components analysis (PCA). PCA captures the most important directions of variation in the Di, relative to their mean.
For example, a constant principal component corresponds to constant translation between the quantile functions, producing equal levels of differential expression at all quantiles. A linearly increasing principal component corresponds to differential expressions that change linearly across the quantiles. In practice, these principal components are interpreted relative to the mean value of D, as demonstrated in the analysis of the melanoma data below. The proportion of variance explained by a given principal component indicates the extent to which a particular form of differential expression is present in a dataset. This in turn can be related to differences in statistical power for detecting differentially expressed proteins.
Case study: melanoma dataset
In melanoma, metastasis to sentinel lymph nodes signals a more advanced stage of melanoma, and sentinel lymph node biopsy is common for its prognostic value. A melanoma dataset was used to explore the utility of serum auto-antibodies as biomarkers to distinguish between "node-negative" and "node-positive" melanoma as described by Liu et al. [11]. Node-positive status indicates metastasis to a sentinel lymph node, while node-negative status indicates the absence of metastasis, and thus an earlier stage of cancer. The dataset consisted of 43 serum samples from patients with melanoma - 26 from node-negative melanoma and 17 from node-positive melanoma. Using methods described by Liu et al. [11], a panel of 47 glycoprotein fractions was extracted from a melanoma cell line to bind to (and enable detection of ) auto-antibodies in the patient serum samples. The dataset was presented as a matrix of signal intensity data with 43 columns corresponding to serum samples and 47 rows corresponding to cell line-derived protein fractions. We applied our graphical procedure to this dataset, and calculated t-statistics and OS statistics for each of the 47 glycoprotein fractions.
Simulation study
Figure 2 shows the results of power analysis based on simulation, in the setting where Q2 and Q1 are shifted relative to each other (or equivalently, D is constant). In this setting, the differential expression is homogeneous in that all quantiles, and the mean value, differ by the same amount. The Student t-method provides greater power than the OS method for all effect sizes and sample sizes considered.

Figure 2: Power for Student t analysis and outlier sum analysis for homogeneous data.
Figure 3 shows selected results for the setting where Q1 and Q2 differ by a hinge function. The slope parameter k is plotted on the horizontal axis, and reflects the degree to which the differential expression is concentrated in the distribution tails. We thus expect that the OS method will perform relatively well compared to the Student-t method as this parameter increases. The effect size indicated in each plot is Cohen's d.

Figure 3: Power for Student t analysis and outlier sum analysis for heterogeneous data (rows 2 and 3) and for equally distributed data (row 1).
The powers of both the OS and Student-t methods increase with increasing effect size. When the effect size is small, the OS method outperforms the Student-t method for all tested values of the slope (k), but when the power is somewhat greater, the Student-t method performs better for smaller values of the slope parameter. The first row of Figure 3 shows that when no differential expression is present, both methods maintain the correct type-I error rate. Taken together, Figure 2 and Figure 3 indicate that when the data distribution is approximately homogeneous, the Student t-method outperforms the OS method. But when heterogeneity is present and the differential expression is stronger in the tails, the OS method can outperform the Student t-method. For a fixed level of strength of the outlier pattern (represented by the slope parameter k), the OS method performs increasingly better relative to the Student t-method as the power increases, either due to a larger sample size, or a larger effect size.
We applied our graphical diagnostic procedure to the melanoma dataset to capture the major patterns of differential expression in the 47 glycoprotein fractions. For each fraction, the estimated quantile differences Di between the node-positive group and the node-negative group were constructed using the eleven deciles (i.e. 0, 0.1, 0.2 . 1) as probability points.
Figure 4 shows the results of applying principal components analysis to the Di vectors. The mean value of Di (across the 47 fractions) is shown as the broken line in both plots. The solid curves show the mean plus two different multiples of the first principal component (left plot) and of the second principal component (right plot). The multiples used in the plots were the 5th and 95th percentiles of the corresponding principal component scores. These two dominant principal components explain 61% and 22% of the variance, respectively. The variation resulting from the dominant PC is approximately a vertical translation of the quantile function, in which all quantiles are shifted by roughly the same amount, but the slope is unaffected. The variation resulting from the second PC primarily affects the slope of the quantile function, shifting the pattern of differential expression from the center of the distribution to the tails. Thus we find that an outlier pattern of differential expression may play a role in these data, but it is not as prominent as a simple shifting pattern.

Figure 4: The mean of the quantile function difference Di over the 47 protein fractions is shown (broken line), along with plots of the mean plus two different multiples of the first principal component (left) and the second principal component (right).
We next considered how the Student-t and OS statistics relate to patterns of differences in the quantile functions. The center panel of Figure 5 shows a scatterplot of the t-statistics and OS statistics in the 47 protein fractions. The two statistics are weakly positively correlated, but there are numerous fractions where one statistic is large while the other is not. Thus the statistics are capturing partially overlapping information, with the potential for either statistic to capture information that is complementary to the other.

Figure 5: Scatterplot of OS statistic values (vertical axis) against t-statistic values (horizontal axis). Surrounding the central scatterplot are five examples of estimated quantile functions for the expression values of specific protein fractions.
The five panels of Figure 5 surrounding the central scatterplot show examples of quantile functions corresponding to five of the 47 fractions. When the Student t statistic is large but the OS statistic is close to zero, as in fractions 14 and 23, the pattern of differential expression is approximately a translation. When the OS statistic is large, the pattern of differential expression is more hinge-like, as in fractions 19 and 39. When both statistics are small (e.g. fraction 5), there is no differential expression of any type. These plots show that the OS and t-statistics are capturing complementary patterns of differential expression, and that protein fractions showing both of these complementary patterns can be found in this data set.
Finally, we assessed the statistical evidence for differential expression in each fraction using the Student t-statistic and the OS statistic. Nominal p-values (not adjusted for multiple comparisons) were obtained using permutation analysis with 1000 permutation replications. We found 15 fractions to have nominal significance using the t-statistic, and 1 fraction to have nominal significance using the OS statistic. All fractions that were significant under the OS statistic were also significant under the t-statistic, indicating that in this dataset, the OS approach was unable to uniquely identify any significant fractions. We noted that the OS statistic p-values were non-monotonic functions of the OS statistic magnitudes, which can be explained by the strong dependence of the OS statistic's sampling distribution on the overall shape of the distribution, including the shape of the tails. In contrast, the t-statistic p-values were perfectly monotone in the t-statistic magnitudes.
A standard model of cancer holds that cancer-related pathways are activated by expression of oncogenes [15-16]. However, changes in oncogene expression levels, and of their targets are not universal among individuals with the same cancer [1,17]. This heterogeneity complicates efforts to identify cancer biomarkers for general use. For this and other reasons, regulatory agencies like the Food and Drug Administration often consider cancer biomarker assays as "high-risk", and the regulatory path for biomarker-based diagnostic and prognostic tests is directed by this risk classification. Regulatory approval of cancer diagnostic devices requires a deep understanding of the device's operating characteristics, especially in terms of false negative and false positive results. The presence of heterogeneity as explored here complicates efforts to understand these operating characteristics.
Here we have illustrated that when power considerations are favorable, the OS statistic has improved power relative to the Student t-statistic for identifying patterns of differential expression that are concentrated in one or both tails of a distribution. When the pattern of differential expression is present to an approximately equal degree at all quantiles of the distribution, or is concentrated in the center of the distribution, approaches based on means, like the Student t-statistic, can be more powerful than the OS approach. The potential advantage of the OS approach depends on the sample sizes and effect sizes being such that the t-statistic dominates the OS statistic only for a small range of strongly symmetric distributions. Using our graphical diagnostic approach, and inspecting the test results for the melanoma data set, it seems that power considerations for the melanoma data favor more traditional mean-based approaches. A further complicating factor for use of the OS statistic is the appearance of non-monotonic patterns between the test statistic magnitudes and the corresponding p-values. Nevertheless, by inspecting the pattern of differential expression in the protein fractions identified using Students t-statistic, we were able to identify several protein fractions showing a prominent hinge-like pattern of differential expression.
While outlier-based analysis approaches offer the potential to extract useful information from studies that yield minimal interesting results from conventional methods, these biomarkers are by definition limited in their predictive power in an unselected population. As illustrated in the melanoma study, even markers that are identified using traditional approaches like the Student t-method may turn out to have a heterogeneous pattern of differential expression. Thus, we anticipate that while outlier-oriented statistics like the OS statistic may play a useful role, especially in larger studies, another important consequence of these efforts will result from the more widespread adoption of methods to characterize the detailed pattern of differential expression of candidate biomarkers identified through traditional approaches.
This work was supported in part by the National Cancer Institute under grants 1R21CA124441 (D.M.L) and R01 CA106402 (D.M.L).