Enzyme Engineering
Open Access
ISSN: 2329-6674
ISSN: 2329-6674
Research Article - (2021)Volume 14, Issue 1
Present work aimed at optimizing the carotenoids extraction from pumpkin with enzymatic pre-treatment. A central composite design with four independent variables-cellulose/pectinase ratio (0.25 - 1.91w/w); Incubation temperature (35-55 ̊C); Incubation time (30-150 min); pH (4-6) gave carotenoids yield of 0.689 to 3.820mg/100g. F-value of 39.07 and p value <0.0001 shows that pigment extraction was adequately described by regression model. Linear coefficients of X1, X2, X4, (enzyme ratio, temperature, pH), quadratic coefficient of X12, X22, X32, X42 (enzyme ratio, temperature, time and pH) and interaction coefficient of X1X2 (enzyme ratio and temperature) and X2X4 (temperature and pH) were also significant (p≤0.05). The second order polynomial model had a non-significant lack of fitness, good value of coefficient of determination (0.973) and adequate scattered plot. Surface graph and Derringer’s desired function methodology were used to find the optimal conditions of carotenoids extraction. Maximum carotenoids were extracted when the cellulose/pectinase ratio, incubation temperature, incubation time and pH were 0.97w/w, 42.54 ̊C, 91.58 min and 4.8 respectively. The β-carotene extraction yield was 61.75% under the optimal conditions. Pumpkin’s bio-pigment is a natural source to improve the appearance of food products along with nutritional value.
Pumpkin (Cucurbita maxima Duch) belongs to Cucurbitaceae family which is cultivated in tropical and subtropical regions of the world [1]. In India, it is grown in summer or rainy season and attains maturity in about 90-120 days [2]. Its fruit is oblong, oval or round in shape, flatten at both ends and slightly ribbed with smooth peel. It is usually orange or yellow in colour but some fruits are dark green, pale green, white, red or gray. Global pumpkin production was 22.90 million tons in 2019 with leading producers China, India, Russia, Iran and Unites States [3]. Pumpkin is a valuable source of carotenoids pigment mainly composed of β-carotene (>80 percent) with lesser amount of lutein, lycopene, alpha (α) carotene [4]. Carotenoids are the derivatives of lycopene, which is represented by C40H56 which have a long hydrocarbon chain and 11 conjugated double bonds [5]. Carotenoids are hydrophobic in nature due to long chain of hydrocarbon structure so it is soluble in organic solvent. High number of conjugated double bonds gives color from yellow to orange [6]. It has properties to give protection against many diseases such as cardiovascular diseases, cancer, chronic respiratory disease and diabetes mellitus [7]. Carotenoids provide health-promoting functions such as strengthen the ability of immune system and help the reproductive system to function properly [8].
Extraction of bio-pigments with nutraceutical properties from pumpkin is a challenging task due to its hydrophobic nature and sensitivity to light, temperature and oxidation. Pumpkin pulp treated with pectinase and cellulase to increase pigment extraction [9]. Fine particle size of tomato processing waste and three solvent (acetone, ethanol and hexane) recovered more pigment whereas cooking methods reduced the lycopene content. Optimum conditions for maximum lycopene recovery from tomato processing waste were 1.5% cellulase, 2% pectinase and incubation period of 4 h [10]. In food industry, pigments are extracted for making natural food colorants which imparts color to food products without any side-effect as compared to synthetic colorants. The aim of present work to optimize the enzyme ratio, temperature, time and pH, for maximum pigment extraction from pumpkin pulp by using RSM techniques.
Pumpkin variety ‘Shivkashi’ was procured from a farm located in Amritsar, India. Cellulase (1.07U/mg) and Pectinase (8000-12000U/g) of Aspergillus niger were procured from Himedia Pvt Ltd, Mumbai, India. Standard β-carotene was procured from Sigma Chemical Co, St. Louis, USA.
The fruits were washed, cut into quarters, peeled, and deseeded along with fibrous material, pulped, packed and kept at -18°C. Pulp (10g) was mixed with 30ml distilled water and its pH was adjusted as per the CCRD design. Cellulase and Pectinase enzyme were added and kept in incubator shaker at selected temperatures. Ethyl acetate (100ml) was mixed thoroughly with pumpkin slurry in a separating funnel for the extraction of pigments. The pigment content was determined on HPLC and spectrophotometer.
The moisture content of pumpkin pulp was determined by placing in vacuum oven (Narang Scientific Pvt Ltd, New Delhi, India) at 60±2°C and 100mmHg pressure for 24 h [11]. Total soluble solids were determined by using hand refractometer (Erma, Tokyo, Japan). Titrable acidity was determined by titration method against standardized alkali [12]. Reducing and non-reducing sugars were determined according to Lane and Eynon method [12]. Ascrobic acid was determined by titration method using 2, 6-dichlorophenol indophenol dye solution [12].
Total Carotenoids were determined using an UV visible spectrophotometer at 452nm (Thermofisher Scientific, Welbham, USA). The total carotenoids were measured in term of beta carotene as a standard.
β-carotene content was determined on HPLC system (Waters, Milford,USA) fitted with a photodiode array detector using YMC(5μm) column (Phenomenex). Methanol:ethanol: tetrahydrofuran (75:20:5) mobile phase, 1ml/min flow rate and 452 nm wavelength were used for analytical work. The β-carotene (Sigma Chemical Co, St. Louis, USA) was used as a standard.
The effect of four independent variables X1 (enzyme ratio), X2 (temperature), X3 (time) and X4 (pH) on the total carotenoids content (Y) (dependent variable) were investigated using central composite design (Table 1).
Table 1: Independent variables and their levels used for central composite rotatable
| Run | Variable levels- Actual (coded) | Total Carotenoids(mg/100g) | ||||
|---|---|---|---|---|---|---|
| X1 (Enzyme ratio, w/w)* | X2 (Incubation temperature , oC ) | X3 (Incubation time, min) | X4 (pH) | Experimental | Predicated | |
| 1 | -1 | -1 | -1 | -1 | 1.898 | 1.721 |
| 2 | +1 | -1 | -1 | -1 | 1.382 | 1.517 |
| 3 | -1 | +-1 | -1 | -1 | 0.689 | 0.575 |
| 4 | +1 | +1 | -1 | -1 | 0.833 | 0.901 |
| 5 | -1 | -1 | +1 | -1 | 2.444 | 2.059 |
| 6 | +1 | -1 | +1 | -1 | 1.423 | 1.556 |
| 7 | -1 | +1 | +1 | -1 | 1.101 | 1.062 |
| 8 | +1 | +1 | +1 | -1 | 1.163 | 1.090 |
| 9 | -1 | -1 | -1 | +1 | 1.09 | 1.425 |
| 10 | +1 | -1 | -1 | +1 | 1.263 | 0.945 |
| 11 | -1 | +1 | -1 | +1 | 0.907 | 0.969 |
| 12 | +1 | _+1 | -1 | +1 | 0.924 | 1.020 |
| 13 | -1 | -1 | +1 | +1 | 1.225 | 1.352 |
| 14 | +1 | -1 | +1 | +1 | 0.749 | 0.574 |
| 15 | -1 | +1 | +1 | +1 | 0.918 | 1.046 |
| 16 | +1 | +1 | +1 | +1 | 0.977 | 0.798 |
| 17 | -2 | 0 | 0 | 0 | 1.496 | 1.480 |
| 18 | +2 | 0 | 0 | 0 | 0.918 | 1.028 |
| 19 | 0 | -2 | 0 | 0 | 1.67 | 1.785 |
| 20 | 0 | +2 | 0 | 0 | 0.884 | 0.863 |
| 21 | 0 | 0 | -2 | 0 | 1.115 | 1.025 |
| 22 | 0 | 0 | +2 | 0 | 0.956 | 1.141 |
| 23 | 0 | 0 | 0 | -2 | 1.105 | 1.285 |
| 24 | 0 | 0 | 0 | +2 | 0.782 | 0.697 |
| 25 | 0 | 0 | 0 | 0 | 2.909 | 3.378 |
| 26 | 0 | 0 | 0 | 0 | 3.016 | 3.378 |
| 27 | 0 | 0 | 0 | 0 | 3.435 | 3.378 |
| 28 | 0 | 0 | 0 | 0 | 3.444 | 3.378 |
| 29 | 0 | 0 | 0 | 0 | 3.435 | 3.378 |
| 30 | 0 | 0 | 0 | 0 | 3.585 | 3.378 |
| 31 | 0 | 0 | 0 | 0 | 3.820 | 3.378 |
*Total Enzyme 60mg/100g
Thirty one combinations of the independent variables selected per experimental design for four parameters were used for pigment extraction from pumpkin pulp as mentioned earlier.
Experimental data were processed to get a multiple regression equation which was used to calculate the predicted value of dependent variables:
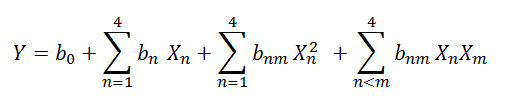
Where Y: Dependent variable i.e. carotenoids content (mg/100g)
X: Independent variable such as enzyme concentration, temperature, time and pH
b0: Model intercept coefficient
bn ,bmand bnm: linear, quadratic and cross product coefficient.
The predicted values obtained from the regression equation were analyzed for coefficient of determination (R2) and adjusted R2, lack of fit, coefficient of variance and residual plot. Significance of the model and its each term was determined via analysis of variance (ANOVA).
Surface graphs were plotted by varying two parameters and hold remaining two variables at centre point. The surface graphs tell the trend of response variables with the change in values of two independent variables. Considering all the surface graphs, the optimal conditions can be predicted.
The optimized conditions of independent variables such as cellulase/pectinase ratio, temperature, time and pH for pigment extraction were employed to extract pigment from pumpkin pulp as mentioned earlier. The predicated value obtained from the models and experiment value under the optimum levels of independent variables were compared to find out the accuracy and validity of the model.
The data of independent and response variables were analyzed using Design Expert 7 (Stat Ease Inc., Minneapolis, USA). The response was computed using quadratic equation obtained by regression coefficient and plotted by choosing two independent variables.
Pulp of pumpkin cultivar ‘Shivkashi’ contained 85.84% moisture, 10.40 ÃÂ??B total soluble solids, 0.25% acidity, 5.58% reducing sugar, 8.89% total sugar, 11.82 mg/100g ascorbic acid, 4.47mg/100g total carotenoids and 2.17mg/100g beta carotene. Author reported the total soluble solids which were higher than our values [13]. Pumpkin pulp contained 7.30% reducing sugar and 9.01% total sugar [14]. Total carotenoids content has been reported to vary as low as 0.45mg/100g and as high as 14.85mg/100g in fresh pumpkin from India [15]. Total carotenoids content of 0.45 to 7.5 mg/100g in pumpkin fruits of different cultivars of Poland, Lithuanian and Russian origin [16]. Total carotenoids content of the pumpkin from local market was within range of reported values in the literature. The variation in carotenoids content might be due to variety, agro-climatic condition or analytical protocol.
Thirty one combination of four independent variables i.e. pectinase and cellulase ratio, temperature, time and pH were used for carotenoids extraction from pumpkin pulp as per the experiment design (Table 1). Ethyl acetate was used for pigment extraction due to its higher efficiency. The experimental value of extracted carotenoids was in range of 0.689 to 3.820mg/100g on fresh weight basis (Table 1). Pumpkin pulp contains carotenoids such as α-carotene, β-carotene, lutein, zeaxanthin and violaxanthin [17] which are lipophilic compounds with different solubility in solvents based on polarity [18, 19]. Ethyl acetate had highest carotenoids yield as compare to acetone, hexane and ethanol [20]. Ethyl acetate solubilized both polar and non-polar component [19]. Present study showed that pigments were easily extracted in ethyl acetate and recorded high pigment yield from pumpkin. Incubation time and enzyme concentration enhanced the yield of carotenoids pigment from pumpkin tissues [9]. Optimization of lycopene extraction from tomato processing waste and found that 1.5% cellulase and 2% pectinase enzyme concentration recovered maximum lycopene [10].
Thirty one combinations of independent variables as per CCRD design were used to extra3ct pigment from pumpkin pulp. The data pertaining to the independent variables and response variables were analyzed using Design Expert software 7 (Stat Ease Inc., Minneapolis, USA) to obtain a regression equation.
Where Y (mg/100g) is the total carotenoids content and X1, X2, X3, and X4 are the coded values of cellulose/pectinase ratio, temperature, time and pH respectively. The regression equation was used to calculate the predicted values of response variable.
In Table 2, the sequential model suggested the quadratic model i.e. our data suitably fitted in quadratic model. The p value of quadratic model was highly significant (p≤0.0001) then other models. F value of the quadratic model was higher than the other model. It indicates the fitness of the model. Cubic model was found to be aliased i.e. it was not used for the prediction of a response.
Table 2: Sequential model fitting for carotenoids extraction.
| Source | Sum of squares | Df | Mean square | F value | p-value | Remark |
|---|---|---|---|---|---|---|
| Mean | 3.09 | 1 | 3.09 | - | - | |
| Linear | 1.22 | 4 | 0.3 | 1.15 | 0.358 | |
| Interactive | 0.65 | 6 | 0.11 | 0.34 | 0.905 | |
| Quadratic | 5.78 | 4 | 1.45 | 103.4 | <0.0001 | Suggested |
| Cubic | 0.14 | 8 | 0.018 | 1.93 | 0.2 | Alised |
| Residual | 0.065 | 7 | 0.0094 | - | - | |
| Total | 10.95 | 30 | 0.365 |
Lack of fit was the main test to indicate the fitness of the model to predict the variations as shown in Table 3. F-value and p-value were 2.42 and 0.170 respectively that shows the lack of fit for model is non-significant. If the lack of fit is non-significant, it indicates the model adequacy and fitness.
Table 3: Lack of fit tests
| Source | Sum of squares | Df | Mean square | F value | P value | Remark |
|---|---|---|---|---|---|---|
| Linear | 6.61 | 20 | 0.33 | 46.02* | 0.0002 | |
| Interactive | 5.96 | 14 | 0.43 | 59.29* | 0.0001 | |
| Quadratic | 0.17 | 10 | 0.017 | 2.42NS | 0.1704 | Suggested |
| Cubic | 0.030 | 2 | 0.015 | 2.06 | 0.2229 | Alised |
| Pure error | 0.036 | 5 | 0.007 |
ANOVA is the statistical technique which is used to find the significance and fitness of model. As shown in Table 4, data was analyzed to get second order model for dependent variable (Y) consisting of a constant, linear, quadratic and interaction terms. Model was highly significant (p≤0.0001). The linear terms, enzyme ratio (X1), temperature (X2) and pH (X4) showed the significant (p≤0.05) effect on pigment extraction. The quadratic terms such as enzyme ratio, temperature, time and pH were highly significant (p≤0.0001). The interaction terms X1X2 (enzyme ratio and temperature) and X2X4 (temperature and pH) had significant (p≤0.05) effect.
Table 4: Analysis of Variance for the extraction of carotenoids from pumpkin pulp.
| Source | Coefficient estimate | Sum of squares | Degree of freedom | Mean square | F value | p-value | Remarks |
|---|---|---|---|---|---|---|---|
| Model | 1.19 | 7.65 | 14 | 0.55 | 39.07* | <0.0001 | Significant |
| X1 | -0.07 | 0.14 | 1 | 0.14 | 10.23* | 0.006 | |
| X2 | -0.18 | 0.77 | 1 | 0.77 | 55.37* | <0.0001 | |
| X3 | 0.018 | 0.007 | 1 | 0.007 | 0.57 NS | 0.461 | |
| X4 | -0.11 | 0.29 | 1 | 0.29 | 20.85* | 0.0004 | |
| X12 | 0.096 | 0.15 | 1 | 0.15 | 10.45* | 0.0056 | |
| X13 | -0.060 | 0.057 | 1 | 0.057 | 4.06 NS | 0.062 | |
| X14 | 0.022 | 0.007 | 1 | 0.007 | 0.54NS | 0.472 | |
| X23 | 0.062 | 0.062 | 1 | 0.062 | 4.41NS | 0.053 | |
| X24 | 0.13 | 0.25 | 1 | 0.25 | 17.89* | 0.0007 | |
| X34 | -0.089 | 0.13 | 1 | 0.13 | 9.03* | 0.0089 | |
| X12 | -0.25 | 1.74 | 1 | 1.74 | 124.69* | < 0.0001 | |
| X22 | -0.24 | 1.62 | 1 | 1.62 | 115.92* | < 0.0001 | |
| X32 | -0.28 | 2.21 | 1 | 2.21 | 157.99* | < 0.0001 | |
| X42 | -0.31 | 2.64 | 1 | 2.64 | 188.55* | < 0.0001 | |
| Residual | 0.21 | 15 | 0.014 | ||||
| Lack of fit | 0.17 | 10 | 0.017 | 2.42NS | 0.1704 | Not significant | |
| R2 | 0.973 | ||||||
| Adjusted R2 | 0.948 | ||||||
| Predicted R2 | 0.866 | ||||||
The coefficient of determination values (R2) was 0.973. It evaluates how close the data are to fit regression line. The predicated R2 of 0.866 is in reasonable agreement with the adjusted R2 of 0.948. High R2 values (p≤0.05), lack of fit was non-significant (p≥0.05) and adjusted R2 close to R2 shows that the models can be used to suitability explain the relationship between dependent and independent variables. As shows in Fig 1(a) the predicated values by regression model and experimental values were plotted and depicted that the data was close to straight line which indicate the adequacy of model. Fig 1 (b) shows the normal percentage probability plot of the residual. The data points form a linear graph indicated that there was no required transformation and has no apparent problem with normality assumption of the regression model. Fig 1 (c) residual versus predicated plot shows the randomly scatter of data around horizontal axis. It indicates the better fit of model with experimental values.

Figure 1: Diagnostic plots for model adequacy
The level of four independent variables where maximum extraction of carotenoids could be obtained was determined by plotting surface graphs. Among four independent variables two were kept at coded zero level while remaining two variables varied to get predicated values using regression model. Surface graph were used to find the optimal level of independent variables.
Fig 2 a,b,d shows the effect of enzyme ratio on pigment extraction. It shows that on increasing the enzyme ratio, the pigment extraction was high but at the final enzyme ratio, the carotenoids content slightly decrease. Combination of pectinase and cellulase enzymes revealed the maximum efficiency of pigment extraction from pumpkin pulp. Table 3 shows that the linear effect (X1), and interaction trend (X12) on pigment extraction was significant (p≤0.05). In quadratic effect, X12 shows highly significant (p≤0.0001) effect i.e. enzyme ratio and temperature both combinedly affected the maximum pigment extraction. Response surface graph shows that initially enzyme rate increase as temperature increases but at the high temperature enzyme becomes denatured as a result decrease pigment extraction. Cellulase and pectinase enzyme used for extraction of carotenoids from pumpkin tissues. Two parameters such as enzyme concentration and incubation time were used for maximum recovery of carotenoids. They showed that cellulase enzyme (33.3%) recovered more carotenoids than pectinase (28.6%) [9]. In several studies reported that combination of cellulase and pectinase enhance the yield of carotenoids from orange peel, sweet potatoes and carrots. The combination of 2 percentages of pectinase and 1percentage of cellulase gave maximum extraction of β-carotene from dried pumpkin pulp at 40ÃÂ?? C for 2h. There was high concentration of pectinase and amount of cellulase was less. Pectinase enzyme disintegrates the cellular structure of solid mass for easy extraction of carotenoids from chromoplast structures [21].

Figure 2: Response surface plots showing the effect of two variables on the total carotenoids yields (mg/100g) from pumpkin pulp while remaining two kept zero level: (a) enzyme ratio and temperature, (b) enzyme ratio and time (c) enzyme ratio and pH (d) temperature and time (e) temperature and pH (f) time and pH.
The experiment was performed in the temperature range of 35 - 55°C. Fig 2 a,c,e shows that the effect of temperature on pigment extraction while keeping two parameters at zero coded level. Table 2 shows that linear effect was significant (p≤0.05), interaction trend with enzyme ratio and pH was also significant (p≤0.05). The quadratic terms show highly significant (p≤0.0001). Response surface graphs shows that pigment extraction increases with increased temperature at the initial stage but at 50-55°C pigment extraction decrease because above 45 °C pigment degrade. The maximum extraction of pigment from pumpkin powder during enzymatic treatment at 40ÃÂ?? C. Extraction of carotene increased slowly with increasing temperature till 40ÃÂ??C but decrease when temperature was further increased [21]. Present results also show that optimal conditions for pigment extraction are about 45 °C. Carotenoids in plants are enclosed within cells and cell membrane. When temperature is increased, the cell wall breakdown and pigment expelled out from the plants cell [22]. Temperature started to pigment degradation above 45°C as a result decreased yield of carotenoids [23]. The temperature increased the solubility and diffusivity of the plant materials into the solution and increases the extraction of pigment [24]. Optimum temperature for maximum enzyme activity is specific and varies with different substrates [25]. At 30ÃÂ??C the extraction of carotenoids was higher. They also stated that temperature helped to stimulate the solutes from pumpkin tissues [19]. At 40°C the extraction yield was maximum and decreased when temperature was increased above 40°C. They also describes that carotene exists in plants as trans-form and at high temperature this trans-isomer converts into cis-isomers. This is called isomerization. Cis-isomers have less pro-vitamin A activity than cis-isomers [26].
Time is one of the important factors affecting the extraction of pigment. Fig 2 b,c,f shows the effect of time on pigment extraction. Quadratic effects (X32) were highly significant (p≤ 0.0001). Interaction and linear trends were non-significant (p≥0.05) as shown in Table 3. Response surface graph depicted that an increase in time increased pigment extraction from pumpkin but at the end decreased pigment extraction while two independent variables were kept at zero coded level. At the initial hours the extraction yield was high but yield decreased slowly when the extraction time extended. The author depicted the optimized the enzyme concentration and incubation time for maximum extraction of pigment from tomato waste [10]. Present study observed similar behavior. During incubation time the plants cell degrade and release insoluble solids in extraction solvent as a consequence the permeability of solvent was reduced. This was the reason behind reduction of extraction yield when incubation time exceeded [27]. β-carotene extraction from oven dried carrots and reported that extraction time had a significant effect [28]. Similar results for pigment extraction time have been reported in the present study. Enzymatic treatment for pigment extraction and the extended incubation time resulted in oxidation of carotene from tissues due to oxidative degradation in the external environmental conditions [29].
The effect of pH on the pigment extraction from pumpkin pulp is shown in Fig 2 d,e,f. The pH is the important variables for enzyme activity in the reaction medium. Enzymatic activity depends upon the active sites and structure which are affected by pH. In Table 3, linear (X4) and interaction (X24) trends showed significant (p≤0.05) while quadratic showed highly significant (p≤0.0001) effect. Response surface graph shows that pH increases the pigment extraction at the beginning till 5 pH then decreases. The pH values affect both substrate and enzyme by changing the conformational structure, charge distribution and the ionic character of substrate which affect the binding ability between enzyme and substrate for transforming substrate to product [30, 31]. All enzymes are active within narrow pH range and for every enzyme there is a pH of maximum activity known as optimum pH. Most enzymes are active in the pH range of 4.5 to 8. Extraction of beta-carotene from dried pumpkin powder with enzymatic treatment used acetate buffer of appropriate pH 5.0 for pectinase and 4.8 for cellulase [21]. The high amount of beta-carotene was extracted from orange processing waste as pH of 5.11 [32]. The cellulase and pectinase showed greater activity in the range of pH 4.5-5.0 [33]. Present results of our study are in the range of literature.
Fig 3 shows the desirability ramp, which developed from optimal points via numerical optimization techniques. In this technique, the optimal conditions were developed to obtain the maximum extraction of pigment from pumpkin and this was determined by Derringer’s desired function methodology. The desirability function scale ranges between 0 and 1, here 0 value of desirability represent completely undesirable response and 1 value represent fully desirable response. According to desirability function methodology, the predicted optimal conditions were enzyme ratio 0.97, temperature 42.54oC, time 91.58 min and pH 4.85 (Fig 3) and the extraction of pigment was 3.56mg/100g with desirability value of 0.99.

Figure 3: Desirability ramp for optimization
To ensure the predicated response, we performed experiment under optimal conditions of enzyme ratio 0.97, temperature 42.54, time 91.58 and pH 4.85. The result obtained was 3.40 mg/100g while the model predicted 3.56 mg/100g. The experimental and predicated values of pigment were compared and depict the adequacy of the quadratic models. The experiment and predicated values are given in Table 5. The experimental data was slightly lower than the predicated values. It shows that the optimum conditions generated by RSM were valid for pigment extraction from pumpkin. The total carotenoids content of the pumpkin pulp was 4.47mg/100g fresh basis whereas as per confirmative studies the extraction yield was 3.40 mg/100g fresh basis. Thus, the extraction yield of the pigment was 76%. The extraction of carotenoids from pumpkin tissues was 33.3% (cellulase treated sample) and 28.6% (pectinase treated sample) [9]. Present results shows that combined effect of cellulase and pectinase enzyme enhance the yield of carotenoids. In literature, mostly data available on dried pumpkin power. But present result shows the maximum extraction from fresh pumpkin pulp.
Table 5: Confirmation study of optimum conditions
Optimum condition |
Pigment extraction yield(mg/100g) |
||||
Enzyme ratio |
Temperature (ÃÂ??C) |
Time (min) |
pH |
Predicated |
Experimental |
0.97 |
42.54 |
91.58 |
4.85 |
3.56 |
3.40 |
The HPLC chromatogram of β-carotene in enzyme treated pumpkin pulp is shown in Fig 4.

Figure 4: HPLC chromatogram of β-carotene pigment extracted from ‘Shivkashi’ cultivar under optimum condition such as enzyme ratio 0.97, temperature 42.54ÃÂ??C, time 91.58 min and pH 4.8 using YMC carotenoids (5μm) column, methanol : ethanol: tetrahydrofuran (75:20:5) mobile phase, 1ml/min flow rate and 452nm wavelength.
The beta carotene content of the pumpkin pulp was 2.17 mg/100g on fresh basis. It constitutes 48.5 % of the total carotenoids. Yellow pumpkin contains 2.12 mg/100g total carotenoids and 1.18 mg/100g β-carotene. It constitutes 55% of β-carotene in total carotenoids [34]. The range of beta carotene in pumpkin was 11.3 to 36.17% (0.2- 15.3 µg/g) [35]. Indian authors studies on β-carotene in pumpkin and reported the range of β-carotene was 1.16-1.18mg/100g [36]. Present results show that the β-carotene in the range of reported values in the literature. Under optimum conditions, the β-carotene yield was 1.34mg/100g fresh basis. The beta carotene yield was 61.75% which was equivalent to total carotenoids yield. The beta- carotene in pumpkin pulp, which was dried in oven, contained 142.38mg/100g [37]. Enzymatic treatment with 2 % pectinase and 1% cellulase for 2h at 40ÃÂ??C recovered 86.98mg/100g β-carotene from dried pumpkin tissues [21]. The optimum conditions for high amount of beta-carotene extract from orange processing waste was pectinase concentration of 0.40% (w/w), ultrasonic time 115.55 min and pH of 5.11 [32]. In literature, extraction of β-carotene from dried pumpkin powder is present, but extraction from fresh pumpkin pulp was not available.
Response surface methodology was used for determination of optimal pretreatment conditions for pigment extraction from pumpkin pulp. Ethyl acetate was used for pigment extraction because it was the most suitable solvent for pigment extraction from pumpkin. Four independent variables were optimized for pigment extraction from pumpkin such as enzyme ratio, temperature, time and pH. Quadratic model was found adequate for predicting carotenoids under experimental conditions. F-value of 2.42 and the associated p-value of 0.170 for lack of fit indicated the suitability of the model to predict the responses. Derringer’s desired function methodology revealed the optimal conditions for maximum pigment extraction from pumpkin were cellulose/pectinase ratio, incubation temperature, incubation time and pH of 0.97w/w, 42.54ÃÂ??C, 91.58min and 4.8 respectively. Under the optimum condition, the maximum carotenoids extraction in confirmatory study was found to be 3.40 mg/100g with extraction yield of 76.06%.
Published: 01-Nov-2025
Copyright: This is an open access article distributed under the terms of the Creative Commons Attribution License, which permits unrestricted use, distribution, and reproduction in any medium, provided the original work is properly cited.