Journal of Fertilization: In Vitro - IVF-Worldwide, Reproductive Medicine, Genetics & Stem Cell Biol
Open Access
ISSN: 2375-4508
ISSN: 2375-4508
Research Article - (2014) Volume 2, Issue 4
In health and disease, biomolecules, which are involved in gene expression, recombination, or reprogramming have to traffic through the nucleoplasm, between Nuclear Pore Complexes (NPCs) and genomic DNA (gDNA). This trafficking is guided by the recently revealed Nuclear Routing Networks (NRNs).
In this study, we aimed to investigate, if the NRNs have established associations with the genomic DNA in situ and if the NRNs have capabilities to bind the DNA de novo. Moreover, we aimed to study further, if nucleoplasmic trafficking of the histones, rRNA, and transgenes’ vectors, between the NPCs and gDNA, is guided by the NRNs.
We used Xenopus laevis oocytes as the model system. We engineered the transgenes’ DNA vectors equipped with the SV40 LTA Nuclear Localization Signals (NLS) and/or HIV Rev Nuclear Export Signals (NES). We purified histones, 5S rRNA, and gDNA. We rendered all these molecules superparamagnetic and fluorescent for detection with Nuclear Magnetic Resonance (NMR), Total Reflection X-Ray Fluorescence (TXRF), Energy Dispersive X-Ray Spectroscopy (EDXS), and Electron Energy Loss Spectroscopy (EELS).
The NRNs span between the NPCs and genomic DNA. They form firm bonds with the gDNA in situ. After
complete digestion of the nucleic acids with the RNases and DNases, the newly added DNA - modified with the dNTP analogs, bonds firmly to the NRNs. Moreover, the NRNs guide the trafficking of the DNA transgenes’ vectorsmodified with the SV40 LTA NLS, following their import into the nuclei through the NPCs. The pathway is identical to that of histones. The NRNs also guide the trafficking of the DNA transgenes’ vectors, modified with the HIV Rev NES, to the NPCs, followed by their export out of the nuclei. Ribosomal RNAs follow the same pathway.
To summarize, the NRNs are the structures connecting the NPCs and the gDNA. They guide the trafficking of the biomolecules between the NPCs and gDNA.
Keywords: Nuclear routing network, Nuclear pore complex, Nuclear envelope, Nuclear localization signal, Nuclear export signal, Nuclear matrix, Lamin networks, Nuclear lattice, Intranuclear transport, Nucleoplasmic trafficking, Transgene, Gene therapy, Gene expression, Gene recombination, Single chain variable fragment antibody, Dual chain variable fragment antibody, Reprogramming
NRN: Nuclear Routing Network; NPC: Nuclear Pore Complex; NLS: Nuclear Localization Signal; NES: Nuclear Export Signal; gDNA: genomic DNA; rRNA: ribosomal RNA; scFv: Single Chain Variable Fragment Antibody; dcFv: Dual Chain Variable Fragment Antibody; EDXS: Energy Dispersive X-Ray Spectroscopy; EELS: Electron Energy Loss Spectroscopy; TRXFS: Total Reflection X-Ray Fluorescence Spectroscopy; NMRS: Nuclear Magnetic Resonance Spectroscopy
In health and disease, biomolecules, which are involved in gene expression, recombination, and reprogramming have to traffic through the nucleoplasm, between Nuclear Pore Complexes (NPCs) of the Nuclear Envelopes (NEs) and specific sites of the genomic DNA (gDNA) [1-13]. The mechanisms of the biomolecules’ transport through the NPCs are intensely studied [14-25]. These studies are further propelled by the fact, that also viruses use these transport pathways, as an alternative to budding [26-31], and so do the transgenes’ vectors used in gene therapy. On the other hand, the processes of gene expression, transgenes’ integration, site specific recombination, and reprogramming are at the core of our attention [1-7]. Meanwhile, mechanisms of nucleoplasmic trafficking of molecules were the subjects of contradicting interpretations [32-37]. However, the Nuclear Routing Networks (NRN), the entirely novel structure guiding trafficking of nucleoplasmin and tRNA, as well as the NLS and NES modified transgenes’ vectors, was revealed only recently [25].
Nevertheless, some observations from the previously published data are worth mentioning here. In a few of the published images, there are present short, thin filaments radiating from the inner rings of the NPCs towards the nuclei’s interiors and from the cytoplasmic rings towards the cytoplasm [38-50]. Although, formats of associations of those filaments with the NPCs and their ultrastructural organization indicate structures entirely different, than lamin networks, nuclear matrices, or nuclear lattices [48-50]. Viruses, gold-tagged nucleoplasmin, or gene transcripts have been observed in the nuclei to be aligned into single file tracks during nucleoplasmic trafficking, however no structures supporting these phenomena were ever demonstrated or discussed [34-37]. Chromosome-specific probes highlighted the chromosomal territories [51-53]. However, in the channels between the meanders of chromatin, there were amorphous materials, which contained the Translocated Promoter Region (Tpr) [54]. Tpr was also localized to the NPCs [55,56]. The NPCs mediated binding of the glucose-regulated repressor Mig1 [57]. The nucleoporin Nup153, Nup98, Nup50, and Nup62 were shown to participate in the build-up of the NPCs [58- 61]. Interestingly, these nucleoporins interacted with transcriptionally active genes in the nucleoplasm [7,61-67].
In this study, we aimed to investigate, if the NRNs have established associations with the chromosomes in situ and if the NRNs have capabilities to bind the DNA de novo. Moreover, we aimed to study further, if trafficking of the histones, rRNA, and transgenes’ vectors, between the NPCs and genomic DNA, is guided by the NRNs.
Oocytes of Xenopus laevis
Mature Xenopus laevis oocytes were used in this study. They were gifts from Dr J. Dahlberg, Dr E. Lund of UW Madison, Dr M. Kloc, UT Dallas, and Dr D. Forbes, UC San Diego. The oocytes were defolliculated and maintained in amphibian Ringer’s solution. The nuclei were isolated in the modified low salt buffer (LSB: 0.5 mM MgC12, 1 mM KCI, 0.1 mM ATP, 10 mM Hepes, pH 7.4) as described [25,68,69]. They were then cleaned of yolk with dissecting needles. They were collected and homogenized for isolation of the DNA, histones, 5S rRNA according to the published protocols [70-73] and using standard reagents (Life Technologies, Foster City, CA, USA). Alternatively, the cleaned nuclei were attached to sticky glass chips treated with 1% silane (Sigma-Aldrich, Saint Louis, MO, USA) in acetone at 60°C for 1 h followed by 1% glutaraldehyde (Sigma-Aldrich, Saint Louis, MO, USA) in distilled water as described [74]. Live recording was performed using the C5985 CCD camera (Hamamatsu, Tokyo, Japan) under MetaMorph imaging software (Universal Imaging, Sunnyvale, CA, USA). In order to see the structures on the inside of the NE, the nuclei were rinsed with the modified Macgregor’s 5:1 buffer (10 mM HEPES, 83 mM KCI, 17 mM NaCI, 0.5 mM MgC12, 0.1 mM ATP, pH 7.4) and opened with micro needles. The oocyte nuclei contained a contractile gel due to the presence of actomyosin, which gently dissolved. The nuclear preparations were finally treated with DNAase and RNase (Promega, Madison, WI, USA) to assure complete removal of DNA and RNA. For studies of the active transport, the buffers were supplemented with 0.3 mM apyrase or maintained at 4°C. Nuclei and nuclear envelopes remained attached to the sticky carriers during all procedures that followed. The NE samples were either chemically fixed or rapidly cryo-immobilized.
Single and dual chain variable fragment antibodies (Fvs); Transgenes’ vectors (TGVs); Biomolecules
The vectors carrying the coding sequences for the anti-dsDNA scFvs and dsFvs were generated, with the Institutional Review Board (IRB) approval and with the Informed Consent (IC), as described earlier from the fresh blood drawn from the patients suffering Systemic Lupus Erythomatosus (SLE), Rheumatoid Arthritis (RA), and cancers [75,76]. The B cells were isolated using the superparamagnetic scFvs and dsFvs targeting CD19 and CD20 respectively. The total mRNA was isolated using Trizol reagent (Molecular Research Center, Inc. Cincinnati, OH, USA). The cDNA was generated using random hexamers (Intergrated DNA Technologies, Coralville, IA, USA) and reverse transcriptase (Promega, Madison, WI, USA). The cDNA quality was tested by the polymerase chain reaction (PCR) of beta actin and GAPDH as reference genes with the commercially available primers (ABI, Foster City, CA, USA). For amplification of variable fragments, the primers sets were designed using the Kabat database. They were synthesized on the 380A DNA Synthesizer (ABI, Foster City, CA, USA). The vectors carrying the coding sequences for DNase and RNase were generated, after the Institutional Review Board (IRB) approval and with the Informed Consent (IC), as described from the fresh blood drawn from the patients suffering SLE and RA as described. For amplification of the coding sequences, the primers sets were designed using the sequences in Public Domain of the GenBank. The coding sequences for the anti-digoxigenin, anti-biotin, anti-fluorescein scFvs were amplified by polymerase chain reaction using the mix of the plasmid DNA, synthesized primers, dNTPs, and Taq DNA polymerase (Hoffmann–La Roche, Basel, Switzerland) using the Robocycler (Stratagene, San Diego, CA, USA) from the constructs described earlier [75]. The coding sequence for the SV40 Large T Antigen (LTA) NLS - PKKKRKV was amplified from the SV40 Large T antigen plasmid (ATCC, Manassas, VA, USA). The coding sequence for the HIV Rev NES - LPPLERLTL was amplified from the HIV Rev plasmid (ATCC, Manassas, VA, USA). The coding sequences were cloned into the plasmid vectors and expressed in myelomas (ATCC, Manassas, VA, USA). The closed, circular, double stranded DNA (ccdsDNA) plasmid constructs coding for the Fvs targeting catalase, glutathione peroxidase, superoxide dismutase, DNase, and RNase were prepared and tested for their integrity during the trafficking as described earlier [74]. The dNTPs analog: Biotin-dATP, Biotin-dCTP (Life Technologies, Grand Island, NY), FITC-dUTP, Digoxigenin-dUTP (Hoffmann–La Roche, Basel, Switzerland) were incorporated into the dsDNA for the trafficking studies. The scFvs were expressed to contain either directly coordinating domain for Gd, Eu, or Tb, or binding groups for DTPA or DOTA. Ten readings from ten different samples were acquired with 1 million scintillations recorded on the EDXS. The genomic DNA was isolated (Life Technologies, Foster City, CA, USA) and sheared using Branson ultrasound generator (Emerson, Danbury, CT, USA). It was modified by incorporating dNTPs analogs: Biotin-14-dATP, Biotin-14-dCTP (Life Technologies, Grand Island, NY), FITC-dUTP, Digoxigenin-dUTP (Hoffmann–La Roche, Basel, Switzerland) by terminal transferase (Hoffmann–La Roche, Basel, Switzerland) as described [74]. The isolated histones were modified with Sulfo-NHSBiotin (Pierce, Rockford, IL, USA). The human albumin was modified by incorporation of the synthesized oligopeptides: the HIV Rev NES or the SV40 LTA NLS, through the EDC hetero-bifunctional linkers (Pierce, Rockford, IL, USA). The samples were labeled with the Fvs followed by calculation of the mean and standard deviation with the statistical confidence accepted for P<0.05. The data were displayed as the mean +/- 1 SD using Prism 6 (GraphPad, LaJolla, CA, USA) and SigmaPlot (Systat, San Jose, CA, USA).
Microinjections
Xenopus laevis oocytes were maintained in amphibian Ringer’s solution. Just prior to the microinjections, the oocytes were spun down at 650 rpm to position the nucleus just below the plasma membrane near the animal pole. This facilitated the intranuclear microinjections. This also assured the perinuclear microinjections close to the nuclear envelope, but without mistakenly injecting the nuclei [70]. Then, intra-cytoplasmic and intra-nuclear microinjections were conducted using glass micropipettes (10 micrometer mouth diameter) mounted into micromanipulator (Narishige, Tokyo, Japan) on an inverted microscope (Nikon, Tokyo, Japan or Zeiss, Oberkochen, Germany, EU) according to established procedures. Exactly 50 nL volumes of solutions containing non-viral transgenes’ vectors or biomolecules described above were injected by pressure controlled pulses. At different time intervals, the whole oocytes were cryo-immobilized. Subsequently, the concentrations of the transgenes in different organelles of the oocytes were measured by means of elemental analysis with EDXS, NMRS, XTRFS, or EELS. Ten readings from ten different samples were acquired followed by calculation of the mean and standard deviation with the statistical confidence accepted for the P value<0.05. The data were displayed as the mean +/- 1 SD using Prism 6 (GraphPad, LaJolla, CA) and SigmaPlot (Systat, San Jose, CA).
Cryo-immobilization
The cells were cryo-immobilized within 10 ms down to –196°C at 2000 atm within the pressure chamber of the high pressure freezing machine HPM 10 (Bal-Tec, Liechtenstein, EU). Alternatively, if the nuclear envelopes were isolated and attached to the chips, then they were cryo-immobilized within liquid pentane using the plunge freezer [40]. The frozen samples were sectioned on cryo-ultramicrotome (Leica Microsystems Inc, Buffalo Grove, IL, USA). All the samples were stored in liquid nitrogen until further processing by freeze-substitution and embedding for sectioning FSD 010 (Bal-Tec, Liechtenstein, EU) or freeze-fractured and freeze-dried BAF 060 (Bal-Tec, Liechtenstein, EU).
Chemical fixation
Isolated Xenopus laevis oocyte nuclei attached to the chips were fixed in 1% glutaraldehyde and 0.2 % tannic acid in the LSB. This was followed by post-fixing in 1% osmium tetroxide in the LSB as described [77]. They were frozen by plunge freezing and stored in liquid nitrogen. After freeze-substitution with acetone on the freeze-substitution device FSD 010 (Bal-Tec, Liechtenstein), the preparations were embedded in epon 812 (Ladd, Williston, VT) and sectioned. Alternatively, the samples were dehydrated in ethanol, dried in critical point of CO2, and coated at -100°C with C/Pt or Cr on cryo-coating BAF060 (Bal-Tec, Liechtenstein, EU).
EELS, EDXS, NMR, NIB, TRXF
Spectroscopy was pursued as described in previous researches [74]. Briefly, the field emission, scanning transmission, electron microscope FESTEM HB501 (Vacuum Generators, Kirkland, WA, USA) was equipped with the energy dispersive x-ray spectrometer (EDXS) (Noran, Middleton, WI, USA) and post-column electron energy loss spectrometer (EELS) (Gatan, Pleasanton, CA, USA). The cryo-energy filtering transmission electron microscope 912 Omega was equipped with the in-column, electron energy loss spectrometer (EELS) (Zeiss, Oberkochen, D, EU). The images were acquired using the CCD camera operating under the image acquisition and processing software (SIS, Herzogenrath, Germany, EU or Emispec Systems, Tempe, AZ, USA). The FESEM S3400 was equipped with the EDXS (Hitachi Tokyo, Japan). The SEM 1530 (Zeiss, Oberkochen, Germany) was equipped with the EDXS Voyager (Noran, Middleton, WI, USA). For quantitative analysis the EDXS or total reflection x-ray fluorescence unit (TXRF) was used (Bruker AXS, Fitchburg, Madison, WI, USA). For quantitative relaxivity measurements the nuclear magnetic resonance scanner was employed WB 400 Hz (Bruker Optics, Dallas, TX, USA). For threedimensional analysis, the in-register pairs of images were acquired electronically with changing tilt of the stage. The quantitative and qualitative reference control elemental spectra were acquired on the standards from the National Institute of Standards and Technology (Gaithersburg, MD, USA). The concentrations of the vectors at different compartments were determined using EDXS, TRXFS, and EELS elemental mapping. All the vectors and biomolecules were modified to contain chelating domains, which were saturated with Gd, Tb and Eu. Alternatively, they were tagged with the Fe/Au core-shell nanoparticles. EDXS, TXRF, EELS generated elemental spectra from every single pixel of the imaged area to create the elemental data stack. From this stack, the map of the selected element was extracted to create the map of this element distribution with the element concentration determined. The overall oocyte ultrastructure was revealed using EELS at zero energy loss. The elemental maps of the exogenous atoms were overlapped over the ultrastructural topography map of the oocyte. This way the concentrations of the biomolecules within the oocytes’ compartments were determined.
Figure 1 illustrates the work-flow of the project. The oocytes were de-folliculated and spun down to move the nuclei to the poles. The nucleoplasmic or cytoplasmic microinjections (a) of the biomolecules, including transgenes’ vectors, were performed. The nuclei were isolated (b), by tearing the cell membrane with surgical forceps and rinsing with the buffer. Further, the preparations were pursued along the two different routes. First (c), the nuclei were attached to the sticky carriers. For studies of the nucleoplasmic side of the nuclear envelope, they were opened to remove nucleoplasm. Occasionally, they were digested with DNase and RNase. Then, after thorough rinsing, these preparations were exposed to the modified DNA for binding assays. The nuclear envelopes, attached to the carriers, were cryo-immobilized and processed for molecular imaging and elemental analysis with the aid of the Energy Dispersive X-Ray Spectroscopy (EDXS) and Electron Energy Loss Spectroscopy (EELS). All the probes and scFvs used in this project were modified to chelate the exogenous metals, thus were unambiguously distinguished from the cell structures and specifically identified with high sensitivity. Second (d), the nuclei were rapidly cryoimmobilized and/or homogenized. The DNA, RNA, and proteins were separated for analysis with nuclear magnetic resonance spectroscopy (NMRS) or Total Reflection X-Ray Fluorescence Spectroscopy (TRXFS).
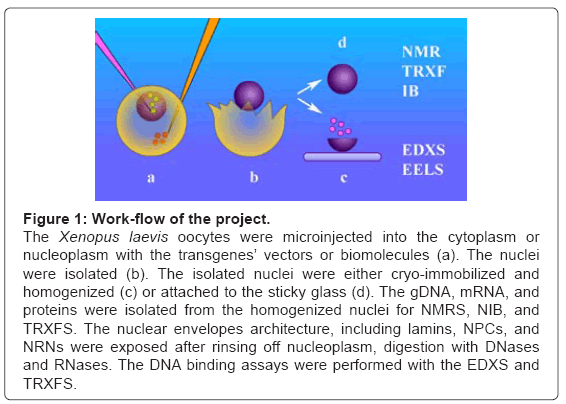
Figure 1: Work-flow of the project.
The Xenopus laevis oocytes were microinjected into the cytoplasm or nucleoplasm with the transgenes’ vectors or biomolecules (a). The nuclei were isolated (b). The isolated nuclei were either cryo-immobilized and homogenized (c) or attached to the sticky glass (d). The gDNA, mRNA, and proteins were isolated from the homogenized nuclei for NMRS, NIB, and TRXFS. The nuclear envelopes architecture, including lamins, NPCs, and NRNs were exposed after rinsing off nucleoplasm, digestion with DNases and RNases. The DNA binding assays were performed with the EDXS and TRXFS.
The Figure 2 reveals the overall architecture of the ultrastructures assembled onto the nucleoplasmic side of the Nuclear Envelope (NE). The sample was prepared by gentle removing of nucleoplasm, rapid cryoimmobilization, freeze-drying, and cryo-coating. The image was acquired in the Field Emission Scanning Electron Microscope (FESEM). It is representative of a hundred studied. The three main ultrastuctures are apparent: Nuclear Routing Networks (NRNs), Nuclear Pore Complexes (NPCs), and lamin networks. In the field of view, there are present numerous “baskets” of the Nuclear Pore Complexes (NPC), which protrude from the nuclear envelope. They are “inserted” into the lamin networks. Bundles of 6 nm thin filaments project from the tops of most of the NPC “baskets”. The bundled filaments create inside-empty micro-tunnels. They project into the nucleus’ interior.
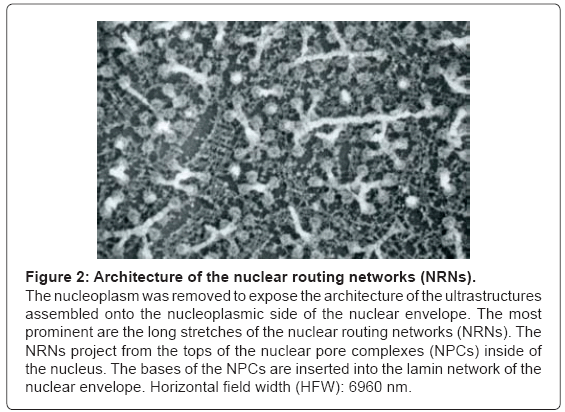
Figure 2: Architecture of the nuclear routing networks (NRNs).
The nucleoplasm was removed to expose the architecture of the ultrastructures assembled onto the nucleoplasmic side of the nuclear envelope. The most prominent are the long stretches of the nuclear routing networks (NRNs). The NRNs project from the tops of the nuclear pore complexes (NPCs) inside of the nucleus. The bases of the NPCs are inserted into the lamin network of the nuclear envelope. Horizontal field width (HFW): 6960 nm.
These bundles extend for distances from 2 micrometers to more than 10 micrometers in lengths. Short and long stretches of the filamentous bundles inter-connect with each other to form nuclear networks. In a few cases, attached fibers have all broke off the “baskets”, thus revealing the top rings only. At all distal ends of the eight fibers (projecting from the 120 nm diameter, intra-nuclear ring of the NPCs) there are the 10 nm in diameter spheres. These spheres attach to each other to form the “necklace-like” rings-as if they would be holding together the bundles of filaments. These rings are distributed along the filamentous bundles with the regular periodicity of approximately 50 nm. Collectively, these structures build the Nuclear Routing Networks (NRNs) described in more details earlier [25].
The results of an alternative method of the sample preparation are illustrated in the Figure 3. After extracting chromatin, the nuclear envelopes were cryoimmobilized, as whole mounts, freeze-substituted, embedded, and sectioned. The samples were imaged with the Electron Energy Loss Spectroscopy (EELS). The image is representative for ten preparations. The long projections of the nuclear routing networks extend from the NPCs. They have 50 nm periodicities along their length. Their architecture is identical to that revealed in the Figure 2.
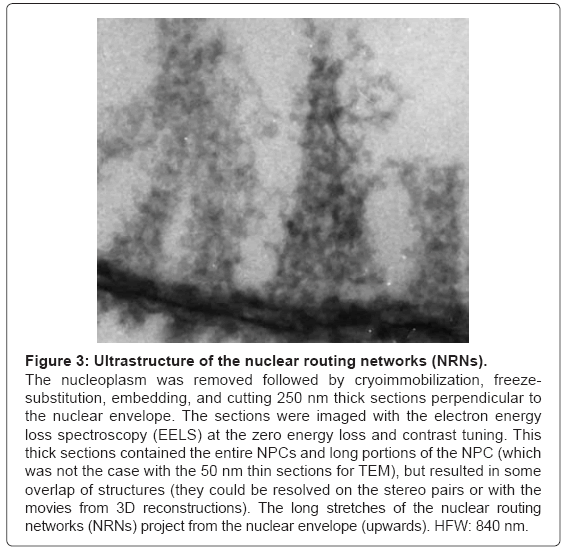
Figure 3: Ultrastructure of the nuclear routing networks (NRNs).
The nucleoplasm was removed followed by cryoimmobilization, freezesubstitution, embedding, and cutting 250 nm thick sections perpendicular to the nuclear envelope. The sections were imaged with the electron energy loss spectroscopy (EELS) at the zero energy loss and contrast tuning. This thick sections contained the entire NPCs and long portions of the NPC (which was not the case with the 50 nm thin sections for TEM), but resulted in some overlap of structures (they could be resolved on the stereo pairs or with the movies from 3D reconstructions). The long stretches of the nuclear routing networks (NRNs) project from the nuclear envelope (upwards). HFW: 840 nm.
Studies aimed to reveal associations of the NRNs with chromatin were pursued on two ways: (1) labeling of the samples with the scFv antibodies targeting genomic DNA, while revealing the NRNs; (2) digesting all the nucleic acids from the oocytes’ preparations with the DNases and RNases followed by DNA binding assays.
To identify the structures attached to the NRNs, a panel of clones of the antibodies targeting the dsDNA was used as shown in the Figure 4. All these Fvs contained the domains chelating Gd, Eu, or Tb as described earlier. The nuclear envelopes were exposed by gentle removing chromatin gel, which followed by immunolabeling with the Fvs targeting the dsDNA. Thereafter, the samples were rapidly cryoimmobilized, freeze-substituted, and cryo-sputter-coated to render them good electro-conductors and high secondary electron emitters. This Figure 4 illustrates the preparation representative of twenty different preparations. The overview of the architecture is revealed with the secondary emission as shown in the Figure 4a. The NRNs architecture is identical to that shown in figures 2 and 3. Conglomerates of amorphous structures attached to the NRNs were of particular interest. They were probed by labeling with the Gd chelated Fvs targeting the genomic dsDNA. The sample was analyzed with the EDXS as illustrated in the figure 4b, shown as the binary elemental distribution map. This elemental distribution map was constructed in several steps. First, the structural overview was acquired as the reference. Second, the elemental spectrum profile was acquired for every pixel of the image to create the elemental composition data bank. Third, a map of Gd distribution in the sample was extracted from the elemental composition data bank. Since the Gd atoms were chelated within the dedicated domains of the Fvs, and then the Gd distribution map was indicative of the distribution of the Fvs, thus the distribution of the genomic DNA. Fourth, superimposing the elemental Gd map from over the architecture overview revealed distribution of the Fvs against the cell structures as shown in the Figure 4c. After outlining areas of the oocyte compartments on the computer screen, the areas containing Gd atoms were automatically calculated by the elemental analysis software ceiled at 1 million counts. Since all and only, the anti- DNA Fv clones chelated Gd, then distribution of Gd was indicating with high specificity and high sensitivity, the distribution of the gDNA. The associations of the dsDNA with the NRNs were evident. Several controls were run to validate these results. First, when the data were acquired from the unlabeled samples, then no scintillations were counted at the Gd energy peak above the sensor noise (black screen). Second, labeling with the isotypic antibodies had no counts above scintillation noise, thus not statistically significant influence on the signal recorded from the anti-dsDNA. Third, initial labeling with the elemental tag free antidsDNA scFv followed by the scFv tagged with Gd, Eu, or Tb resulted in very low scintillation counts. All these observations were validated by quantification and statistical analysis, as illustrated in the Figure 5. For that purpose ten EDXS scintillation counts’ at the Gd, Tb, or Eu energy edge were acquired from ten randomly selected areas from ten different samples. A similar approach, but involving chelated Gd, Eu, or Tb coordinated in the metal chelate of the anti-biotin scFv or anti-digoxigenin resulted in the same outcome. The data were further validated with the NMRS and TRXRFS. The statistical confidence was approved with the unpaired t test at the P value<0.0001. The variances were significantly different in the F test and approved at the P value<0.0001. One way ANOVA analysis resulted in the variance P value<0.0001 with the means significantly different P<0.05. The Bartlett’s test for equal variances was calculated at the P value<0.0001. This was indeed the quantitative proof, that the clusters attached to the NRNs indeed contained the genomic DNA.
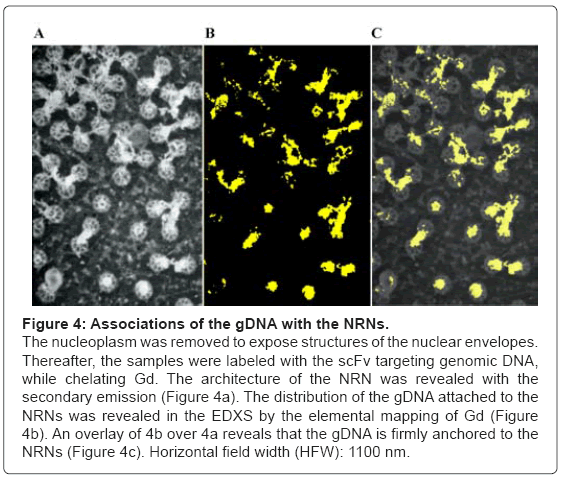
Figure 4: Associations of the gDNA with the NRNs.
The nucleoplasm was removed to expose structures of the nuclear envelopes. Thereafter, the samples were labeled with the scFv targeting genomic DNA, while chelating Gd. The architecture of the NRN was revealed with the secondary emission (Figure 4a). The distribution of the gDNA attached to the NRNs was revealed in the EDXS by the elemental mapping of Gd (Figure 4b). An overlay of 4b over 4a reveals that the gDNA is firmly anchored to the NRNs (Figure 4c). Horizontal field width (HFW): 1100 nm.
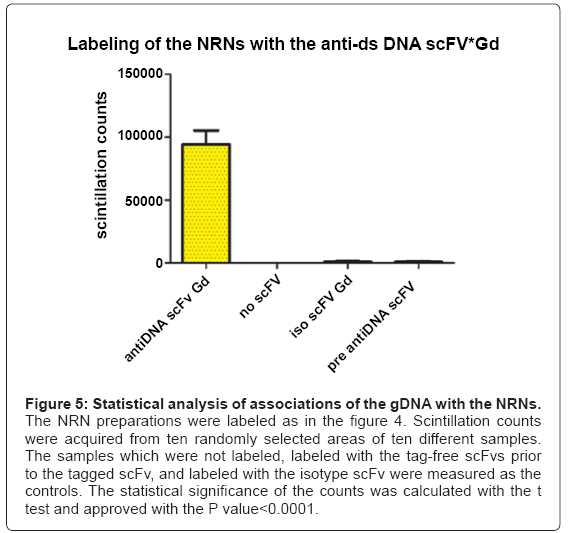
Figure 5: Statistical analysis of associations of the gDNA with the NRNs.
The NRN preparations were labeled as in the figure 4. Scintillation counts were acquired from ten randomly selected areas of ten different samples. The samples which were not labeled, labeled with the tag-free scFvs prior to the tagged scFv, and labeled with the isotype scFv were measured as the controls. The statistical significance of the counts was calculated with the t test and approved with the P value<0.0001.
To further identify the structures assembled onto the NRNs, the DNA and RNA were entirely removed from the samples by digestion with the DNase and RNase mixtures, which followed by the chelated DNA binding assay as shown in the Figure 6. In this assay, after digestion with the DNases and RNases, and thorough rinsing, all the nucleic acids were entirely removed from the samples. Thereafter, the samples were exposed to the genomic DNA tagged with Gd, Eu, or Tb, while being suspended in a solution of the diluted nucleoplasm to retain possible interfacing molecules. Prior to this binding assay, the genomic DNA was isolated and purified from the oocytes, sheared with ultrasound, and thereafter modified by incorporation of the dNTPs analogs: Biotin-14-dATP, Biotin-14-dCTP, FITC-11-dUTP, or Digoxigenin- 11-dUTP. These tags were then linked with the Fv targeting biotin, digoxigenin, or FITC, while coordinating Gd, Tb, or Eu according to the technology described earlier. This sample is representative of twenty different preparations. The structural overview of the sample acquired at the secondary emission is shown in the Figure 6a. The main difference between the samples, prepared by digestion with DNases and RNases versus the one, in which digestion was followed by labeling with the modified DNA, is presence of amorphous material attached to the NPCs and NRNs in the latter sample. In the field of view, there are a few NPCs with the open, empty tops. The amorphous material attached to the NRNs and NPCs was identified with the Energy Dispersive X-Ray Spectroscopy (EDXS). The elemental binary map of the added, modified DNA is shown in the Figure 6b. The overlay of the added DNA distribution over the nuclear structures is shown in the Figure 6c. Considering that only the modified DNA contained chelated metals, incorporated via dNTP analogs, the conclusion was clear, that the structures, which firmly adhered to the NRNs, were indeed the modified DNA added to the samples previously depleted of any traces of the native genomic DNA. Three control tests were performed to validate the above findings. First, the samples which were digested with DNases and RNases, but not labeled with the DNA modified with the dNTP analogs coordinating the Gd. Such samples did not generate the counts above the scintillators’ noise. Second, labeling with the Fvs anti-dsDNA without elemental tags prior to labeling with the Fvs coordinating Gd resulted in the signal counts minimally above the threshold of detection. This was indicative of the DNA binding sites being occupied. Third, labeling of the NRN preparations with the mixes of the tagged and non-tagged anti-dsDNA scFv reduced the levels of the scintillation’s counts. The results, obtained from coordinating Eu or Tb, were identical. These observations were quantified and analyzed statistically as shown in the Figure 7. For that purpose, the scintillation counts were acquired in the EDXS from ten randomly selected areas from ten different preparations of the NRNs. The statistical confidence was satisfied with the t test P value<0.0001. The variances were significantly different in the F test with the P value<0.0001.
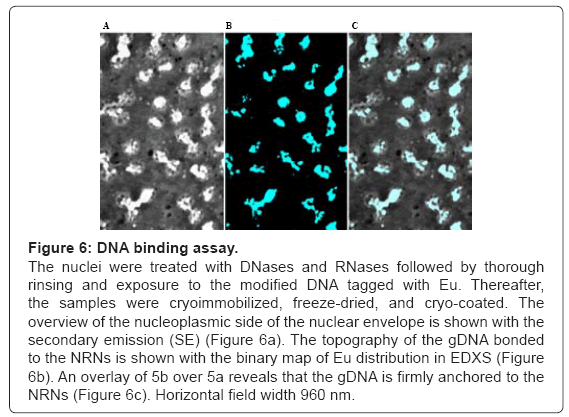
Figure 6: DNA binding assay.
The nuclei were treated with DNases and RNases followed by thorough rinsing and exposure to the modified DNA tagged with Eu. Thereafter, the samples were cryoimmobilized, freeze-dried, and cryo-coated. The overview of the nucleoplasmic side of the nuclear envelope is shown with the secondary emission (SE) (Figure 6a). The topography of the gDNA bonded to the NRNs is shown with the binary map of Eu distribution in EDXS (Figure 6b). An overlay of 5b over 5a reveals that the gDNA is firmly anchored to the NRNs (Figure 6c). Horizontal field width 960 nm.
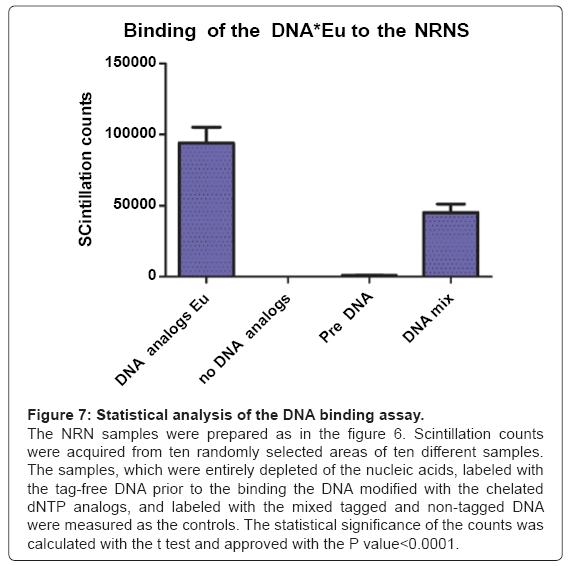
Figure 7: Statistical analysis of the DNA binding assay.
The NRN samples were prepared as in the figure 6. Scintillation counts were acquired from ten randomly selected areas of ten different samples. The samples, which were entirely depleted of the nucleic acids, labeled with the tag-free DNA prior to the binding the DNA modified with the chelated dNTP analogs, and labeled with the mixed tagged and non-tagged DNA were measured as the controls. The statistical significance of the counts was calculated with the t test and approved with the P value<0.0001.
Studies aimed to determine involvement of the NRN into trafficking of biomolecules between the NPCs and chromatin were pursued using four assays: SV40 LTA NLS-modified transgenes; (2) chelate-modified histones; (3) HIV Rev NES-modified transgenes; (4) chelate-modified rRNA. The results are illustrated in the figures 8-11. All the experiments were quantified by measuring the final concentration of the chelated metals followed by statistical analysis at the final points of the assays. That way, all these biomolecules were quantified primarily with the EDXS, but also followed by the NMRS, TRXFS, EELS, or fluorometry. More precisely, the transgenes’ vectors were bioengineered to carry the closed, circular dsDNA (ccdsDNA) constructs [74]. The DNA had incorporated dNTP analogs modified with biotin, digoxigenin, or fluorescein. They served to lock the vectors into the transgenes’ constructs. They also had the dNTP analogs incorporated into the strands to determine integrity of the plasmid constructs within the vectors and to report trafficking of the vectors. For intra-nuclear import, the vectors consisted of the SV40 LTA Nuclear Localization Signal (NLS), anti-biotin domain-anchoring the dsDNA, and chelating domain–harboring Gd, Eu, Ru, or Tb. For extranuclear export, the vectors consisted of the HIV Rev Nuclear Export Signal (NES), and metal binding domains. The third and fourth type of the vectors-named shuttle vectors consisted of the NES and NLS domains bioengineered either with the anti-digoxigenin or with the anti-biotin Fvs. Microinjections of these vectors and biomolecules into oocytes helped to probe the functions of the nucleo-cytoplasmic transport. At different time intervals passing from the moment of microinjections, the oocytes were cryoimmobilized. They were processed by freeze-substitution, embedding and sectioning. The studies were conducted either on sections with the EELS and EDXS. Alternatively, the studies were conducted on the whole mounts with the NMRS and TXRFS preparations, which were thawed and separated into the fractions: nucleoplasm, nuclear envelope and associated structures, cytoplasm. This procedure prevented any translocations of labeled molecules and/or antibodies during initial stages of the preparation and accuracy of the quantitative analysis. The data from ten experiments for each of the transgenes were averaged, the standard deviations calculated and normalized as the ratios between three main compartments: nucleoplasm, NRN+NPC, cytoplasm. The statistical analysis was conducted on the counts from the start and end points of experiments with the statistical significance from the t test approved at the P value<0.01. The results are presented in the figures 8-11.
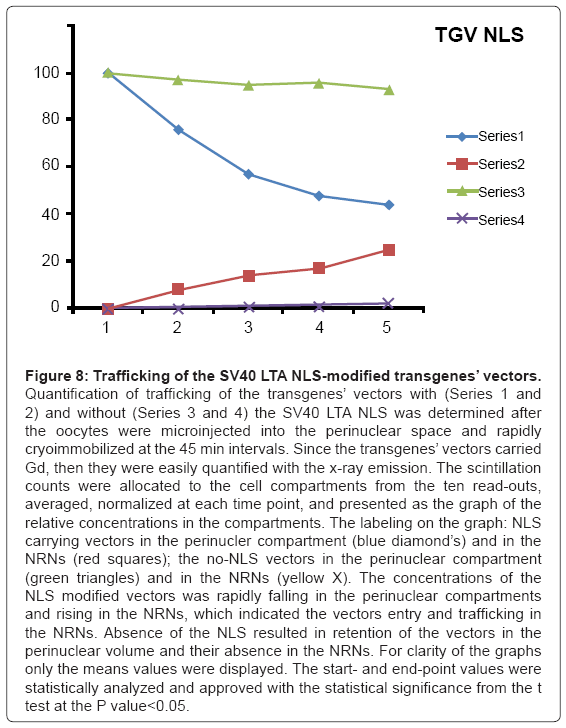
Figure 8: Trafficking of the SV40 LTA NLS-modified transgenes’ vectors.
Quantification of trafficking of the transgenes’ vectors with (Series 1 and 2) and without (Series 3 and 4) the SV40 LTA NLS was determined after the oocytes were microinjected into the perinuclear space and rapidly cryoimmobilized at the 45 min intervals. Since the transgenes’ vectors carried Gd, then they were easily quantified with the x-ray emission. The scintillation counts were allocated to the cell compartments from the ten read outs, averaged, normalized at each time point, and presented as the graph of the relative concentrations in the compartments. The labeling on the graph: NLS carrying vectors in the perinucler compartment (blue diamond’s) and in the NRNs (red squares); the no-NLS vectors in the perinuclear compartment (green triangles) and in the NRNs (yellow X). The concentrations of the NLS modified vectors was rapidly falling in the perinuclear compartments and rising in the NRNs, which indicated the vectors entry and trafficking in the NRNs. Absence of the NLS resulted in retention of the vectors in the perinuclear volume and their absence in the NRNs. For clarity of the graphs only the means values were displayed. The start- and end-point values were statistically analyzed and approved with the statistical significance from the t test at the P value<0.05.
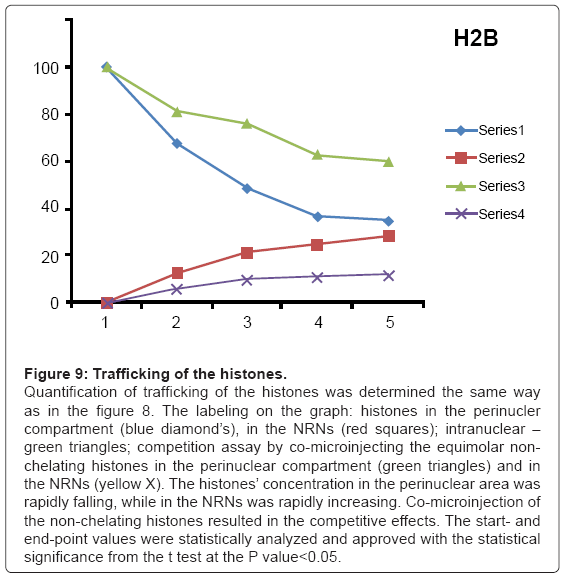
Figure 9: Trafficking of the histones.
Quantification of trafficking of the histones was determined the same way as in the figure 8. The labeling on the graph: histones in the perinucler compartment (blue diamond’s), in the NRNs (red squares); intranuclear – green triangles; competition assay by co-microinjecting the equimolar nonchelating histones in the perinuclear compartment (green triangles) and in the NRNs (yellow X). The histones’ concentration in the perinuclear area was rapidly falling, while in the NRNs was rapidly increasing. Co-microinjection of the non-chelating histones resulted in the competitive effects. The start- and end-point values were statistically analyzed and approved with the statistical significance from the t test at the P value<0.05.
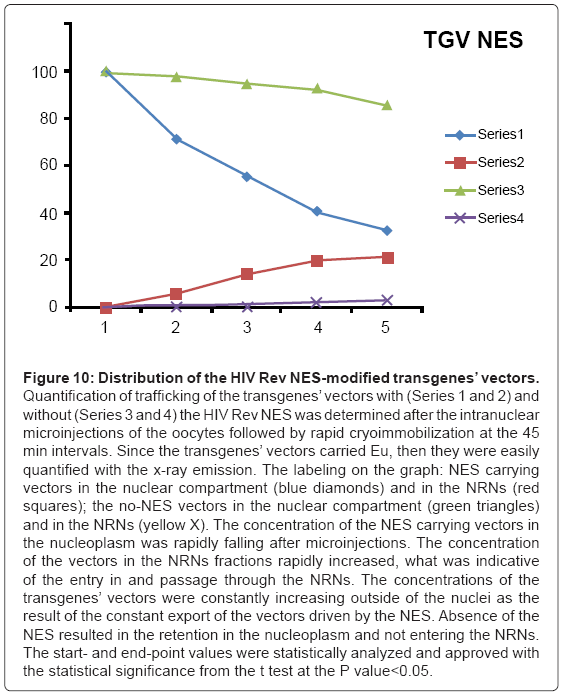
Figure 10: Distribution of the HIV Rev NES-modified transgenes’ vectors.
Quantification of trafficking of the transgenes’ vectors with (Series 1 and 2) and without (Series 3 and 4) the HIV Rev NES was determined after the intranuclear microinjections of the oocytes followed by rapid cryoimmobilization at the 45 min intervals. Since the transgenes’ vectors carried Eu, then they were easily quantified with the x-ray emission. The labeling on the graph: NES carrying vectors in the nuclear compartment (blue diamonds) and in the NRNs (red squares); the no-NES vectors in the nuclear compartment (green triangles) and in the NRNs (yellow X). The concentration of the NES carrying vectors in the nucleoplasm was rapidly falling after microinjections. The concentration of the vectors in the NRNs fractions rapidly increased, what was indicative of the entry in and passage through the NRNs. The concentrations of the transgenes’ vectors were constantly increasing outside of the nuclei as the result of the constant export of the vectors driven by the NES. Absence of the NES resulted in the retention in the nucleoplasm and not entering the NRNs. The start- and end-point values were statistically analyzed and approved with the statistical significance from the t test at the P value<0.05.
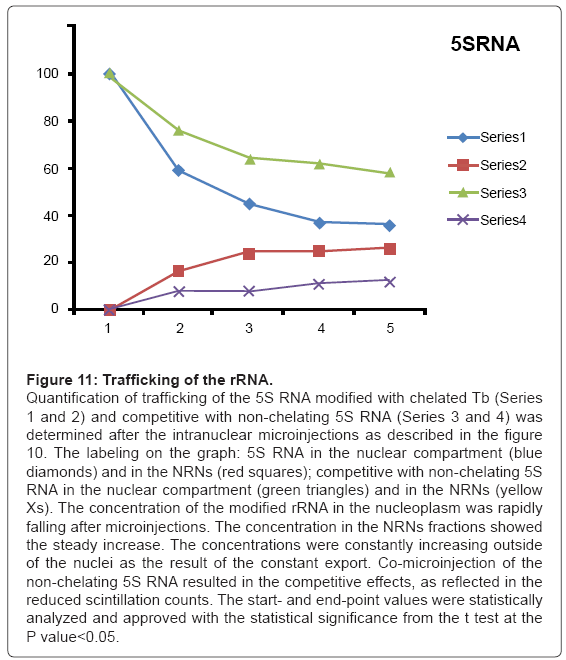
Figure 11: Trafficking of the rRNA.
Quantification of trafficking of the 5S RNA modified with chelated Tb (Series 1 and 2) and competitive with non-chelating 5S RNA (Series 3 and 4) was determined after the intranuclear microinjections as described in the figure 10. The labeling on the graph: 5S RNA in the nuclear compartment (blue diamonds) and in the NRNs (red squares); competitive with non-chelating 5S RNA in the nuclear compartment (green triangles) and in the NRNs (yellow Xs). The concentration of the modified rRNA in the nucleoplasm was rapidly falling after microinjections. The concentration in the NRNs fractions showed the steady increase. The concentrations were constantly increasing outside of the nuclei as the result of the constant export. Co-microinjection of the non-chelating 5S RNA resulted in the competitive effects, as reflected in the reduced scintillation counts. The start- and end-point values were statistically analyzed and approved with the statistical significance from the t test at the P value<0.05.
The outcome of the cytoplasmic microinjections of the transgenes’ vectors guided by the SV40 LTA NLS is shown in the Figure 8. The transgenes’ vectors concentrations into the cytoplasm slowly, but steadily, decreased. At the same time, the concentrations inside the NRNs+NPCs were initially increasing, thereafter stabilized. Microinjection of the same transgenes’ vectors, which were not modified with the NLS, resulted in their absence in the NRNs and NPCs. Gradually decreasing concentrations of the transgenes’ vectors in the areas of the injections were due to diffusion. For comparison with the rates and paths of trafficking of natural biomolecules the histones modified with the chelates were microinjected also in the perinuclear space as shown in the Figure 9. The curve of the trafficking is almost identical to that of the SV40 LTA NLS-driven vectors. The concentrations in the site of microinjections gradually were decreasing, while the concentrations of the modified histones in the NRNs+NPCs were slowly increasing. Competitive transport assay, in which the histones modified with the reporters were mixed with the non-modified histones, resulted in the reduced counts, due to competition for the trafficking routes. The results of the intra-nuclear microinjections of the trangenes’ vectors modified with the HIV Rev NES are illustrated in the Figure 10. The concentrations of the transgenes inside the nuclei were initially rapidly decreasing, which was followed by less rapid pace until the complete depletion. The entry of the vectors into and passage through the NRNs were indicated by the increasing count values. The vectors without the NES were residing in the nuclei as reflected by the constant values over time. Clearly, they were not entering the NRNs and NPCs. For comparison, the rRNA modified with the chelates was microinjected into the nuclei as illustrated in the Figure 11. Its concentrations in the NRNs and NPCs compartments were promptly increasing. At the comparable time intervals, their concentrations were decreasing in the nucleoplasm. The competition assay, which was set up by mixing the chelates-modified RNA with non-modified RNA, resulted in the reduced values of counts recorded during their entry into and passage through the NPCs and NRNs.
Altogether, the data acquired in these experiments provide the evidence for the NRNs, as the structures linking the NPCs and the genomic DNA, as we have illustrated in the Figure 12. Furthermore, these data demonstrate that the NRNs guide intranuclear trafficking of the molecules between the NPCs and gDNA.
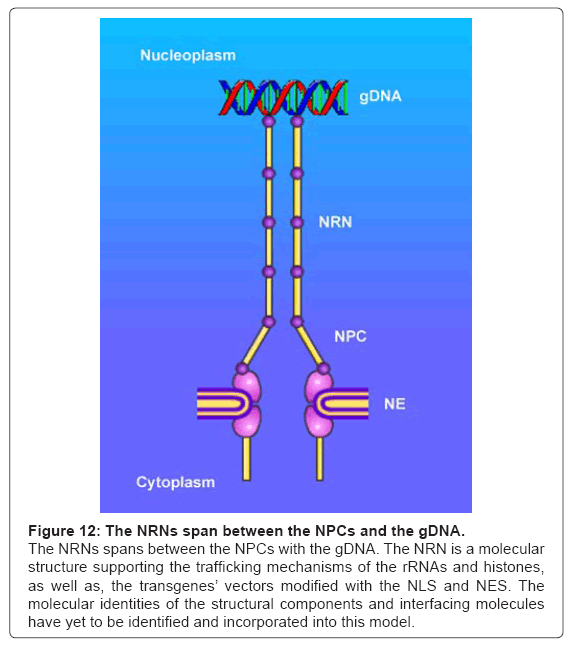
Figure 12: The NRNs span between the NPCs and the gDNA.
The NRNs spans between the NPCs with the gDNA. The NRN is a molecular structure supporting the trafficking mechanisms of the rRNAs and histones, as well as, the transgenes’ vectors modified with the NLS and NES. The molecular identities of the structural components and interfacing molecules have yet to be identified and incorporated into this model.
We attained the specific aim of this project by demonstrating that the Nuclear Routing Networks (NRNs) link the nuclear pore complexes and genomic DNA (gDNA) in oocytes of Xenopus laevis. For that purpose, we used the most advanced techniques of ultrastructural imaging. We already discussed advantages of cryoimmobilization and elemental mapping elsewhere [74]. The novel technical elements used in this study were: genetically engineered variable fragment antibodies targeting dsDNA and the DNA modified with the dNTP analogs, which were tagged with the exogenous metals. This approach opened the opportunity for exclusive detection of the labeling with the high specificity and high sensitivity, based upon the selective signal acquired by the EDXS or EELS, as well as NMRS or TRXFS. The signal was generated exclusively by the exogenous metal atoms chelated into the structure of the Fvs, but without any risk of false positive reading of unlabeled structures. The signal acquired from the labels was within a different physical modality than the images acquired for the nucleoplasm architecture; thus provided for unequivocal distinction between both. This approach eliminated false positive identification of the electron-dense labels, as it might happen with very small gold or platinum beads in Transmission Electron Microscopy (TEM) or strong secondary emitters in Scanning Electron Microscopy (SEM), if the labels would be acquired with the same imaging modality as the structures. It also eliminated missed labels-as false negatives, due to IgG antibodies modified with nanoparticles, which resulted in the big radius of uncertainty and poor penetration. Therefore, this was a great advantage over the labeling with the gold or platinum conjugates with the IgG antibodies. Furthermore, the scFv or dsFvs having approximately 5-20 kDa molecular weights were much smaller and more specific than 155 kDa IgG antibodies, thus resulted in much higher labeling efficiency and reflecting distribution of sought biomolecules more accurately.
We also demonstrated the trafficking of the RNA and histones along the NRNs in the nuclei of Xenopus laevis. These arrangements not only match, but also help in explaining data reported by other authors, that the molecules were aligned along the single file tracks [34- 37]. Those observations could be explained in the light of our findings, that those molecules were guided by the NRNs.
We also demonstrated that the NRNs did originate at the tops of the NPCs and did bind the gDNA. This affirms that the nuclear routing network is a molecular framework for the mechanisms of nucleoplasmic trafficking between the gDNA and the NPCs and vice versa. This concept could match well with the data reported by the other authors that not only interchromatin channels contain Tpr and the filaments projecting from the NPCs contain nucleoporins, but also that these are the DNA binding proteins [63-68]. If we extrapolate these properties onto the DNA binding capabilities of the NRNs revealed herein, then we may identify the molecular components of the NRNs and their functional dynamics. Our next step is to determine the structural, associated, and/or interfacing molecules, which may promote the interactions between the NRNs and gDNA. Moreover, it is to determine, if the distributions of the NRNs’ match those of the chromosomal territories [51]. We currently vigorously pursue these studies.
For the future endeavors, this work advances our efforts towards precise guided delivery of the biomolecules, including the transgenes’ vectors or transcription factors, to the targeted gene loci, where they can participate in the site specific recombination, repairs of the malfunctioning genes, or targeted reprogramming.
This work was supported by the NIH, NCRR within the RR570, by the NSF as the grants 9420056, 9522771, 9902020, and 0094016, by the PBMEF. The work was pursued at the National Biotechnology Resource, NIH, the Molecular Imaging Laboratory, UCSD, the National Biomedical NMR Resource, NIH, McArdle Cancer Research Laboratories, UW, the PBMEF, the BioSpin, the Bruker Optics, and the Genomics Center, SDSU; therefore the access to the instrumentation at those laboratories is gratefully acknowledged. Technical assistance by J. Dahlke, C. Dodivenaka, J. Haig, A. Hsu, S. Nagel, S. Sanchez, L. Truong, and L. Wohlwend is recognized. The gifts of Xenopus oocytes, DNA, and RNA from Dr J. Dahlberg, Dr D. Forbes, Dr M. Kloc, and Dr. E. Lund are gratefully acknowledged. Discussions with Dr T. Allen, Dr U. Aebi, Dr D. Bazett-Jones, Dr G. Blobel, Dr J.Dahlberg, Dr D. Forbes, Dr M. Kloc, Dr E. Lund, Dr H. Ris, Dr D. Spector, Dr A. Sumner, and Dr W. Szybalski are greatly appreciated.
The authors declare no conflict of interest.