Journal of Clinical Toxicology
Open Access
ISSN: 2161-0495
ISSN: 2161-0495
Research Article - (2026)Volume 16, Issue 2
Introduction: Several toxicological studies have suggested the involvement of Endocrine Disruptors (EDCs) in Nonalcoholic Fatty Liver Disease (NAFLD) and related metabolic disorders such as obesity and Type 2 Diabetes Mellitus (T2DM). Recently, nonylphenol (NP) has been identified as a potential factor in NAFLD. The purpose of this study was to investigate the progression of NP-induced disorders and the potential protective effects of the olive bioactives oleuropein (Ol) and hydroxytyrosol (Hd) on rats' liver and metabolic parameters.
Materials and Methods: Four rat groups were used: A control group (C), a Nonylphenol-Treated group (NP), a group treated with Nonylphenol and Oleuropein (NP+Ol), and a group treated with Nonylphenol and Hydroxytyrosol (NP+Hd). Various techniques were employed to assess chemical, hormonal, and histomorphometric changes. Serum nonylphenol and its derivatives were quantified using LC-MS/MS. Leptin and insulin serum concentrations were determined using sandwich ELISA kits. Adipose tissue parameters were assessed by Dual-energy X-ray Absorptiometry (DXA). Finally, histological sections of liver and adipose tissue were analyzed using ImageJ software.
Results: The NP-treated group exhibited metabolic disorder syndrome, characterized by Type 2 Diabetes Mellitus (T2DM), obesity, and Non-Alcoholic Fatty Liver Disease (NAFLD). Compared to controls, T2DM in these animals was confirmed by elevated serum glucose and insulin levels. Additionally, deterioration in hepatic antioxidant status was observed, marked by significant alterations in hepatic MDA and ABTS levels, alongside changes in serum biochemical parameters consistent with Toxicant-Associated Fatty Liver Disease (TAFLD). LC-MS/MS analysis of serum from NP-treated rats revealed a significant increase in nonylphenol concentrations, as well as newly generated endogenous polybrominated and polychlorinated nonylphenol derivatives. The administration of Oleuropein (Ol) and Hydroxytyrosol (Hd) improved hepatic function and ameliorated related physiological disorders
Conclusions: Olive bioactive molecules exhibit protective potential against nonylphenol-induced liver toxicity and related metabolic disorders.
Diabetes; Hydroxytyrosol; Liver; Nonylphenol; Obesity; Oleuropein
Endocrine-Disrupting Chemicals (EDCs) can adversely affect vital functions such as endocrinology, development and reproduction throughout all life stages [1-2]. Nonylphenol (NP) is one of the most widely used industrial EDCs. Its primary use is as an intermediate in the manufacture of Nonylphenol Ethoxylates (NPEs), and it is also used as a stabilizer in plastic food packaging. Due to its environmental persistence, NP has adverse effects on ecosystems [3]. Consequently, humans are constantly exposed to NP through contaminated water and food products. The lipophilic nature of NP leads to its accumulation in animal tissues, including the liver and adipose tissue [4-5]. The liver is the primary organ for the accumulation, biotransformation, and degradation of xenobiotics, especially environmental pollutants like nonylphenol [6]. In rat liver, nonylphenol is extensively glucuronidated by the UDP-glucuronosyltransferase isoform UGT2B1 [7]. The resulting glucuronides, such as NP-glucuronide and p-nonylcatechol glucuronide, are then excreted into the bile [8]. As an estrogen-mimetic compound, NP can interact with estrogen receptors in the liver and adipose tissue, leading to metabolic disorders, Nonalcoholic Fatty Liver Disease (NAFLD), Type 2 Diabetes Mellitus (T2DM), and obesity [9-11].
Phytoremediation is an emerging technology, and the use of green plants to counteract harmful environmental contaminants is of growing interest. The Mediterranean diet, rich in olives and olive oil, is renowned as one of the healthiest worldwide. Indeed, compounds from the olive tree have been demonstrated to offer numerous health benefits for metabolic diseases, such as lowering cholesterol levels and reducing the incidence of heart attacks and cancers [12-14]. Recently, phenolic compounds from olive leaves have been recommended as important therapeutic agents in preventive medicine. Among these, hydroxytyrosol and oleuropein have attracted particular attention [15-17]. These compounds have been shown to act as antioxidants, reducing Free Fatty Acid (FFA)- induced hepatocellular steatosis in HepG2 cells by decreasing the number and size of intracellular triglyceride droplets [18,19]. In cells throughout the body, they exert their therapeutic effects by modulating the activity of key enzymes involved in fatty acid metabolism, such as Acetyl-CoA Carboxylase (ACC), triglyceride synthesis, and cholesterogenesis [20].
Considering these previous findings, this study aimed to investigate whether co-treatment with nonylphenol and the olive bioactive molecules oleuropein and hydroxytyrosol can confer protective effects against liver disorders and related metabolic disorders induced by nonylphenol.
Chemicals and olive leaves phenolics
Chemicals and reagents: 4-Nonylphenol, methanol, ethyl acetate, and acetonitrile were purchased from Sigma-Aldrich Chemical (USA). 4-Nonylphenol (CAS: 84852-15-3) has a molecular weight of 220.35 g/mol, a density of 953 kg/m³, and a purity of 99.8%. This product was administered daily to rats by gavage after being dissolved in corn oil (Sigma-Aldrich Chemicals, USA).
Preparation of oleuropein and hydroxytyrosol rich extracts: Extracts rich in oleuropein and hydroxytyrosol were prepared from Olea europaea leaves, variety "Chemlali", from southern Tunisia (Sfax prefecture), as described in our previously published study [21].
Animal handling
All rat rearing and experimental procedures were approved by the institutional review committee and were conducted in accordance with the European Convention for the Protection of Vertebrate Animals Used for Experimental and Other Scientific Purposes (Council of Europe No. 123, Strasbourg, 1985). Adult male rats of the Swiss strain were purchased from the Central Pharmacy (SIPHAT, Tunisia). They were housed at 22 ± 3°C under a 12/12-hour light/dark cycle with a minimum relative humidity of 40%. The rats had free access to water and a commercial diet (SNA; Sfax, Tunisia), the chemical and calorific composition of which was precisely determined (Table 1).
| Nutrients | Values |
|---|---|
| Carbohydrates (q.s.p) | 750 |
| Proteins | 230 |
| Lipids | 65 |
| Vitamin mixture | 12 |
| Mineral mixture | 34 |
| Choline | 2.5 |
| Energy value (Kcal/Kg) | 4505 |
Table 1: Commercial diet composition (g/kg granular) (SNA, Sfax- Tunisie).
For the experimental protocol, forty rats were equally divided into four groups (n=10 per group).
• Control group (C): Treated with corn oil (vehicle) by gavage.
• Nonylphenol-treated group (NP): Received nonylphenol dissolved in corn oil by daily gavage at a dose of 1.5 mg/kg body weight.
• Nonylphenol and Oleuropein-treated group (NP+Ol): Received NP as above and oleuropein-rich extract in drinking water.
• Nonylphenol and Hydroxytyrosol-treated group (NP+Hd): Received NP as above and hydroxytyrosol-rich extract in drinking water.
The quantities of oleuropein and hydroxytyrosol in the olive leaf extracts were precisely determined by HPLC analysis and dissolved in drinking water to provide a dose of 16 mg/kg body weight per rat. The doses for oleuropein and hydroxytyrosol were selected based on previous results from Jemai et al. [15]. The NP dose was determined after testing various concentrations to assess physiological changes and viability in pilot rats (unpublished data from our laboratory). Daily food and water consumption were precisely measured throughout the treatment period. All rat groups were sacrificed after 15 days of treatment.
Following anesthesia by intraperitoneal injection of chloral hydrate, body weight and Body Mass Index (BMI) were measured for all rats. Blood samples were collected from the brachial artery into tubes containing lithium heparin. Serum samples were obtained after centrifugation at 2,200g for 15 min and used for LC-MS/MS, biochemical, and hormonal analyses. Three rats were randomly selected from each group for radiological and histological studies.
Serum LC-MS/MS analysis of Nonylphenol, derivatives, and metabolites
LC-MS/MS was used to determine the peak areas of serum nonylphenol, its derivatives, and metabolites (Figure 1). Three serum samples were randomly selected from each group. A 100 μl aliquot of serum was diluted with an equal volume of methanol. After centrifugation, 100 μl of acetonitrile was added to each sample, followed by a second centrifugation. From the resulting supernatant, 20 μl was taken for LC-MS/MS analysis. In the treated groups (NP, NP+Ol, NP+Hd), nonylphenol concentrations were calculated based on peak areas compared to those of a standard (Table 2).
| Parameters and treatments | C | NP | NP+OI | NP+Hd |
|---|---|---|---|---|
| Nonylphenol [3] | – | 2.12 ± 0.57a | 0.18 ± 0.43a | 0.32 ± 0.29a |
| Body weight (g) [10] | 280 ± 10a | 310 ± 15b | 258 ± 14a | 266 ± 17a |
| Food consumption (g/day/rat) [10] | 18.6 ± 1.8a | 16.3 ± 0.8a | 15.1 ± 1.1a | 15.2 ± 1.5a |
| Water consumption (g/day/rat) [10] | 32.8 ± 1.6a | 40.9 ± 0.8b | 26.1 ± 3.7ab | 24.1 ± 1.2a |
| Body mass index (g/cm2) [10] | 0.22 ± 0.01a | 0.28 ± 0.06b | 0.25 ± 0.08a | 0.24 ± 0.03a |
Note: (): number of determinations.
Values with the different letter superscripts indicate a significant change between groups (p<0.05).
Table 2: Serum nonylphenol peak areas LCMS/MS determination, body weights, body mass index (BMI) and daily food and water consumptions in adult control and treated male rats (group NP; group NP+Ol and group NP+Hd) for 15 days.
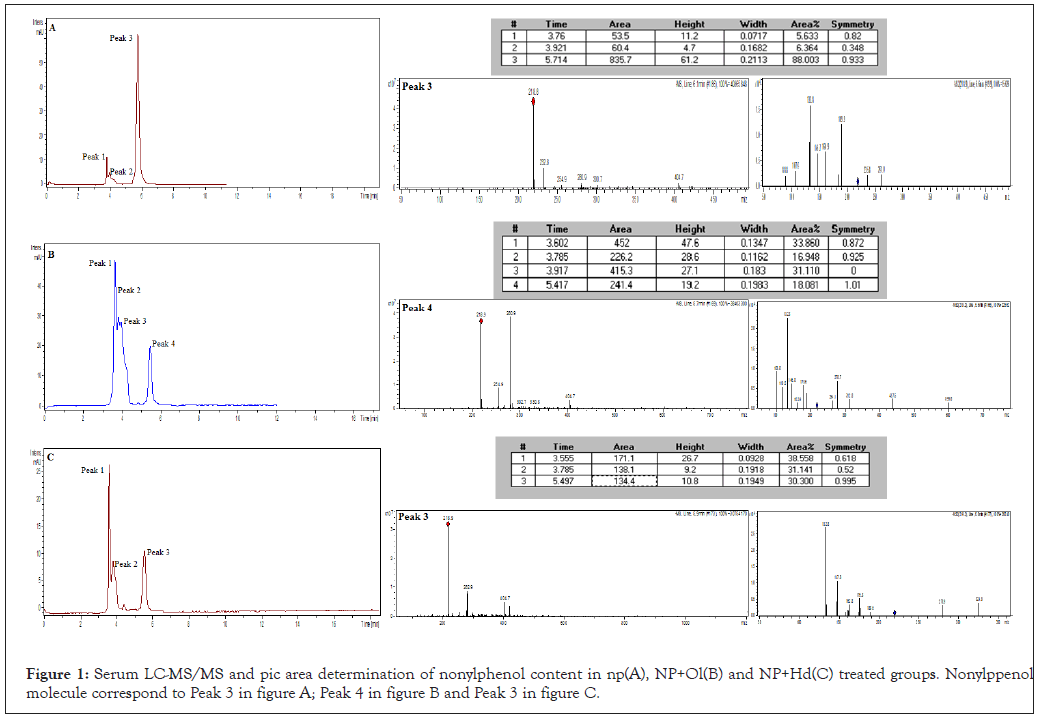
Figure 1: Serum LC-MS/MS and pic area determination of nonylphenol content in np(A), NP+Ol(B) and NP+Hd(C) treated groups. Nonylppenol molecule correspond to Peak 3 in figure A; Peak 4 in figure B and Peak 3 in figure C.
Biochemical and hormonal analysis
• Serum biochemical analysis: Serum samples (n=10) were analyzed for triglycerides, cholesterol, glucose, High-Density Lipoprotein (HDL), Low-Density Lipoprotein (LDL), AST, ALT, and ALP using commercial kits from Roche Laboratories on a Hitachi 912 analyzer.
• Serum insulin determination: Insulin levels were measured in six serum samples using a sandwich ELISA kit (S-type) from BioVendor. The assay involves capturing insulin with a biotin-conjugated anti-insulin antibody in monoclonal anti-insulin-coated wells. After incubation and washing, HRP-conjugated streptavidin is added. The reaction with a TMB substrate produces a yellow color, the absorbance of which is measured at 450 nm and is proportional to the insulin concentration.
• Serum leptin determination: Leptin levels were measured in six serum samples using a mouse/rat leptin ELISA from BioVendor. The assay involves capturing leptin in antibody-coated wells, followed by incubation with a biotin-labeled detection antibody and then streptavidin-HRP. The reaction with TMB substrate is stopped with an acidic solution, and the absorbance is measured at 450-630 nm, proportional to leptin concentration.
Liver cytosol extraction
Livers (n=10 per group) were used for cytosol extraction. A 1g portion of liver was homogenized in 10 ml of 1.15% KCl using an ultra-turrax at 4°C. This fraction was used for the determination of ABTS, MDA, and protein concentrations.
Total antioxidant capacity of livers: The Trolox Equivalent Antioxidant Capacity (TEAC) assay was used. The ABTS radical cation (ABTS•+) was generated and diluted to an absorbance of 0.70 (± 0.02) at 734 nm. A 1 ml aliquot of diluted ABTS•+ was added to 50 μl of cytosol sample or Trolox standard. After a 2-minute incubation, the decrease in absorbance at 734 nm was recorded. Results are expressed as mM Trolox equivalents.
Determination of TBARS: Thiobarbituric Acid-Reactive Substances (TBARS) were measured as a marker of lipid peroxidation [22]. A 200 μl cytosolic sample was mixed with reagents, heated, and then reacted with TBA. The resulting colored complex was extracted with butanol: Pyridine and measured at 532 nm using Malondialdehyde (MDA) as a standard.
Bradford liver protein determination: Protein concentration was determined using the Bradford method (Bio-Rad reagent). Absorbance was measured at 595 nm, and concentrations were calculated using a Bovine Serum Albumin (BSA) standard curve.
Fat pads Dual energy X-ray Absorptiometry (DXA)
Twelve rats (three per group) underwent whole-body multidetector CT (MDCT) using a 128-slice siemens somatom definition Adaptive Scanner (AS) scanner. Image analysis was performed on a Syngovia workstation. The following parameters were quantitatively measured: Liver density, relative subtesticular adipose tissue surface area, relative lateral subcutaneous fat surface area at the Level of the 1st Sacral vertebra (LS1), and interscapular adipose tissue volume. Coronal images were used for segmentation and analysis with Adobe Photoshop.
Liver density was measured by drawing Regions of Interest (ROIs) on axial slices at three levels (T12, L1, and segment VI). The relative subtesticular fat surface area was calculated as the ratio of the subtesticular fat area to the total scrotal surface area. The relative subcutaneous fat surface area at LS1 was calculated by manually outlining fat areas and reporting them to the total abdominal surface area at that level. Interscapular fat volume was determined using automatic oncologic software.
Liver and adipose tissue histological analysis
Three samples of liver and adipose tissue were randomly collected from each group. Tissues were fixed in 10% formaldehyde, embedded in paraffin, and sectioned at 5 μm. Sections were stained with hematoxylin and eosin (H&E) for routine histological examination. Histomorphometric parameters were analyzed using ImageJ software.
Statistical analysis
Data are presented as means ± Standard Error of the Mean (SEM). Statistical analyses were performed using GraphPad Prism 6 with a one-way analysis of variance (ANOVA). Comparisons between means were conducted using Tukey's HSD test.
Serum LC-MS/MS nonylphenol determination
Serum nonylphenol peak areas and concentrations in the NP+Ol and NP+Hd groups showed a significant decrease of 84% and 71%, respectively, compared to the NP-only group (Figure 1).
Serum LC-MS/MS nonylphenol derivatives and metabolites determination
As shown in Table 3, twenty-six polychlorinated, polybrominated, and ethoxylated nonylphenol derivatives were detected in the serum of rats in the NP group. After treatment with oleuropein (NP+Ol group) and hydroxytyrosol (NP+Hd group), the total number of derivatives decreased to seventeen and twenty, respectively. For NP metabolites, seven new metabolites were detected in the NP group (Table 4). After co-treatment with oleuropein and hydroxytyrosol, the number of metabolites increased to ten and eight, respectively.
| Compound | Exact mass | NP | NP+OI | NP+Hd |
|---|---|---|---|---|
| Nonylphenol | ||||
| 4-NP | 219 | + | + | + |
| 4-NPCl | 253 | + | + | + |
| 4-NPBr | 297 | + | − | + |
| 4-NP-DPE isomer 1 | 437 | + | + | + |
| 4-NP-DPE isomer 2 | 437 | + | + | + |
| 4-NPEO-1 (NH4+) | 282 | + | + | − |
| 4-BrNPEO-1 | 343 | + | − | − |
| 4-BrNPEO-1 (NH4+) | 360 | + | − | − |
| NPEO-2 | 309 | + | + | − |
| NPEO-2 (NH4+) | 326 | + | + | + |
| NPEO-2 (Na+) | 331 | + | + | + |
| ClNPEO-2 | 343 | + | − | − |
| ClNPEO-2 (Na+) | 365 | + | − | + |
| BrNPEO-2 | 387 | + | − | + |
| BrNPEO-2 (NH4+) | 404 | + | + | + |
| BrNPEO-2 (Na+) | 409 | + | − | + |
| NPEC-1 | 277 | + | + | + |
| 4-NP-Cl-OCH3 | 283 | + | + | + |
| NP-Br-OCH3 | 327 | + | + | + |
| 4-NP-Br-Cl-OCH3 | 361 | + | + | + |
| 4-NP-Br2-OCH3 | 405 | + | + | + |
| 4-NP-Br2‚-Cl-OCH3 | 438 | + | − | − |
| 4-NP-Cl-OCH3-DPE | 501 | + | + | − |
| 4-NP-Cl3-OCH3-DPE | 535 | + | + | + |
| 4-NP-Cl3-OCH3-DPE | 569 | + | + | + |
| 4-NP-Br2-OCH3-DPE | 545 | + | + | + |
| 4-NP-Br2‚-OCH3-DPE | 623 | + | − | + |
| Oleuropein derivatives | ||||
| Oleuropein | 540 | − | + | − |
| Oleuropein aglycone d1 | 571 | − | + | − |
| Oleuropein aglycone d2 | 555 | − | + | − |
| Oleuropein glucoside | 553 | − | + | − |
| Oleuropein sulfate | 457 | − | + | − |
| Hydroxytyrosol derivatives | ||||
| Hydroxytyrosol | 154 | − | − | + |
| Hydroxytyrosol glucoside | 329 | − | + | − |
| Hydroxytyrosol sulfate | 233 | − | − | + |
Table 3: LCMS/MS of nonylphenol, oleuropein, hydroxytyrosol and their derivatives in serum of adult control and treated male rats (NP group; NP+Ol group and NP+Hd group) for 15 days. +: molecule present in serum; −: molecule absent in serum..
| LC–MS NP, OI, Hd and metabolites | Exact mass | NP | NP+OI | NP+Hd |
|---|---|---|---|---|
| 4-n-Hydroxynonylphenol-β-D-glucuronide | 411 | + | + | − |
| 4-Nonylphenol-β-D-glucuronide | 395 | − | + | + |
| 4-n-Hydroxynonylphenol | 235 | − | + | − |
| Para-hydroxy benzoic acid glucuronide | 313 | + | + | − |
| 3-(4-hydroxyphenyl) propanol glucuronide | 327 | + | + | + |
| 3-(4-hydroxyphenyl)-2-propenoic acid glucuronide | 339 | + | + | − |
| 3-(4-hydroxyphenyl)-2-propionic acid glucuronide | 341 | + | − | + |
| Ring-hydroxylated 3-(4-hydroxyphenyl)-2-propionic acid sulfate | 261 | + | + | + |
| 3-(4-hydroxyphenyl)-2-propenoic acid sulfate | 243 | + | + | − |
| Para-hydroxy benzoic acid | 137 | − | + | + |
| Para-hydroxy benzoic acid sulfate | 217 | − | + | + |
| 3-(4-Hydroxy-phenyl)-2-propionic acid sulfate | 245 | − | + | + |
Table 4: LCMS/MS of nonylphenol metabolites determined in serum of adult control and treated male rats (NP group; NP+Ol group and NP+Hd group) for 15 days. +: molecule present in serum; −: molecule absent in serum.
Weights and feeding
Body weights and Body Mass Index (BMI): A significant increase in body weight (10%) and BMI (21%) was observed in the NP group compared to the control group (Table 2). In contrast, the NP+Ol and NP+Hd groups showed slight decreases in body weight (4% and 5%) and BMI (11% and 14%), respectively, compared to the NP group.
Food and water consumption: Food consumption decreased by 13% in the NP group compared to controls, while water intake increased by 20% (Table 2). In the NP+Ol and NP+Hd groups, a non-significant increase in food consumption (7% and 6%) was observed. Water consumption decreased by 19% and 14%, respectively, compared to the NP group.
Liver parameters
Liver weights, AST, ALT, and ALP serum parameters: No significant differences in liver weights were found between groups (Figure 2). Serum AST and ALT levels increased significantly in the NP group by 58% and 77%, respectively, compared to controls. Treatment with oleuropein and hydroxytyrosol (NP+Ol and NP+Hd groups) induced a significant decrease in AST (27% and 25%) and ALT (78% and 77%) levels compared to the NP group. ALP levels showed no significant change in the NP group but decreased by 20% in the NP+Ol group and returned to control levels in the NP+Hd group.
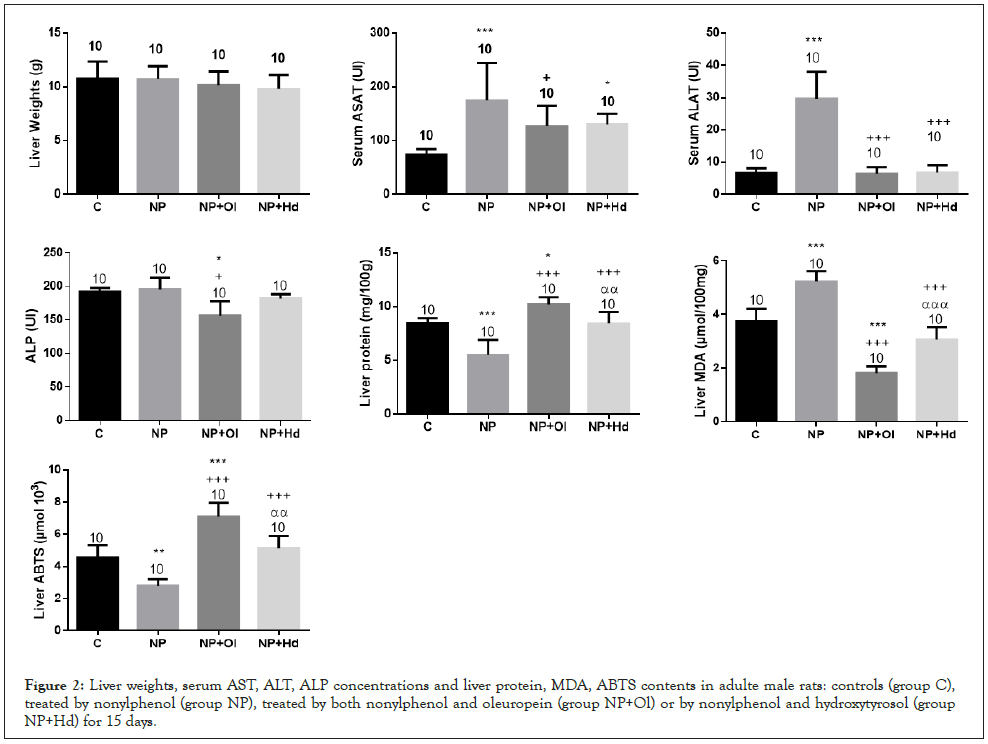
Figure 2: Liver weights, serum AST, ALT, ALP concentrations and liver protein, MDA, ABTS contents in adulte male rats: controls (group C), treated by nonylphenol (group NP), treated by both nonylphenol and oleuropein (group NP+Ol) or by nonylphenol and hydroxytyrosol (group NP+Hd) for 15 days.
Liver protein content: Liver protein content decreased significantly by 35% in the NP group compared to controls. Co-treatment with oleuropein and hydroxytyrosol increased liver protein content by 46% and 34%, respectively, compared to the NP group.
Liver TBARS content: Liver MDA content, an indicator of lipid peroxidation, increased by 25% in the NP group. Oleuropein and hydroxytyrosol supplementation ameliorated oxidative stress, decreasing MDA by 64% and 39%, respectively.
Liver ABTS content: The total antioxidant capacity (ABTS) decreased by 38% in the livers of the NP group. In the NP+Ol and NP+Hd groups, liver ABTS content increased by 45% and 60%, respectively.
Parameters of lipid balance
Serum glucose and insulin contents:NP treatment led to increased serum glucose (8%) and insulin (67%) concentrations. Only oleuropein co-treatment (NP+Ol group) induced a partial recovery, reducing glucose by 15% compared to the NP group.
Serum leptin and triglyceride contents:No significant increase in serum leptin was found in the NP group. However, triglycerides increased by 36%. Oleuropein and hydroxytyrosol treatments did not significantly reverse these changes compared to the NP group.
Serum cholesterol, HDL, and LDL contents: NP treatment decreased serum cholesterol (17%), LDL (32%), and HDL (10%) levels. Co-treatment with olive leaf extracts resulted in a total recovery of cholesterol and HDL levels and a partial recovery of LDL levels compared to controls (Figure 3).
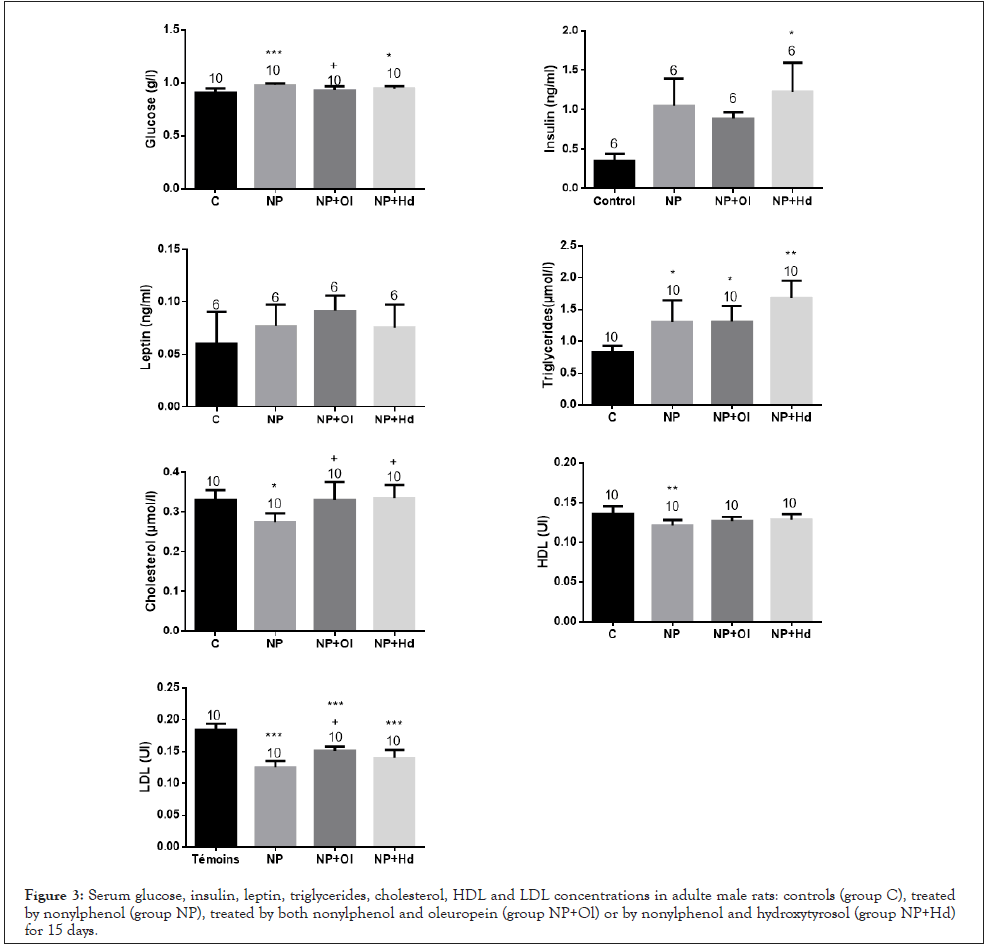
Figure 3: Serum glucose, insulin, leptin, triglycerides, cholesterol, HDL and LDL concentrations in adulte male rats: controls (group C), treated by nonylphenol (group NP), treated by both nonylphenol and oleuropein (group NP+Ol) or by nonylphenol and hydroxytyrosol (group NP+Hd) for 15 days.
Fat pads Dual energy X-ray Absorptiometry (DXA)
NP treatment increased all fat pad parameters: relative subtesticular fat surface area (60%), relative subcutaneous fat surface area at LS1 (36%), and interscapular fat volume (33%) (Table 5). Co-treatment with oleuropein (NP+Ol) decreased these parameters by 5%, 19%, and 24%, respectively, compared to the NP group, though values did not fully return to control levels. In the NP+Hd group, only interscapular fat volume showed a partial reversibility, decreasing by 20% compared to the NP group; other parameters increased compared to both the NP and control groups.
| Parameters | C | NP | NP+OI | NP+Hd |
|---|---|---|---|---|
| Relative subtesticular adipose tissue surface [3] | 0.147 ± 0.031a | 0.363 ± 0.034b | 0.338 ± 0.013ab | 0.597 ± 0.059b |
| Relative lateral subcutaneous fat LS1 [3] | 0.287 ± 0.029a | 0.449 ± 0.091b | 0.368 ± 0.138a | 0.698 ± 0.076b |
| Interscapular adipose tissue volume [3] | 0.243 ± 0.075a | 0.428 ± 0.031b | 0.325 ± 0.031ab | 0.341 ± 0.023ab |
| Coronal total fat surface [3] | 3.606 ± 0.721a | 5.169 ± 0.493b | 4.452 ± 0.460ab | 4.677 ± 0.062b |
| Coronal abdominal fat surface [3] | 3.107 ± 0.681a | 3.634 ± 0.394a | 3.562 ± 0.242a | 3.869 ± 0.164a |
| Scrotal fat surface [3] | 0.395 ± 0.090a | 0.655 ± 0.086b | 0.546 ± 0.152ab | 0.601 ± 0.029ab |
Note: ( ): number of determinations.
Values with the different letter superscripts indicate a significant change between groups (p < 0.05).
Table 5: Determination of fat pads parameters by dual energy X-ray absorptiometry (DXA) technic in adulte male rats: control group C and treated groups NP; NP+Ol and NP+Hd for 15 days.
Total and scrotal fat surface areas increased significantly in the NP group (30% and 40%, respectively). Co-treatment with oleuropein and hydroxytyrosol decreased these parameters by 14%/10% and 17%/8%, respectively. Abdominal adipose tissue surface area showed a non-significant increase (15%) in the NP group, which was slightly reduced (7%) in both polyphenol-treated groups.
Livers and adipose tissue histopathology
Livers from the NP group showed mild hepatocyte steatosis and ballooning, particularly around lobular venules (Figure 4). This was associated with a 28% increase in hepatocyte area and a 10% decrease in hepatocyte density. After treatment with oleuropein and hydroxytyrosol, the histological appearance of hepatocytes was restored, and all altered parameters were corrected.

Figure 4: Histological aspects (Gx100; Gx400; Gx1000), liver density, hepatocytes areas and steatosis score of adulte male rat’s liver sections. A: control; B: NP group; C: NP+Ol group and D: NP+Hd group.
Adipose tissue from NP rats exhibited an inflammatory aspect, with increased adipocyte areas (26%), fibrosis score (87%), inflammation, and significant leukocyte infiltration (Figure 5). Administration of oleuropein and hydroxytyrosol induced a decrease in adipocyte areas (30% and 33%) and fibrosis score (85% and 80%), associated with a clear improvement in adipose tissue histology.

Figure 5: Histological aspect (Gx100; Gx400), adipocytes areas and fibrosis score of adult male rats adipose tissue: A: control; B: NP group; C: NP+Ol group and D: NP+Hd group.
The widespread presence of the endocrine disruptor nonylphenol (NP) in numerous consumer products makes it a significant source of toxicity. This is particularly concerning given NP's lipophilic and estrogen-mimetic properties, which facilitate its rapid absorption into the bloodstream [23,24]. To better understand NP's behavior in the body, the first part of this work aimed to study its effects from both physiological and chemical perspectives. The second part investigated whether co-treatment with oleuropein and hydroxytyrosol could prevent NP-induced metabolic disorders.
On the physiological side, we used morphological, hormonal, biochemical, and histological analyses to study NP toxicity in adult male rats. The NP-treated group exhibited a metabolic disorder syndrome characterized by type 2 diabetes mellitus (T2DM), obesity, and Non-Alcoholic Fatty Liver Disease (NAFLD). Compared to controls, T2DM was confirmed by elevated serum glucose and insulin levels. This aligns with previous findings by Jubendradass et al., who demonstrated that NP increases plasma glucose and insulin while altering carbohydrate metabolism enzymes [25]. These authors also showed that NP downregulates hepatic insulin signaling reducing protein levels of insulin receptor (IR), IR substrate (IRS)-1, IRS-2, and phosphatidylinositol-3-kinase and increases hepatic HâOâ levels. Obesity in the NP-treated group was indicated by increases in Body Mass Index (BMI), DXA-measured fat pad surface area and volume, and leptin levels. This corresponded with enlarged histological adipose cell areas and a higher fibrosis score compared to controls. Furthermore, we observed the onset of NAFLD in this group. Histological liver sections revealed a fatty liver appearance, with hepatocyte ballooning and triglyceride droplet accumulation, where steatosis was dominant compared to control sections. Recent studies highlight the strong interrelationship between NAFLD, T2DM, and obesity, where the onset of one condition can trigger the others [26-28]. Our study proactively demonstrates that NP treatment triggers all three conditions concurrently in the same experimental model. These results are consistent with those of Yu et al., who studied NP-induced endocrine metabolic disorders in separate models [29-31].
Furthermore, NP can accumulate and persist in liver and adipose tissue by binding to estrogen receptors (ERα and ERβ) [30-34]. This triggers the xenobiotic-sensing nuclear receptor PXR, along with Bax and Caspase-3, and promotes an increased hepatic AMP/ATP ratio, oxidative stress, and lipid content [9,35,36]. Indeed, we found a deterioration in the liver's antioxidant status, marked by significant changes in hepatic MDA and ABTS levels, as well as in serum biochemical parameters, confirming a Toxicant-Associated Fatty Liver Disease (TAFLD) syndrome [37]. NP also increases the expression of lipogenic genes such as SREBP1, FAS, UCP2, and PPARs in both liver and adipose tissue [31,33]. This may explain the hepatic steatosis, inflammatory fibrosis in adipose tissue, and increased adipocyte volume observed in our histological sections [30,38,39]. In fact, major changes in PPAR expression in adipose tissue and liver and its target genes (FAS, Fab-4) activate the proinflammatory factor TNF-α, inducing steatosis and an inflammatory adipose tissue state, as noted in the NP group. Indeed, adipose tissue inflammation was linked not only to insulin resistance but also to the upregulation of PPARγ, as demonstrated by Meriga et al. [29,30,40].
To elucidate these metabolic disorders and investigate the evolution of NP's toxic potential in blood, we employed an LC-MS/MS method for the first time to track changes in NP blood levels and determine if physiological biotransformation generates new toxic metabolites. While previous studies using techniques like HPLC, LC-MS and LC/Tof-MS have demonstrated the in vitro generation of new chlorinated and brominated NP derivatives, no prior work had shown in vivo generated NP metabolites. Notably, we detected significant amounts of new chlorinated, brominated, dimeric, and isomeric NP derivatives in the treated group, reminiscent of those shown in the experimental model of Thurman [11,41-43]. Specifically, we identified twenty-six new endogenously generated products in the blood of adult male rats, including monobromo-nonylphenol (4-NPBr), mono-bromo-ammonium-ethoxynonylphenol-2 (BrNPO-2(NHââº)), mono-chloro-nonylphenol (4-NPCl), methoxy-chloro-nonylphenol (4-NP-Cl-OCHâ), and dimers such as methoxy-chloro-nonylphenol diphenylether (4-NP-Cl-OCHâ-DPE) and nonylphenol diphenylether isomer 1 (4-NP-DPE), among other unidentified endocrine disruptors. These newly generated toxic products form in response to the body's normal enzymatic and mineral balance, potentially intensifying NP's overall toxicity. These findings warrant further study to evaluate the toxic potential of each compound individually and their possible interactions.
To identify potential bioactive molecules that could remediate NP-induced disorders, we opted for a novel approach using oleuropein and hydroxytyrosol extracted from olive leaves. Numerous studies have demonstrated that oleuropein and its derivative hydroxytyrosol possess potent antioxidant, hepatoprotective (against NAFLD), and hypolipidemic effects [44-46]. In the NP+Ol and NP+Hd co-treatment groups, we observed significant hepatic protection from NP intoxication. This was confirmed by normalized liver weights, improved serum biochemical parameters (ASAT, ALAT, ALP, protein), and a better hepatic antioxidant status (MDA, ABTS) compared to the NP-only group. Several previous studies have extensively discussed the antioxidant power of oleuropein and hydroxytyrosol in various metabolic disorder contexts [47-49]. Specifically, Ol and Hd reduce the expression of genes involved in oxidative stress and lipid peroxidation, lower proinflammatory cytokine genes, and thereby reduce lipogenesis, inflammation, and insulin resistance, exerting a beneficial effect on NAFLD [50-52].
Moreover, supplementing the drinking water of NP-treated rats with oleuropein and hydroxytyrosol corrected imbalances in BMI, leptin, insulin, serum glucose, adipose tissue histology, and DXA parameters. This physiological improvement may stem from a reduction in the toxic potential of NP and its derivatives. Our LC-MS/MS serum analysis supports this, showing decreased NP blood levels and the absence of many new toxic metabolites found in the NP-only group, alongside an ameliorated oxidative stress status. Indeed, olive leaf extracts rich in oleuropein and hydroxytyrosol reduced serum concentrations of NP and its newly formed endogenous derivatives, improving hepatic function both qualitatively and quantitatively and contributing to the abolition of further metabolic disorders.
The authors declare that there are no known conflicts of interest associated with this publication, and there has been no significant financial support for this work that could have influenced its outcome.
Citation: Ghorbel H (2025). Nonylphenol Induced Liver Metabolic Disorders and Possible Remediation by Oleuropein and Hydroxytyrosol. J Clin Toxicol. 15:612.
Received: 01-Dec-2025, Manuscript No. JCT-25-39349; Editor assigned: 03-Dec-2025, Pre QC No. JCT-25-39349 (PQ); Reviewed: 16-Dec-2025, QC No. JCT-25-39349; Revised: 23-Dec-2025, Manuscript No. JCT-25-39349 (R); Published: 30-Dec-2025 , DOI: 10.35248/2475-3181.25.15.615
Copyright: This is an open access article distributed under the terms of the Creative Commons Attribution License, which permits unrestricted use, distribution, and reproduction in any medium, provided the original work is properly cited.